Mathematics > Final Exam Review > MAT 510 Week 11 Final Exam (All)
MAT 510 Week 11 Final Exam
Document Content and Description Below
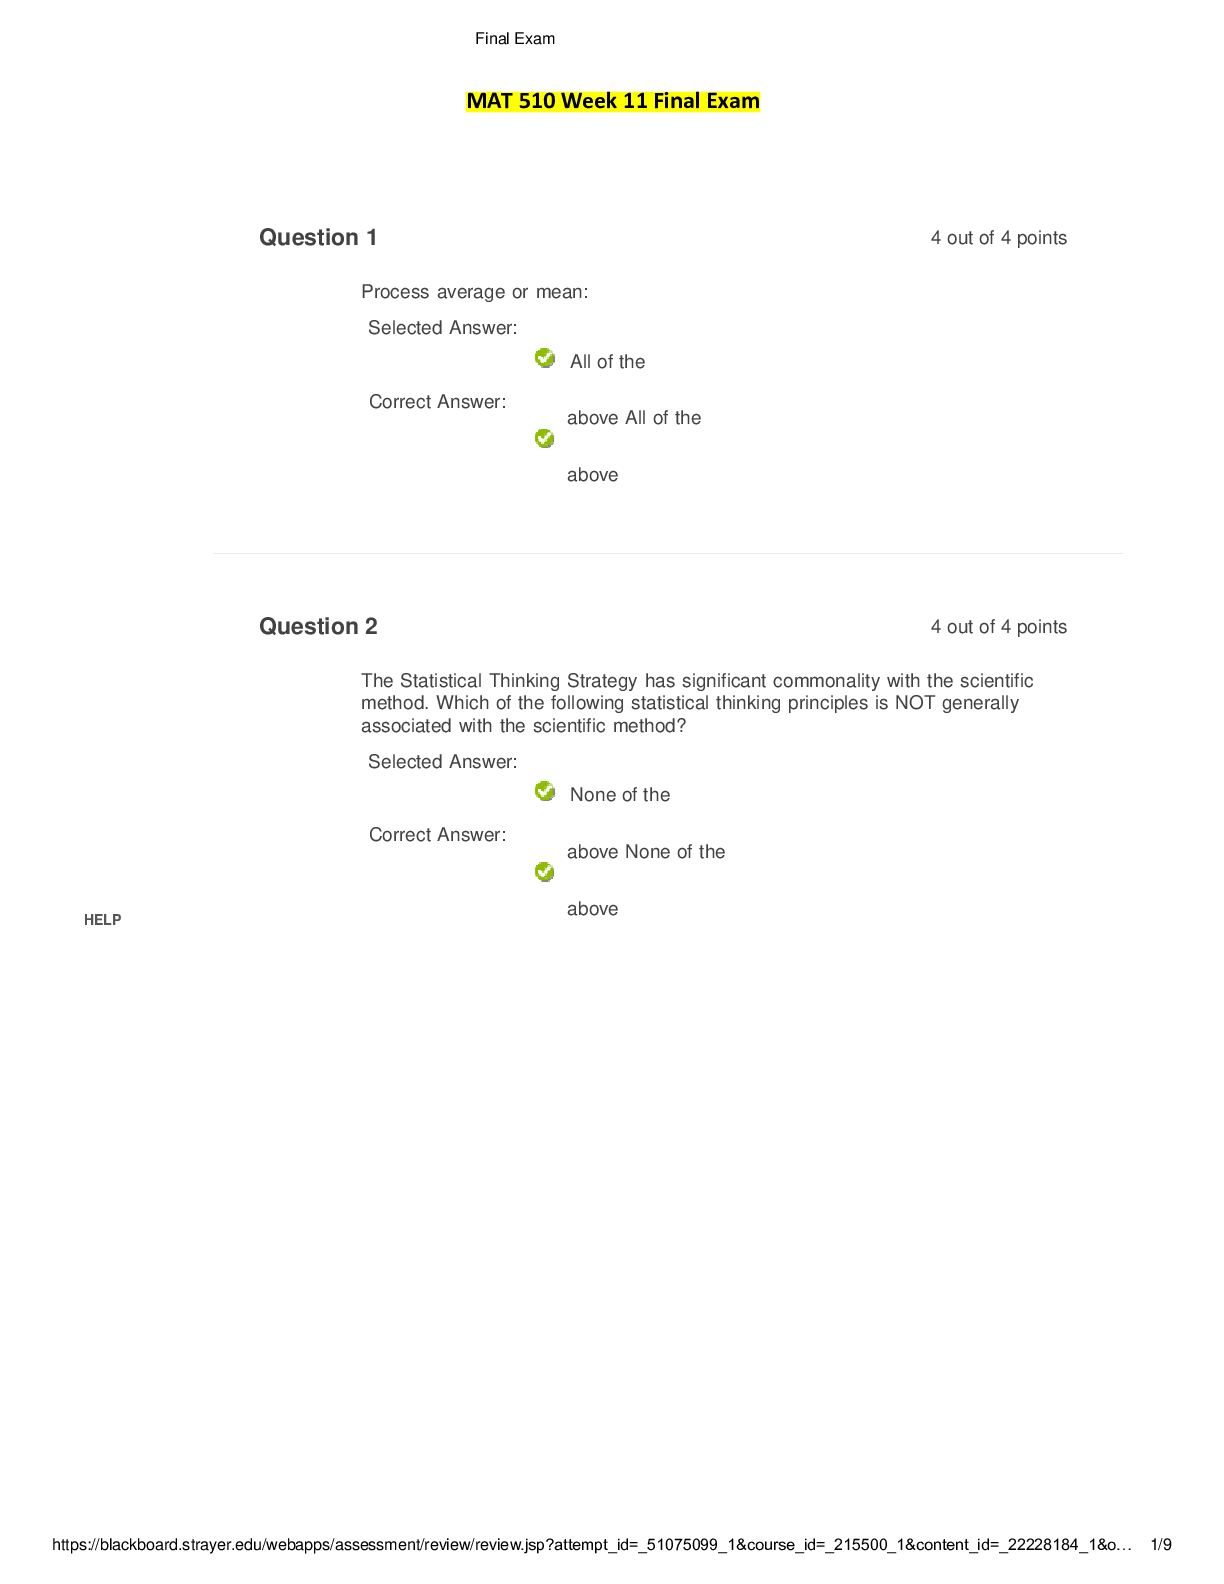
Final Exam https://blackboard.strayer.edu/webapps/assessment/review/review.jsp?attempt_id=_51075099_1&course_id=_215500_1&content_id=_22228184_1&o… 1/9 MAT 510 Week 11 Final Exam Question 1 Proc... ess average or mean: Selected Answer: 4 out of 4 points Correct Answer: Question 2 All of the above All of the above 4 out of 4 points The Statistical Thinking Strategy has significant commonality with the scientific method. Which of the following statistical thinking principles is NOT generally associated with the scientific method? Selected Answer: HELP Correct Answer: None of the above None of the aboveFinal Exam https://blackboard.strayer.edu/webapps/assessment/review/review.jsp?attempt_id=_51075099_1&course_id=_215500_1&content_id=_22228184_1&o… 2/9 Question 3 4 out of 4 points Refer to Figure 3.21 and choose the correct statement for the measurements Selected Answer: Correct Answer: Question 4 Measure C is not accurate but has good precision Measure C is not accurate but has good precision 4 out of 4 points The Hidden Factory is: Selected Answer: A source of Increased costs and reduced process capacity Correct Answer: A source of Increased costs and reduced process capacity Question 5 4 out of 4 points Suppose the Process Improvement Framework were used to attack a problem where the process in question was inherently unstable. Which of the following would be a likely result of this effort? Selected Answer: Immediate opportunities for improvement would be missed Correct Answer: Immediate opportunities for improvement would be missed Question 6 4 out of 4 pointsFinal Exam https://blackboard.strayer.edu/webapps/assessment/review/review.jsp?attempt_id=_51075099_1&course_id=_215500_1&content_id=_22228184_1&o… 3/9 In evaluating data on our process outputs, four characteristics we might investigate are: central tendency, variation, shape of distribution, and stability. Which of the following tools would be most helpful to determine the shape of the distribution? Selected Answer: Correct Answer: Question 7 Histogram Histogram 4 out of 4 points A sample of 50 invoices are inspected each shift for errors, and classified as either “good”, i.e., without error, or “bad”, having some problem. If we plot our bad invoices each shift on a control chart, which chart should we use? Selected Answer: Correct Answer: Question 8 Either p or np chart Either p or np chart 4 out of 4 points A main purpose of a control chart is to: Selected Answer: Correct Answer: Question 9 Detect special cause variation in the process Detect special cause variation in the process 0 out of 4 points What does it mean if capability index Cp is less than 1? Selected Answer: Correct Answer: None of the above Process spread is greater than the specificationFinal Exam https://blackboard.strayer.edu/webapps/assessment/review/review.jsp?attempt_id=_51075099_1&course_id=_215500_1&content_id=_22228184_1&o… 4/9 Question 10 4 out of 4 points In evaluating data on our process outputs, four characteristics we might investigate are: central tendency, variation, shape of distribution, and stability. Which of the following tools would be most helpful to determine stability of the process? Selected Answer: Correct Answer: Question 11 Run chart Run chart 4 out of 4 points A statistic that is used to indicate too much correlation between the predictors in a regression analysis is called the: Selected Answer: Correct Answer: Question 12 Variance inflation factor Variance inflation factor 4 out of 4 points Tips for building useful models include: Selected Answer: Correct Answer: Question 13 B, C and D above B, C and D above 4 out of 4 pointsFinal Exam https://blackboard.strayer.edu/webapps/assessment/review/review.jsp?attempt_id=_51075099_1&course_id=_215500_1&content_id=_22228184_1&o… 5/9 Which of the following is NOT a measure of model adequacy? Selected Answer: Correct Answer: Question 14 Residuals have mean = 0 Residuals have mean = 0 4 out of 4 points Results of regression analysis are often abused in the following ways: Selected Answer: Correct Answer: Question 15 All of the above All of the above 4 out of 4 points An Adjusted R-square value is a correlation coefficient that has been modified to account for: Selected Answer: Correct Answer: Question 16 Number of predictor variables in the model Number of predictor variables in the model 4 out of 4 points In the experimental layout below, which are the most important factors? Factor A Factor B Factor C Y -1 -1 -1 150 1 -1 -1 148 -1 1 -1 156 1 1 -1 158 -1 -1 1 137 1 -1 1 132Final Exam https://blackboard.strayer.edu/webapps/assessment/review/review.jsp?attempt_id=_51075099_1&course_id=_215500_1&content_id=_22228184_1&o… 6/9 -1 1 1 145Final Exam https://blackboard.strayer.edu/webapps/assessment/review/review.jsp?attempt_id=_51075099_1&course_id=_215500_1&content_id=_22228184_1&o… 7/9 1 1 1 147 Selected Answer: Correct Answer: Question 17 Factors B and C Factors B and C 4 out of 4 points This technique is used to eliminate the effects of nuisance factors (e.g., machines, day of week, and season of year) from an experiment. Selected Answer: Correct Answer: Question 18 Blocking Blocking 4 out of 4 points What should one consider when analyzing the results of an experiment? Selected Answer: Correct Answer: Question 19 All the above All the above 4 out of 4 points A 32 experiment means that we are experimenting with: Selected Answer: Correct Answer: Three levels of two factors Three levels of two factorsFinal Exam https://blackboard.strayer.edu/webapps/assessment/review/review.jsp?attempt_id=_51075099_1&course_id=_215500_1&content_id=_22228184_1&o… 8/9 Question 20 4 out of 4 points Identify the assumption that is NOT made when conducting an experiment: Selected Answer: Correct Answer: Question 21 The experimental variation is small The experimental variation is small 4 out of 4 points I have made a mistake in copying data into my computer to perform a large regression model with 20 independent variables. Basically, I ended up with random data in each of the columns. However, I accidentally ran the regression anyway. Making reasonable assumptions, which of the following outcomes is most likely? Selected Answer: We find one of the regression coefficient p-values was below .05 Correct Answer: We find one of the regression coefficient p-values was below .05 Question 22 0 out of 4 points We have conducted an election poll of 600 likely voters, collected as randomly as possible. The 95% confidence interval (CI) for those planning to vote for Senator Smith is about 55% +/- 4%. How many additional likely voters would we need to poll to reduce the CI width to +/- 2%? Hint – you do not need to calculate the exact value to answer this question. Selected Answer: Correct Answer: 1,200 1,800Final Exam https://blackboard.strayer.edu/webapps/assessment/review/review.jsp?attempt_id=_51075099_1&course_id=_215500_1&content_id=_22228184_1&o… 9/9 Question 23 4 out of 4 points After running an ANOVA comparing the average years of experience between five different job classifications, we obtained a p value of .02. Which of the following would be a reasonable conclusion concerning the population in this case? Selected Answer: We have strong evidence to state that at least two of the job classifications have different average ages Correct Answer: We have strong evidence to state that at least two of the job classifications have different average ages Question 24 4 out of 4 points I have calculated an interval to document the uncertainty in my estimate of the long-term standard deviation I will experience in time to pay invoices in my business going forward. Baaed on this information, this should be considered what type of interval? Selected Answer: Correct Answer: Question 25 Confidence interval for a parameter Confidence interval for a parameter 4 out of 4 points We conducted a t test to compare the average cycle time to approve two different types of loans, auto and personal. The p-value for the t test was -.03, where the hypotheses were: H0: Auto - Per. = 0 H0: Auto - Per. 0 Which of the following would be plausible values for the endpoints of a 95% confidence interval for ( Auto - Per.)? Selected Answer: Correct Answer: -15.3 to -5.1 -15.3 to -5.1Final Exam https://blackboard.strayer.edu/webapps/assessment/review/review.jsp?attempt_id=_51075099_1&course_id=_215500_1&content_id=_22228184_1&o… 10/9 Friday, September 22, 2017 12:44:30 PM EDT ← OK [Show More]
Last updated: 1 year ago
Preview 1 out of 10 pages
Reviews( 0 )
Document information
Connected school, study & course
About the document
Uploaded On
May 15, 2021
Number of pages
10
Written in

Additional information
This document has been written for:
Uploaded
May 15, 2021
Downloads
0
Views
36