Statistics > QUESTIONS & ANSWERS > Chamberlain College of Nursing - MATH 399NWeek 3 Quiz with All Answers. (All)
Chamberlain College of Nursing - MATH 399NWeek 3 Quiz with All Answers.
Document Content and Description Below
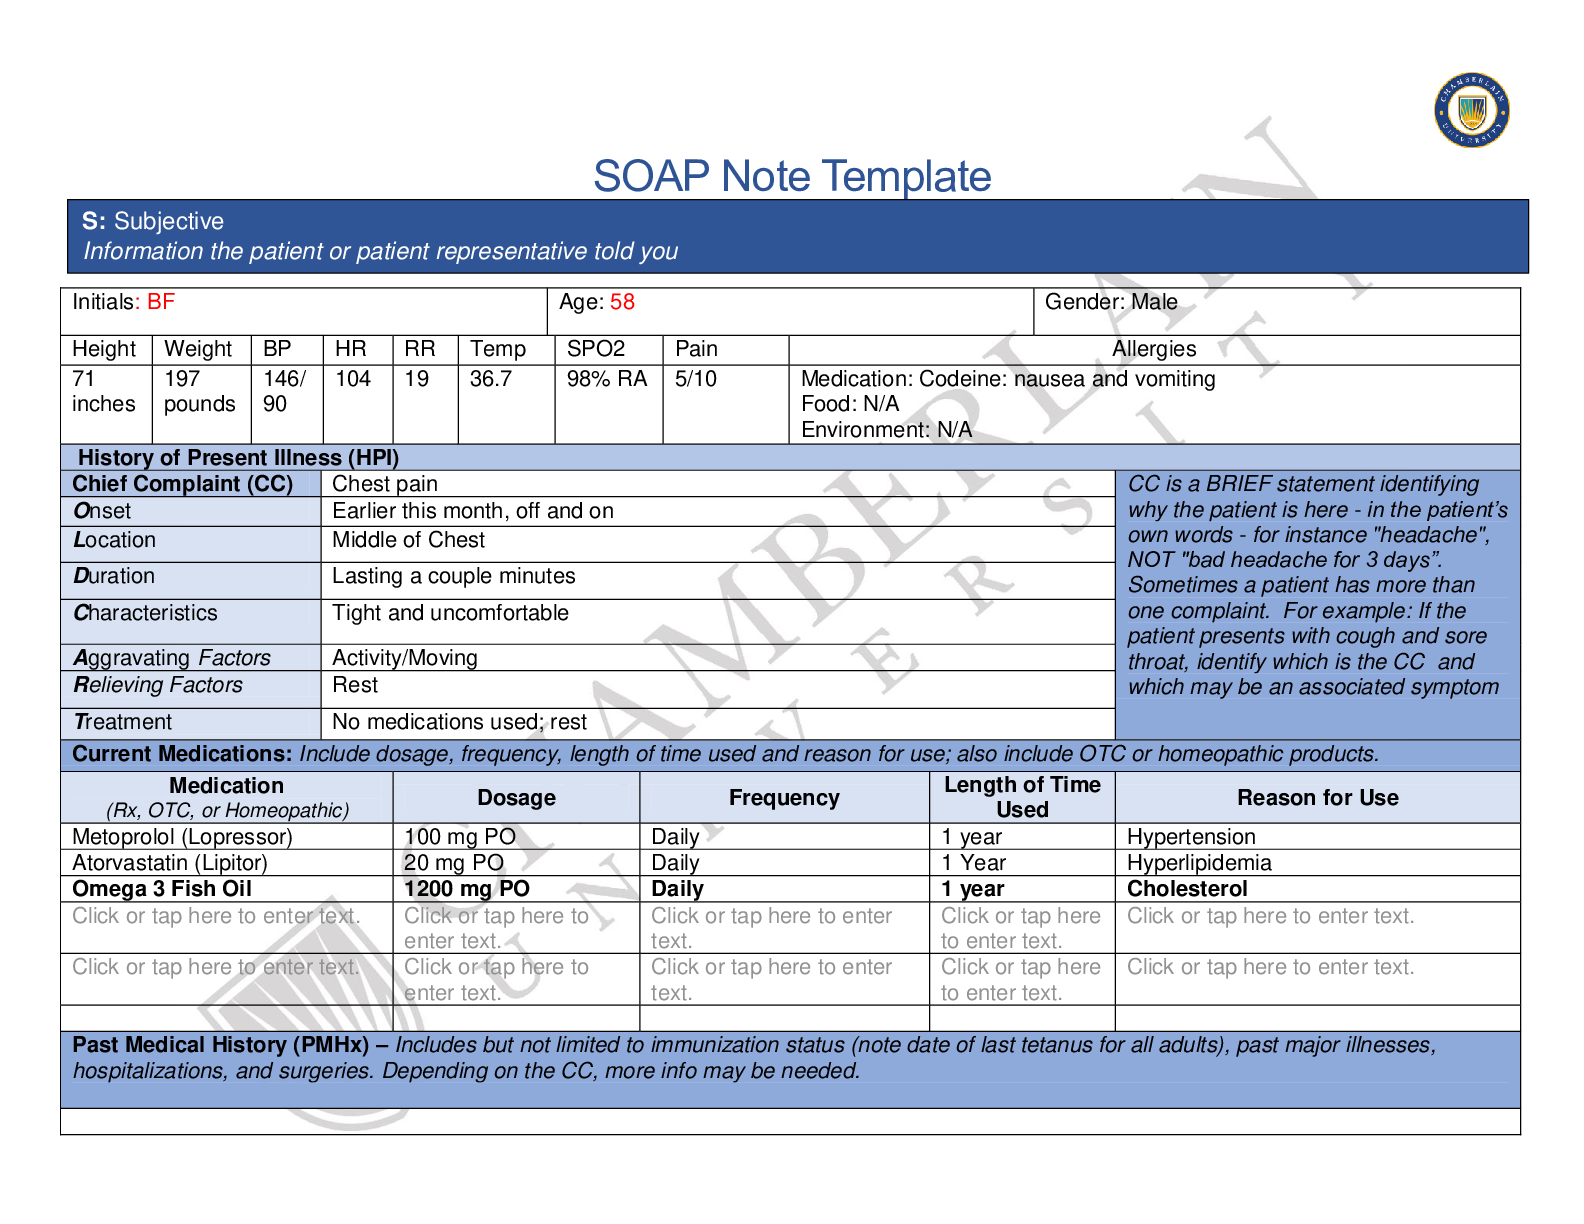
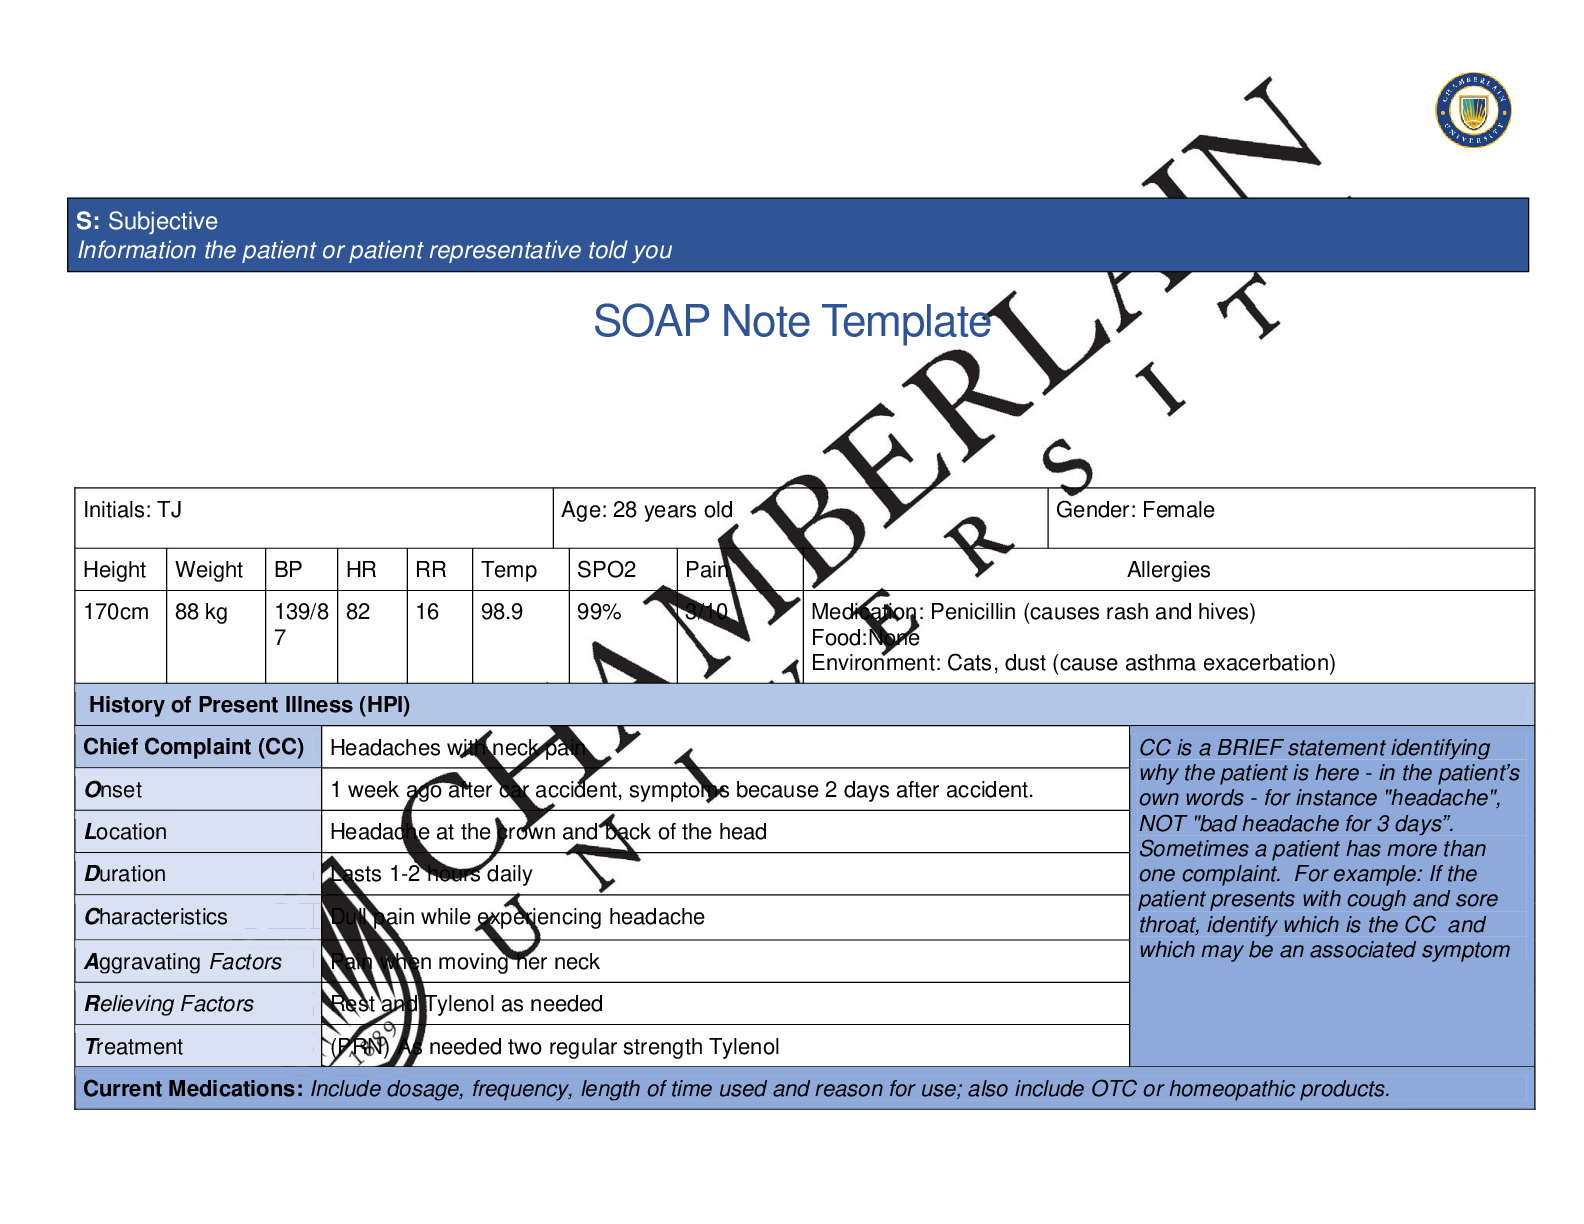
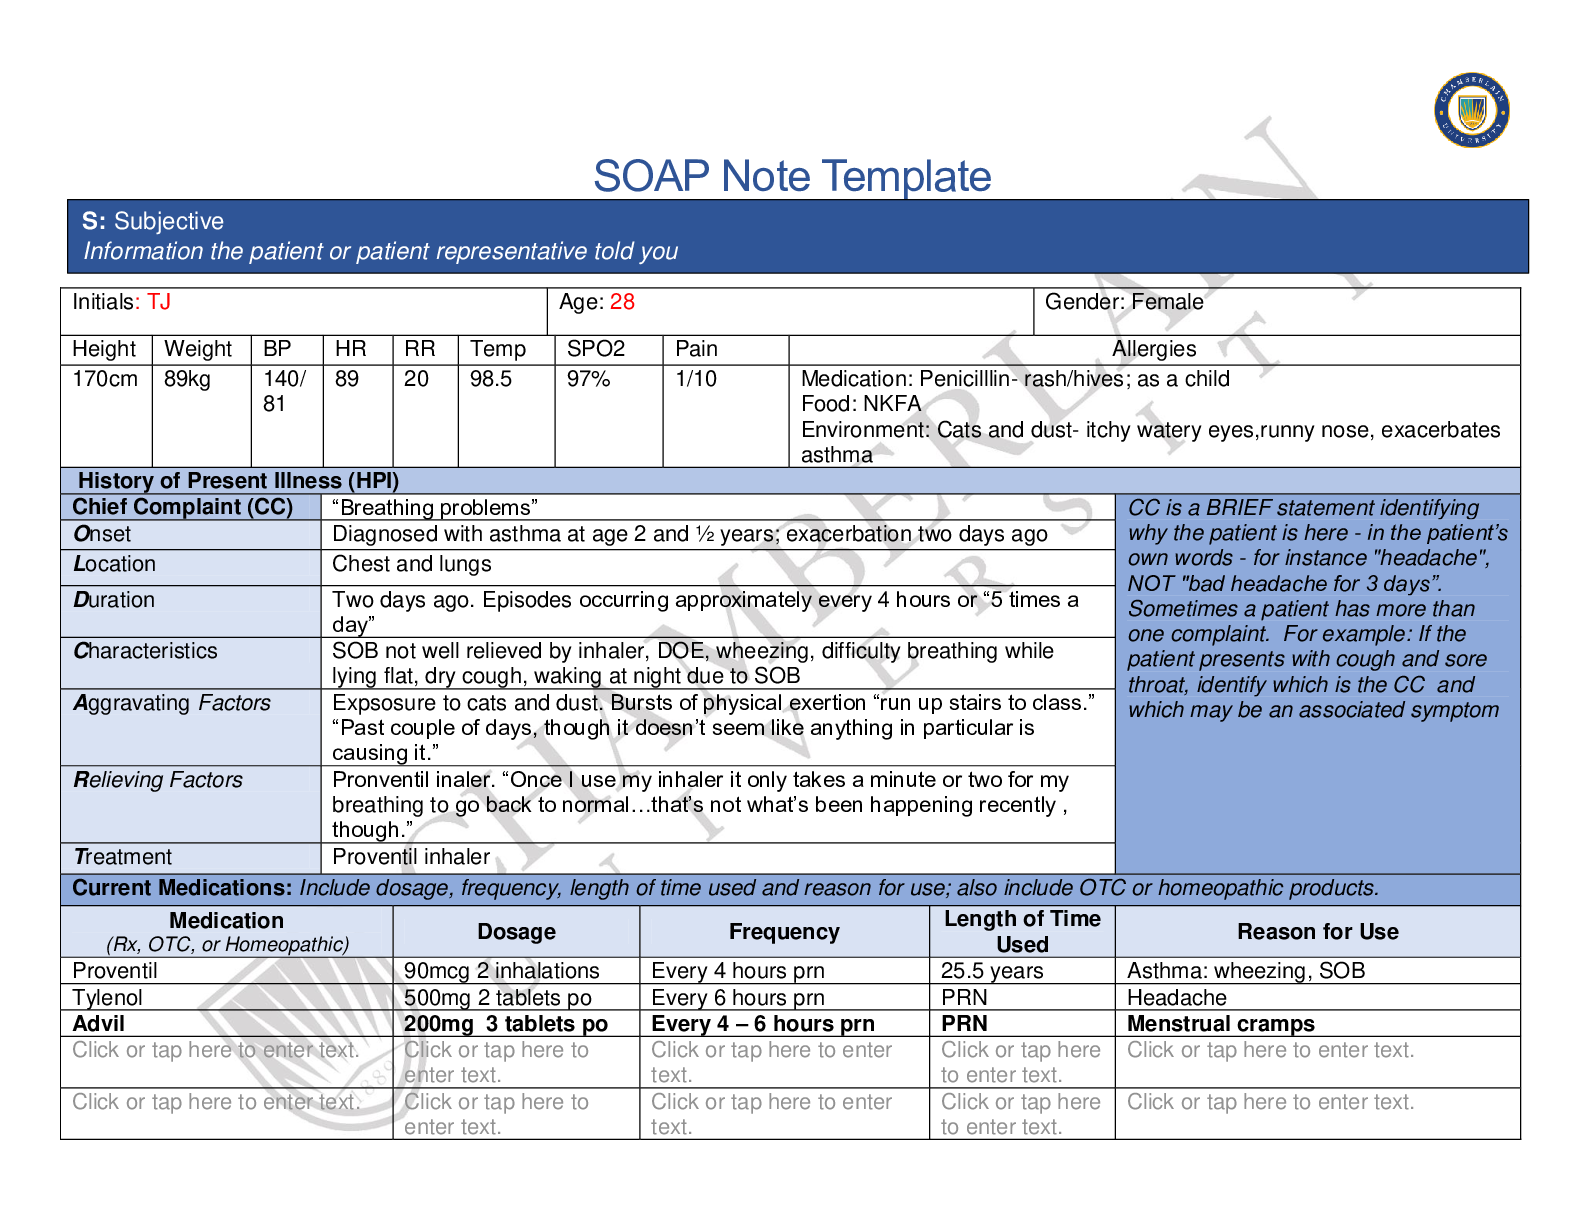
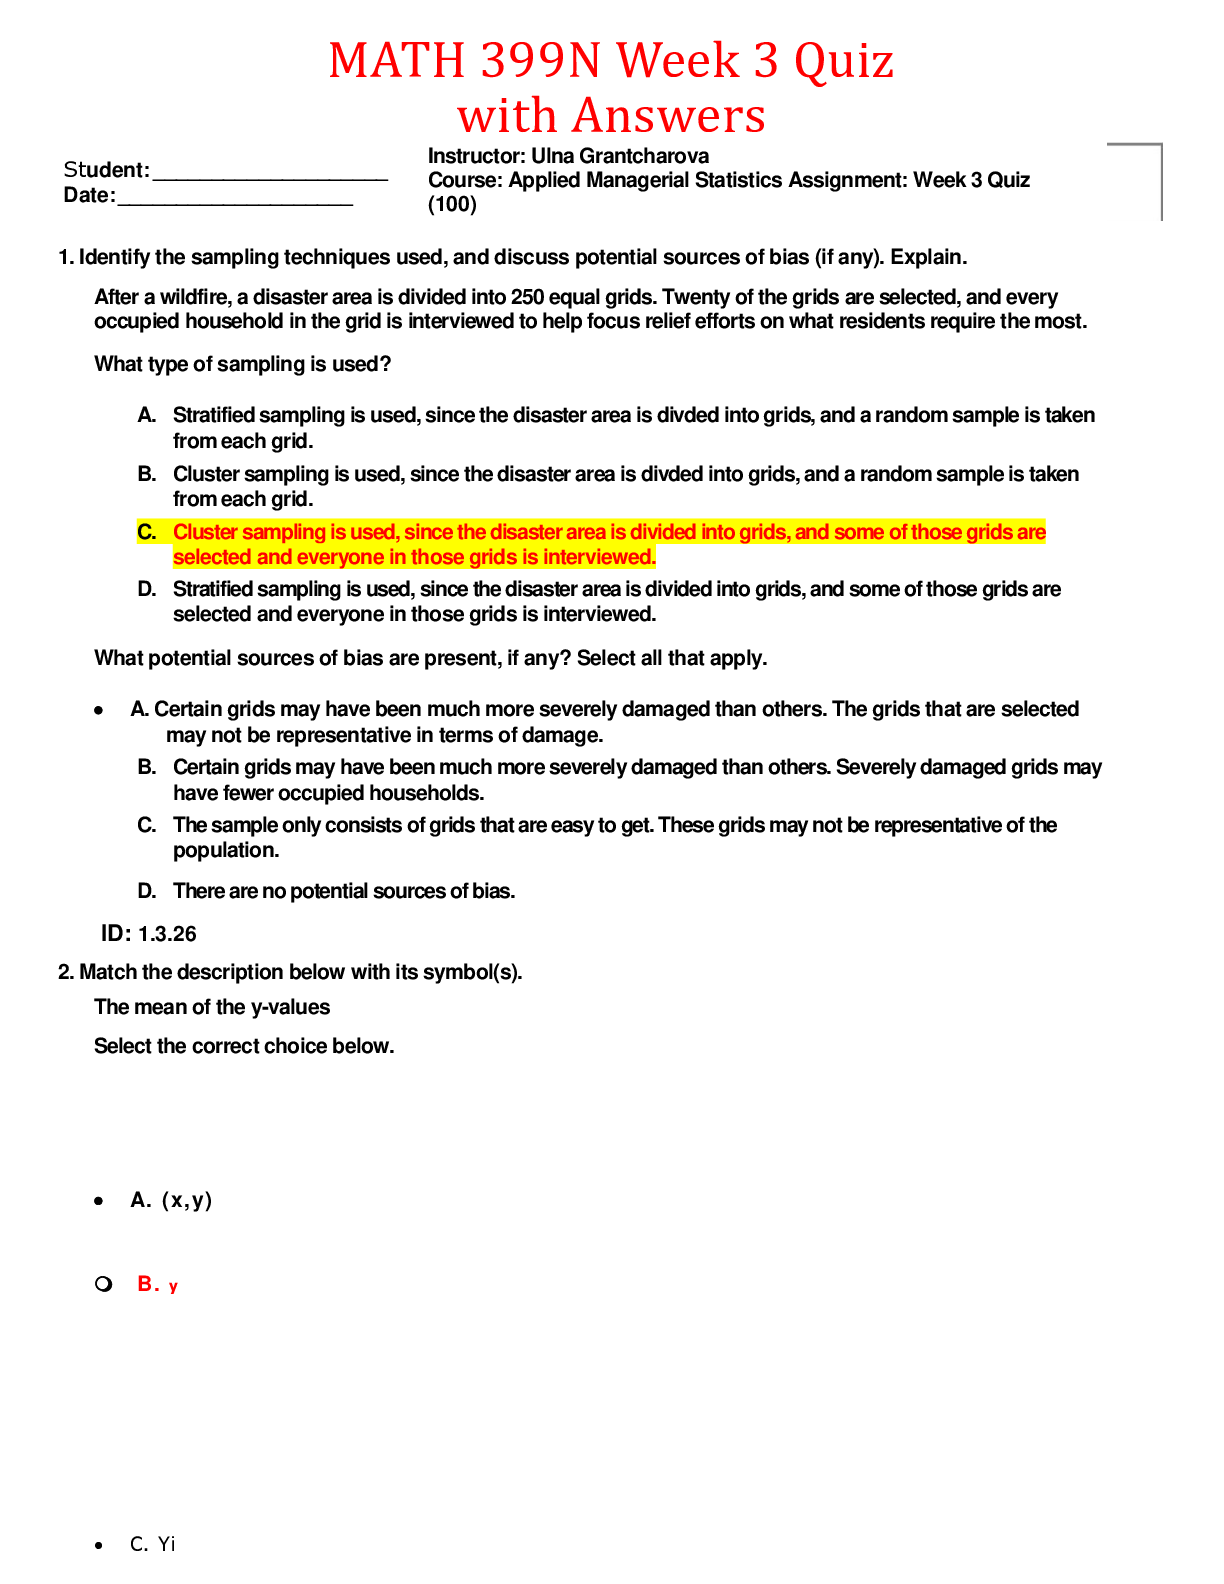
41912016 Week 3 Quiz Student: Date: Instructor: Ulna Grantcharova Course: Applied Managerial Statistics Assignment: Week 3 Quiz (100) 1. Identify the sampling techniques used, and discuss pote... ntial sources of bias (if any). Explain. After a wildfire, a disaster area is divided into 250 equal grids. Twenty of the grids are selected, and every occupied household in the grid is interviewed to help focus relief efforts on what residents require the most. What type of sampling is used? A. Stratified sampling is used, since the disaster area is divded into grids, and a random sample is taken from each grid. B. Cluster sampling is used, since the disaster area is divded into grids, and a random sample is taken from each grid. C. Cluster sampling is used, since the disaster area is divided into grids, and some of those grids are selected and everyone in those grids is interviewed. D. Stratified sampling is used, since the disaster area is divided into grids, and some of those grids are selected and everyone in those grids is interviewed. What potential sources of bias are present, if any? Select all that apply. • A. Certain grids may have been much more severely damaged than others. The grids that are selected may not be representative in terms of damage. B. Certain grids may have been much more severely damaged than others. Severely damaged grids may have fewer occupied households. C. The sample only consists of grids that are easy to get. These grids may not be representative of the population. D. There are no potential sources of bias. ID: 1.3.26 2. Match the description below with its symbol(s). The mean of the y-values Select the correct choice below. • A. (x,y) m B. y • C. Yi C D. ( E. Ili C: F. b ID: 9.2.11 4/9/2016 Week 3 Quiz 3. Use a stem-and-leaf plot to display the data. The data represent the heights of eruptions by a geyser. What can you conclude about the data? 106 90 110 150 140 120 100 130 110 103 116 102 98 107 102 120 116 130 97 120 Choose the correct stem-and-leaf plot. (Key: 15 I 5 =155) A. B. C. 9 078 9 078 9 0 10 0 2 2 3 6 7 10 026 10 07 11 0066 11 003 11 0028 12 000 12 002 12 0 0 2 3 6 7 13 00 13 007 13 0066 14 0 14 066 14 00 15 0 15 00 15 0 What can you conclude about the data? A. It appears that most eruptions have a height greater than 110. B. It appears that most eruptions have a height of around 120. C. It appears that most eruptions have a height between 11 and 13. D. It appears that most eruptions have a height less than 135. E. It appears that most eruptions have a height of around 12. ID: 2.2.17 4. Suppose the scatter plot shows the results of a survey of 48 randomly selected males ages 24 to 35. Using age as the explanatory variable, choose the appropriate description for the graph. Explain your reasoning. (a) Age and body temperature (b) Age and balance on student loans (c) Age and income (d) Age and height The response variable is (1)INCOME because you would expect this variable and age to have (2)A positive correlation and (3)high variation for adult males. (1) height (2) a positive correlation (3) 0 low income no correlation 0 high balance on student loans a negative correlation body temperature ID: 9.1.15 4192016 Week 3 Quiz 5. Determine whether the approximate shape of the distribution in the histogram is symmetric, uniform, skewed left, skewed right, or none of these. 20[111w 10 0 Choose the best answer below. C A. Skewed left C B. Symmetric m C. Uniform • D. Skewed right m E. None of these ID: 2.3.11 6. Determine whether the following statement is true or false. If it is false, rewrite it as a true statement. Data at the ratio level cannot be put in order. Choose the correct answer below. A. The statement is false. A true statement is "Data at the ratio level can be placed in a meaningful order." B. The statement is false. A true statement is "Data at the ratio level can be ordered, although it is impossible to determine if one data value is a multiple of another." • C. The statement is true. C D. The statement is false. A true statement is "Data at the ratio level can be ordered, although it is impossible to subtract data values." ID: 1.2.6 41912016 Week 3 Quiz 7. The ages (in years) of a random sample of shoppers at a gaming store are shown. Determine the range, mean, variance, and standard deviation of the sample data set. 12, 21, 23, 14, 13, 16, 19, 18, 14, 15 The range is 11 (Simplify your answer.) The mean is (Simplify your answer. Round to the nearest tenth as needed.) The variance is (Simplify your answer. Round to the nearest hundredth as needed.) The standard deviation is (Simplify your answer. Round to the nearest tenth as needed.) ID: 2.4.15 8. Heights of men on a baseball team have a bell-shaped distribution with a mean of 179 cm and a standard deviation of 8 cm. Using the empirical rule, what is the approximate percentage of the men between the following values? a. 171 cm and 187 cm b. 155 cm and 203 cm a. % of the men are between 171 cm and 187 cm. (Round to one decimal place as needed.) b. % of the men are between 155 cm and 203 cm. (Round to one decimal place as needed.) ID: 2.4.29 9. Determine whether the underlined numerical value is a parameter or a statistic. Explain your reasoning. A survey of 42 out of hundreds in a dining hall showed that 17 enjoyed their meal. Choose the correct answer below. m A. Parameter, because the data set of all people in the dining hall is a population. C B. Statistic, because the data set of 42 people in a dining hall is a population. m C. Statistic, because the data set of 42 people in a dining hall is a sample. m D. Parameter, because the data set of 42 people in a dining hall is a population. m E. Statistic, because the data set of all people in the dining hall is a sample. m F. Parameter, because the data set of 42 people in a dining hall is a sample. m G. Parameter, because the data set of all people in the dining hall is a sample. ( H. Statistic, because the data set of all people in the dining hall is a population. ID: 1.1.37 https://www.coursehero.com/file/28534717/Week-3-Quiz-with-Answerspdf/ 4/9/2016 Week 3 Quiz 10. Use the value of the linear correlation coefficient to calculate the coefficient of determination. What does this tell you about the explained variation of the data about the regression line? About the unexplained variation? r= - 0.105 Calculate the coefficient of determination. (Round to three decimal places as needed.) What does this tell you about the explained variation of the data about the regression line? % of the variation can be explained by the regression line. (Round to one decimal place as needed.) About the unexplained variation? % of the variation is unexplained and is due to other factors or to sampling error. (Round to one decimal place as needed.) ID: 9.3.7 https://www.coursehero.com/file/28534717/Week-3-Quiz-with-Answerspdf/ 4/9/2016 Week 3 Quiz 11. Find the equation of the regression line for the given data. Then construct a scatter plot of the data and draw the regression line. (The pair of variables have a significant correlation.) Then use the regression equation to predict the value of y for each of the given x-values, if meaningful. The number of hours 6 students spent for a test and their scores on that test are shown below. Hours spent studying, x 0 2 2 4 5 6 Test score, y 37 39 53 46 65 68 Find the regression equation. Y= x + ( (Round to three decimal places as needed.) Choose the correct graph below. _ A. B. (a) Predict the value of y for x = 2. Choose the correct answer below. m A. 42.9 m B. 53.0 m C. 45.4 m D. not meaningful (b) Predict the value of y for x = 3.5. Choose the correct answer below. m A. 42.9 m B. 101.1 m C. 53.0 m D. not meaningful (c) Predict the value of y for x = 13. Choose the correct answer below. (..), A. 45.4 m B. 101.1 m C. 53.0 m D. not meaningful (d) Predict the value of y for x = 1.5. Choose the correct answer below. („) A. 101.1 m B. 45.4 m C. 42.9 m D. not meaningful https://www.coursehero.com/file/28534717/Week-3-Quiz-with-Answerspdf/ 41912016 Week 3 Quiz ID: 9.2.19-T 12. The region of a country with the longest life expectancy for the past six years is shown below. Southern Northwest Eastern Western Southwest Southeast Determine whether the data are qualitative or quantitative and identify the data set's level of measurement. Are the data qualitative or quantitative? m Quantitative m Qualitative What is the data set's level of measurement? m A. Ratio m B. Interval m C. Nominal C D. Ordinal ID: 1.2.27 13. The equation used to predict the total body weight (in pounds) of a female athlete at a certain school is ... y = - 127 + 3.64x1 + 2.28x2, where x1 is the female athlete's height (in inches) and x2 is the female athlete's percent body fat, measured as x2%. Use the multiple regression equation to predict the total body weight for a female athlete who is 61 inches tall and has 22% body fat. The predicted total body weight for a female athlete who is 61 inches tall and has 22% body fat is pounds. (Round to the nearest tenth as needed.) Choose the correct answer below. m A. Fastest serve (in miles per hour) of a sample of top tennis players m B. Time (in minutes) it takes a sample of employees to drive to work m C. Top speeds (in miles per hour) of a sample of sports cars m D. Grade point averages of a sample of students with finance majors ID: 2.2.5 [Show More]
Last updated: 1 year ago
Preview 1 out of 8 pages
Reviews( 0 )
Document information
Connected school, study & course
About the document
Uploaded On
Jul 08, 2020
Number of pages
8
Written in

Additional information
This document has been written for:
Uploaded
Jul 08, 2020
Downloads
0
Views
73


.png)


.png)