Statistics > QUESTIONS & ANSWERS > BDA 1305AFEWeek_10_Exercies CORRECT ANSWERS HIGHLIGHTED IN RED.DOWNLOAD TO SCORE AN A (All)
BDA 1305AFEWeek_10_Exercies CORRECT ANSWERS HIGHLIGHTED IN RED.DOWNLOAD TO SCORE AN A
Document Content and Description Below
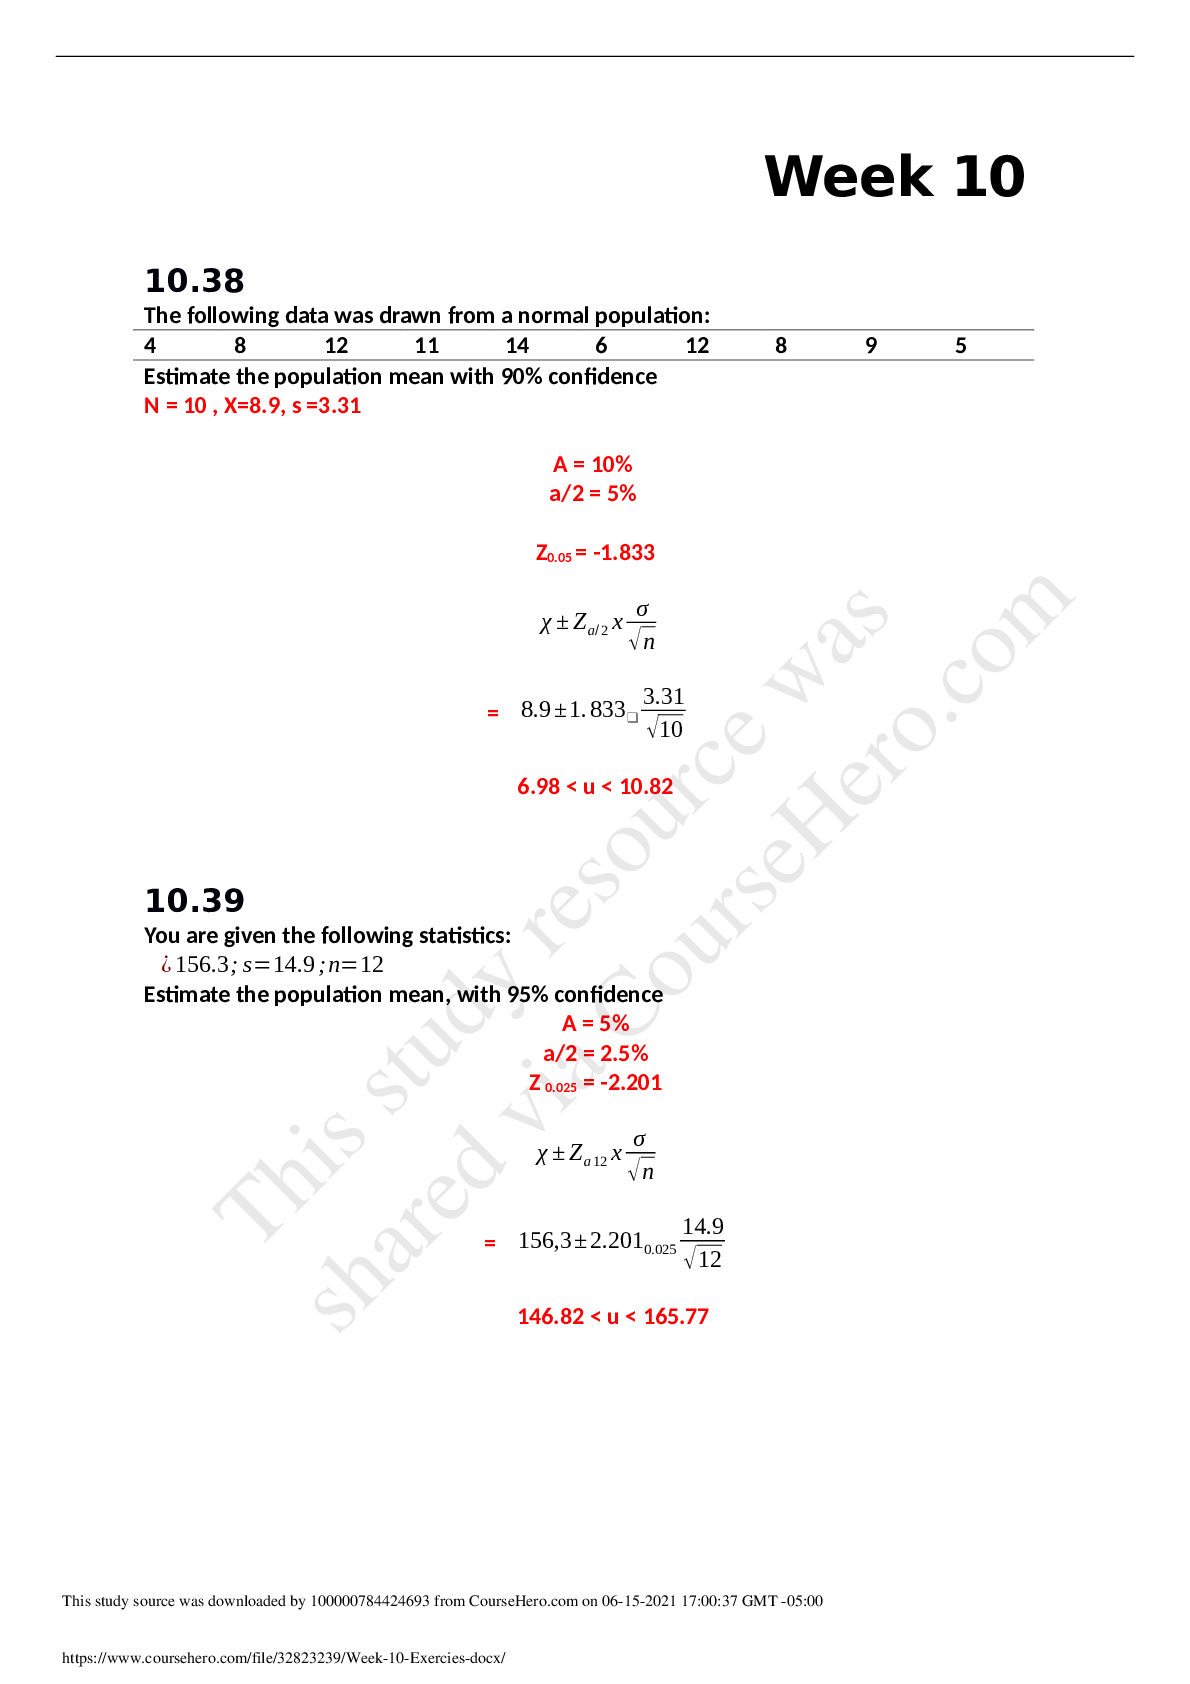
Week 10 10.38 The following data was drawn from a normal population: 4 8 12 11 14 6 12 8 9 5 Estimate the population mean with 90% confidence N = 10 , X=8.9, s =3.31 A = 10% a/2 = 5% Z0.05 = -... 1.833 χ ± Za/ 2 x σ √n = 8.9 ±1. 833❑ 3.31 √10 6.98 < u < 10.82 10.39 You are given the following statistics: ¿156.3; s=14.9;n=12 Estimate the population mean, with 95% confidence A = 5% a/2 = 2.5% Z 0.025 = -2.201 χ ± Za12 x σ √n = 156,3± 2.2010.025 14.9 √12 146.82 < u < 165.77 This study source was downloaded by 100000784424693 from CourseHero.com on 06-15-2021 17:00:37 GMT -05:00 https://www.coursehero.com/file/32823239/Week-10-Exercies-docx/ This study resource was shared via CourseHero.com10.46 a. A random sample of 25 observations was drawn from a population. The sample mean and standard deviation areX=510 and s=125. Estimate the population mean with 95% confidence A = 5% a/2 = 2.5% t0.025 = 2.064 χ ± Za12 x σ √n = 510±2.0640.025 125 √25 458.40 < u < 561.6 b. Repeat part a with n=50 A = 5% a/2 = 2.5% t0.025 = 2.009 χ ± Za12 x σ √n = 510±2.0090.025 125 √50 474.49 < u < 545.51 c. Repeat part a with n=100 A = 5% a/2 = 2.5% t0.025 = 1.984 χ ± Za12 x σ √n = 510±1/9840.025 125 √100 485.20 < u < 534.80 d. Describe what happens to the confidence interval estimate when the sample size increases This study source was downloaded by 100000784424693 from CourseHero.com on 06-15-2021 17:00:37 GMT -05:00 https://www.coursehero.com/file/32823239/Week-10-Exercies-docx/ This study resource was shared via CourseHero.com10.47 a. the mean and standard deviation of a sample of 100 isX=1500 and 2=300. Estimate the population mean with 95% confidence b. repeat part a with s = 200 c. repeat part a with s=100 d. discuss the effect on the confidence interval estimate of decreasing the standard deviation s 10.48 a. A statistics practitioner drew a random sample of 400 observations and found that X=700 and s=100. Estimate the population mean with 90% confidence b. Repeat part a with a 95% confidence level c. Repeat part a with a 99% confidence level d. What is the effect on the confidence interval estimate of increasing the confidence level? This study source was downloaded by 100000784424693 from CourseHero.com on 06-15-2021 17:00:37 GMT -05:00 https://www.coursehero.com/file/32823239/Week-10-Exercies-docx/ This study resource was [Show More]
Last updated: 1 year ago
Preview 1 out of 8 pages
Buy this document to get the full access instantly
Instant Download Access after purchase
Add to cartInstant download
We Accept:

Reviews( 0 )
$9.00
Document information
Connected school, study & course
About the document
Uploaded On
Jun 16, 2021
Number of pages
8
Written in

Additional information
This document has been written for:
Uploaded
Jun 16, 2021
Downloads
0
Views
42


.png)
.png)
.png)

 116 Questions and Verified Anwers Download to score an A.png)
