Mathematics > QUESTIONS & ANSWERS > Math 225n Week 6 Week 6 Confidence Intervals Questions and answers z 2021_Already Graded A. LATEST F (All)
Math 225n Week 6 Week 6 Confidence Intervals Questions and answers z 2021_Already Graded A. LATEST FOR 2021/2022
Document Content and Description Below
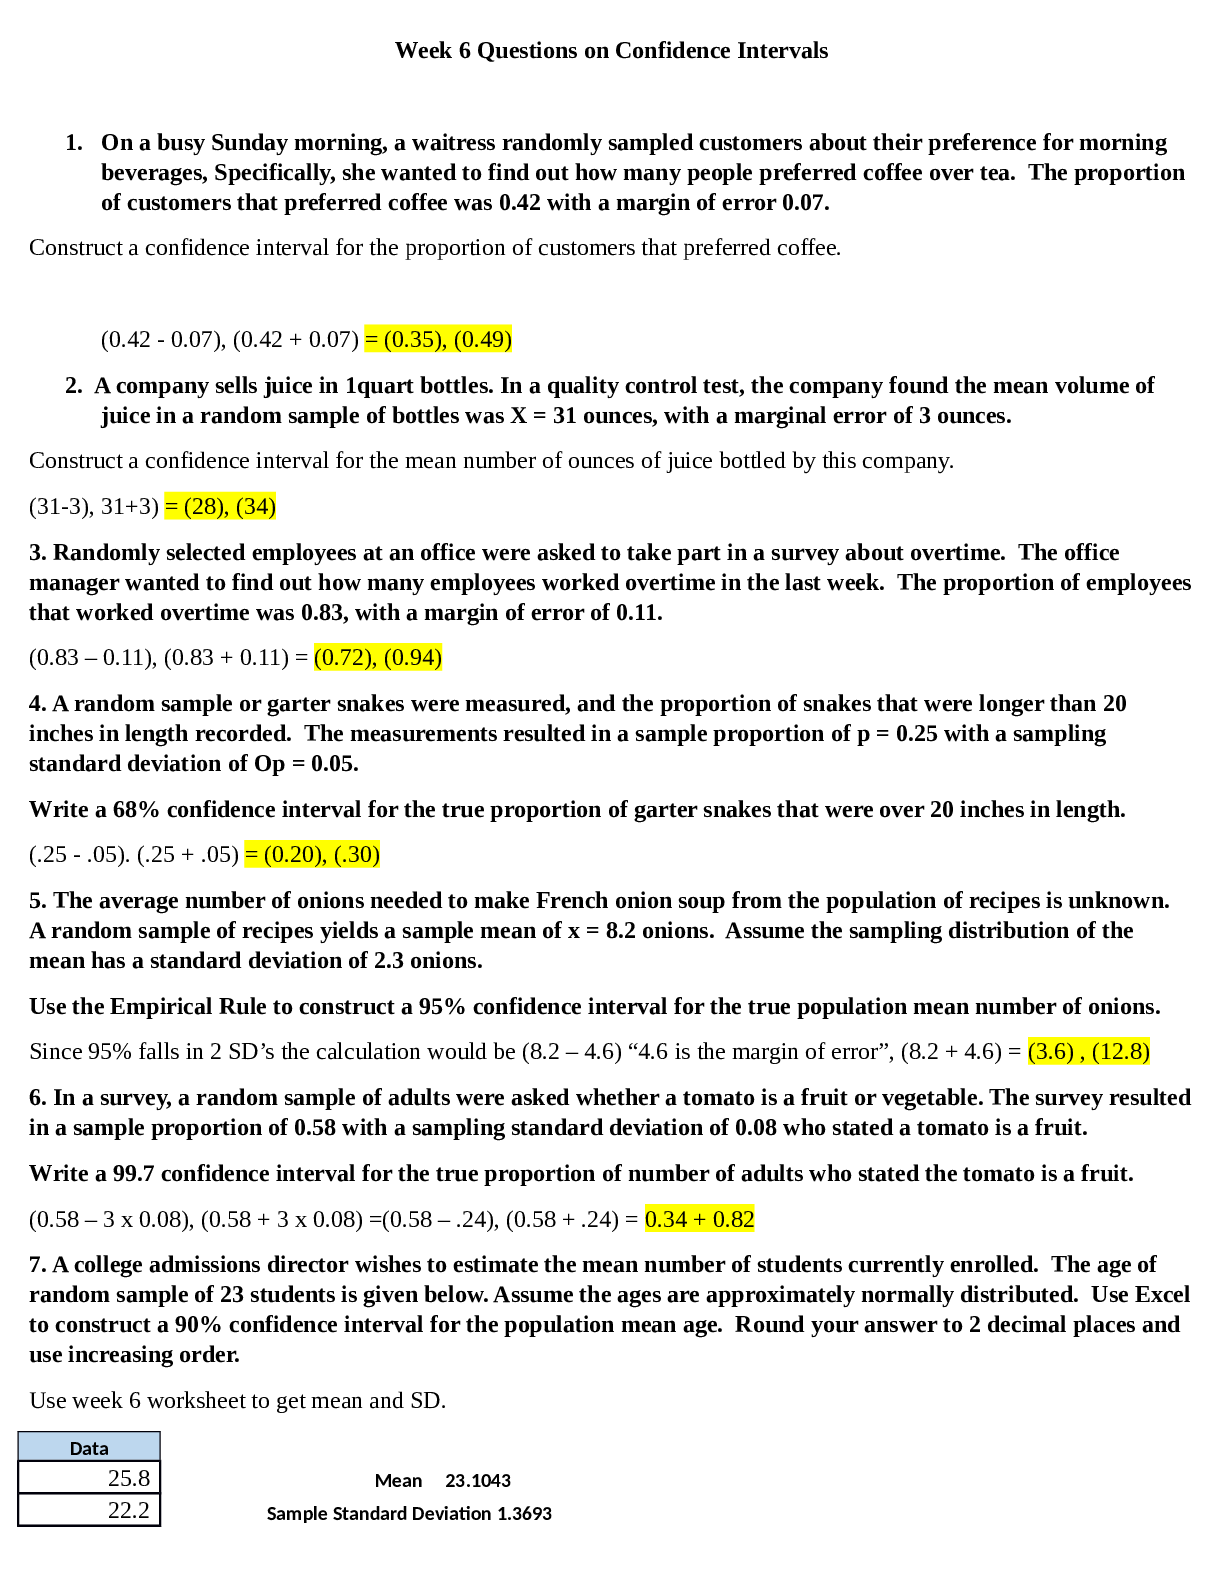
1. On a busy Sunday morning, a waitress randomly sampled customers about their preference for morning beverages, Specifically, she wanted to find out how many people preferred coffee over tea. The pr ... oportion of customers that preferred coffee was 0.42 with a margin of error 0.07. Construct a confidence interval for the proportion of customers that preferred coffee. (0.42 - 0.07), (0.42 + 0.07) = (0.35), (0.49) 2. A company sells juice in 1quart bottles. In a quality control test, the company found the mean volume of juice in a random sample of bottles was X = 31 ounces, with a marginal error of 3 ounces. Construct a confidence interval for the mean number of ounces of juice bottled by this company. (31-3), 31+3) = (28), (34) 3. Randomly selected employees at an office were asked to take part in a survey about overtime. The office manager wanted to find out how many employees worked overtime in the last week. The proportion of employees that worked overtime was 0.83, with a margin of error of 0.11. (0.83 – 0.11), (0.83 + 0.11) = (0.72), (0.94) 4. A random sample or garter snakes were measured, and the proportion of snakes that were longer than 20 inches in length recorded. The measurements resulted in a sample proportion of p = 0.25 with a sampling standard deviation of Op = 0.05. Write a 68% confidence interval for the true proportion of garter snakes that were over 20 inches in length. (.25 - .05). (.25 + .05) = (0.20), (.30) 5. The average number of onions needed to make French onion soup from the population of recipes is unknown. A random sample of recipes yields a sample mean of x = 8.2 onions. Assume the sampling distribution of the mean has a standard deviation of 2.3 onions. Use the Empirical Rule to construct a 95% confidence interval for the true population mean number of onions. Since 95% falls in 2 SD’s the calculation would be (8.2 – 4.6) “4.6 is the margin of error”, (8.2 + 4.6) = (3.6) , (12.8) 6. In a survey, a random sample of adults were asked whether a tomato is a fruit or vegetable. The survey resulted in a sample proportion of 0.58 with a sampling standard deviation of 0.08 who stated a tomato is a fruit. Write a 99.7 confidence interval for the true proportion of number of adults who stated the tomato is a fruit. (0.58 – 3 x 0.08), (0.58 + 3 x 0.08) =(0.58 – .24), (0.58 + .24) = 0.34 + 0.82 7. A college admissions director wishes to estimate the mean number of students currently enrolled. The age of random sample of 23 students is given below. Assume the ages are approximately normally distributed. Use Excel to construct a 90% confidence interval for the population mean age. Round your answer to 2 decimal places and use increasing order. Use week 6 worksheet to get mean and SD. Data 25.8 Mean 23.1043 22.2 Sample Standard Deviation 1.369322.5 22.8 24.6 24 22.6 23.6 22.8 23.1 21.5 21.4 22.5 24.5 21.5 22.5 20.5 23 25.1 25.2 23.8 21.8 24.1 Confidence Level 0.900 n 32 Mean 23.1043 StDev 1.3693 pop stdev no SE 0.242060 t 1.696 Margin of Error 0.410534 Lower Limit 22.693766 Upper Limit 23.514834 Lower margin of error = 22.69 and upper limit is 23.51 8. Suppose that the scores of bowlers in a particular league follow a normal distribution such that a standard deviation of the population is 12. Find the 95% confidence interval of the mean score for all bowlers in this league using the accompanying data set of 40 random scores. Round your answers to 2 decimal places using ascending order. Lower Limit = 90.78 Upper Limit = 98.22 Confidence Level 0.950 n 40 Mean 94.5000 StDev 12.0000 pop stdev yes SE 1.897367z 1.960 Margin of Error 3.718839 Lower Limit 90.781161 Upper Limit 98.218839 9. In the survey of 603 adults, 98 said that they regularly lie to people conducting surveys. Create a 99% confidence interval for the proportion of adults who regularly lie to people conducting surveys. Use excel to create the confidence interval rounding to 4 decimal places. Lower Limit = 0.1238 Upper Limit = 0.2012 Confidence Level 0.990 n 603 Number of Successes 98 Sample Proportion 0.162521 SE 0.015024 z 2.576 Margin of Error 0.038702 Lower Limit 0.123819 Upper Limit 0.201222 10. In a random sampling of 350 attendees at a minor league baseball game, 184 said that they bought food from the concession stand. Create a 95%confidence interval for the proportion of fans who bought food from the concession stand. Use excel to create the confidence interval rounding to 4 decimal places. Lower limit = 0.4734 Upper Limit = 0.5780 Confidence Level 0.950 n 350 Number of Successes 184 Sample Proportion 0.525714 SE 0.026691 z 1.960 Margin of Error 0.052314 Lower Limit 0.473400 Upper Limit 0.578028 11. Suppose that the weight of tight ends in a football league are normally distributed such that sigma squared = 1,369. A sample of 49 tight ends was randomly selected and the weights are given in the table below. Use Excel to create a 95% confidence interval for the mean weight of the tight ends in this league. Rounding your answers to 2 decimal places and using ascending order. (Have to get square root of 1369 which is 37). Population sample is yes . Lower limit = 241.42 Upper Limit = 262.14 Confidence 0.950Level n 49 Mean 251.7755 StDev 37.0000 pop stdev yes SE 5.285714 z 1.960 Margin of Error 10.360000 Lower Limit 241.415500 Upper Limit 262.135500 12. Suppose heights, in inches of orangutans are normally distributed and have a known population standard deviation of 4 inches. A random sample of 16 orangutans is taken and gives a sample mean of 56 inches. Find the confidence interval of the population mean with a 95% confidence level. Lower limit = 54.04 and Upper Limit = 57.96 13. The population standard deviation for the total snowfalls per year in a city is 13 inches. If we want to be 95% confident that the sample mean is within 3 inches of the true population mean, what is the minimum sample size that should be taken? Answer: 73 snowfalls Minimum Sample Size μ for popu [Show More]
Last updated: 1 year ago
Preview 1 out of 20 pages
Instant download
Buy this document to get the full access instantly
Instant Download Access after purchase
Add to cartInstant download
Reviews( 0 )
Document information
Connected school, study & course
About the document
Uploaded On
Jul 29, 2021
Number of pages
20
Written in

Additional information
This document has been written for:
Uploaded
Jul 29, 2021
Downloads
0
Views
48