Computer Science > Solutions Guide > Georgia Institute Of TechnologyISYE 650113-week_2_hw_solutions.VERIFIED CORRECT SOLUTIONS (All)
Georgia Institute Of TechnologyISYE 650113-week_2_hw_solutions.VERIFIED CORRECT SOLUTIONS
Document Content and Description Below
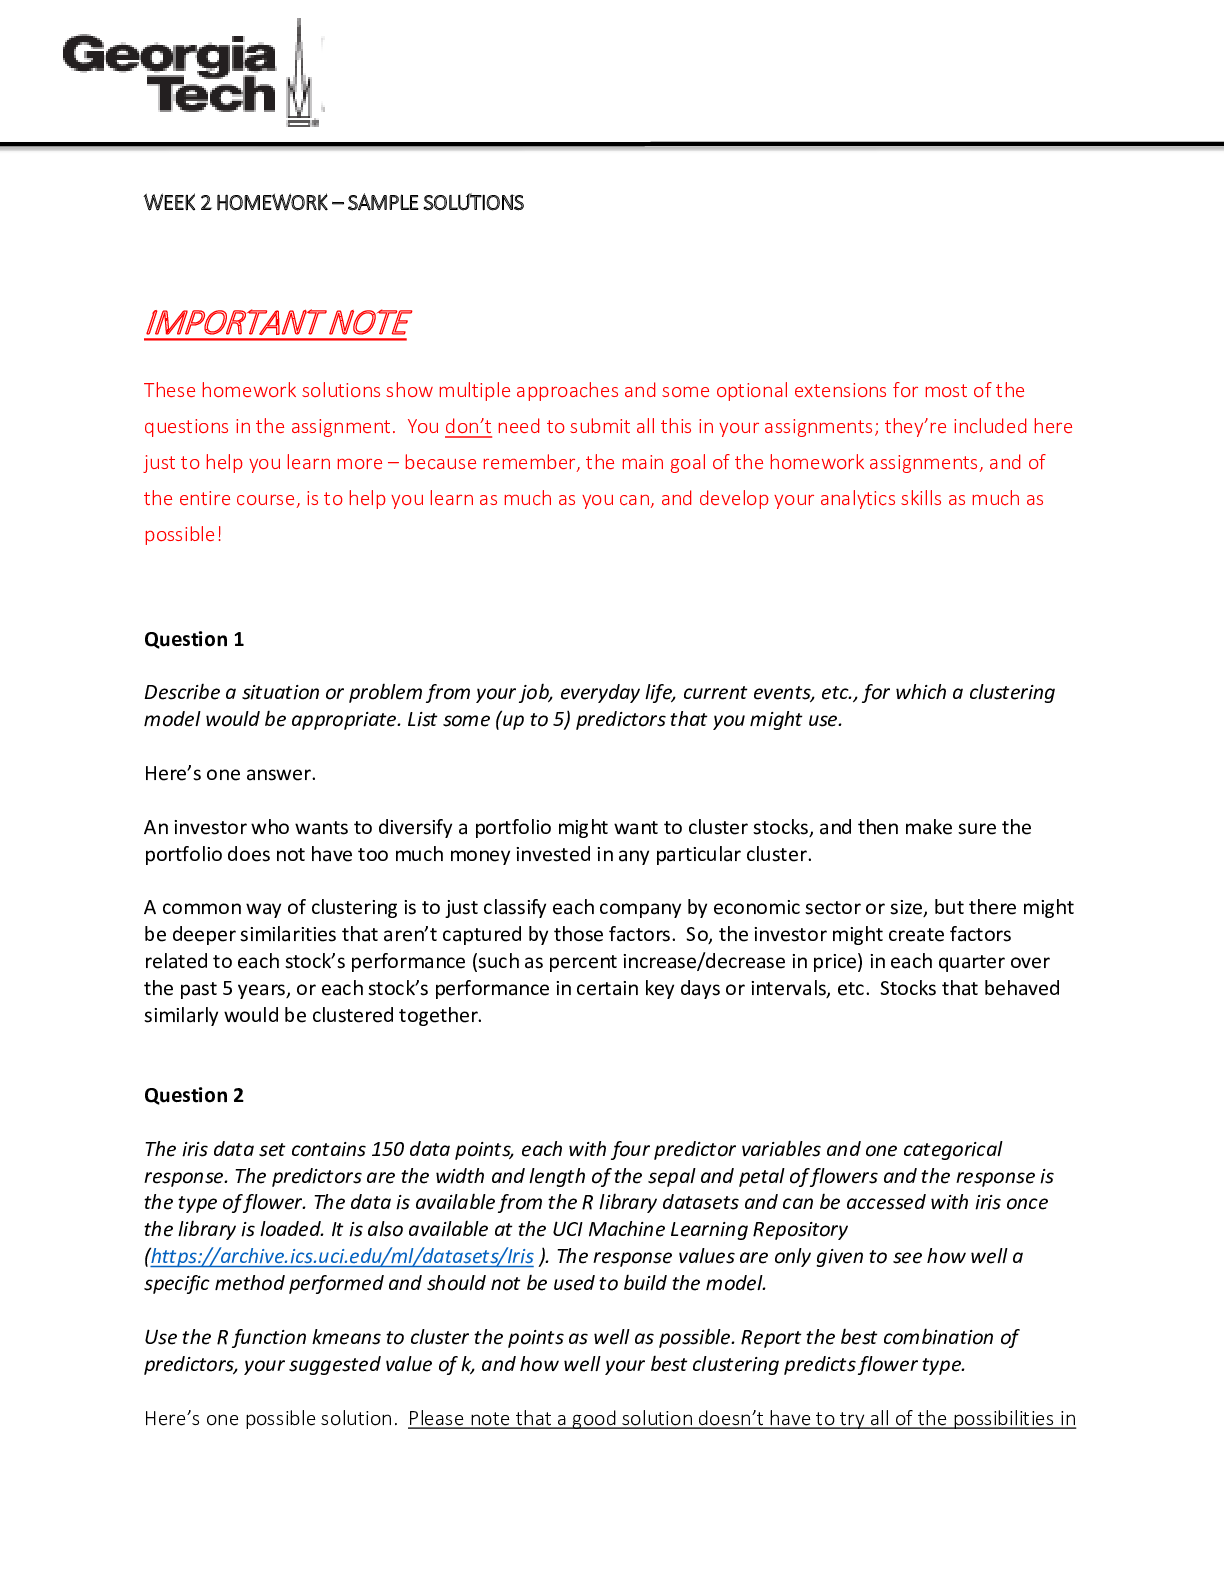
WEEK 2 HOMEWORK – SAMPLE SOLUTIONS IMPORTANT NOTE These homework solutions show multiple approaches and some optional extensions for most of the questions in the assignment. You don’t need to... submit all this in your assignments; they’re included here just to help you learn more – because remember, the main goal of the homework assignments, and of the entire course, is to help you learn as much as you can, and develop your analytics skills as much as possible! Question 1 Describe a situation or problem from your job, everyday life, current events, etc., for which a clustering model would be appropriate. List some (up to 5) predictors that you might use. Here’s one answer. An investor who wants to diversify a portfolio might want to cluster stocks, and then make sure the portfolio does not have too much money invested in any particular cluster. A common way of clustering is to just classify each company by economic sector or size, but there might be deeper similarities that aren’t captured by those factors. So, the investor might create factors related to each stock’s performance (such as percent increase/decrease in price) in each quarter over the past 5 years, or each stock’s performance in certain key days or intervals, etc. Stocks that behaved similarly would be clustered together. Question 2 The iris data set contains 150 data points, each with four predictor variables and one categorical response. The predictors are the width and length of the sepal and petal of flowers and the response is the type of flower. The data is available from the R library datasets and can be accessed with iris once the library is loaded. It is also available at the UCI Machine Learning Repository (https://archive.ics.uci.edu/ml/datasets/Iris ). The response values are only given to see how well a specific method performed and should not be used to build the model. Use the R function kmeans to cluster the points as well as possible. Report the best combination of predictors, your suggested value of k, and how well your best clustering predicts flower type. Here’s one possible solution. Please note that a good solution doesn’t have to try all of the possibilities in the code; they’re shown to help you learn, but they’re not necessary. The R code in file HW2-Q2.R shows clustering solutions for k=2,3,4,5 using all factors, for both unscaled and scaled data. [Show More]
Last updated: 1 year ago
Preview 1 out of 10 pages
Reviews( 0 )
Document information
Connected school, study & course
About the document
Uploaded On
Sep 28, 2021
Number of pages
10
Written in
Additional information
This document has been written for:
Uploaded
Sep 28, 2021
Downloads
0
Views
156






.png)
