Statistics > Solutions Guide > University of Maryland, University College STAT 200Homework Week 7. (All)
University of Maryland, University College STAT 200Homework Week 7.
Document Content and Description Below
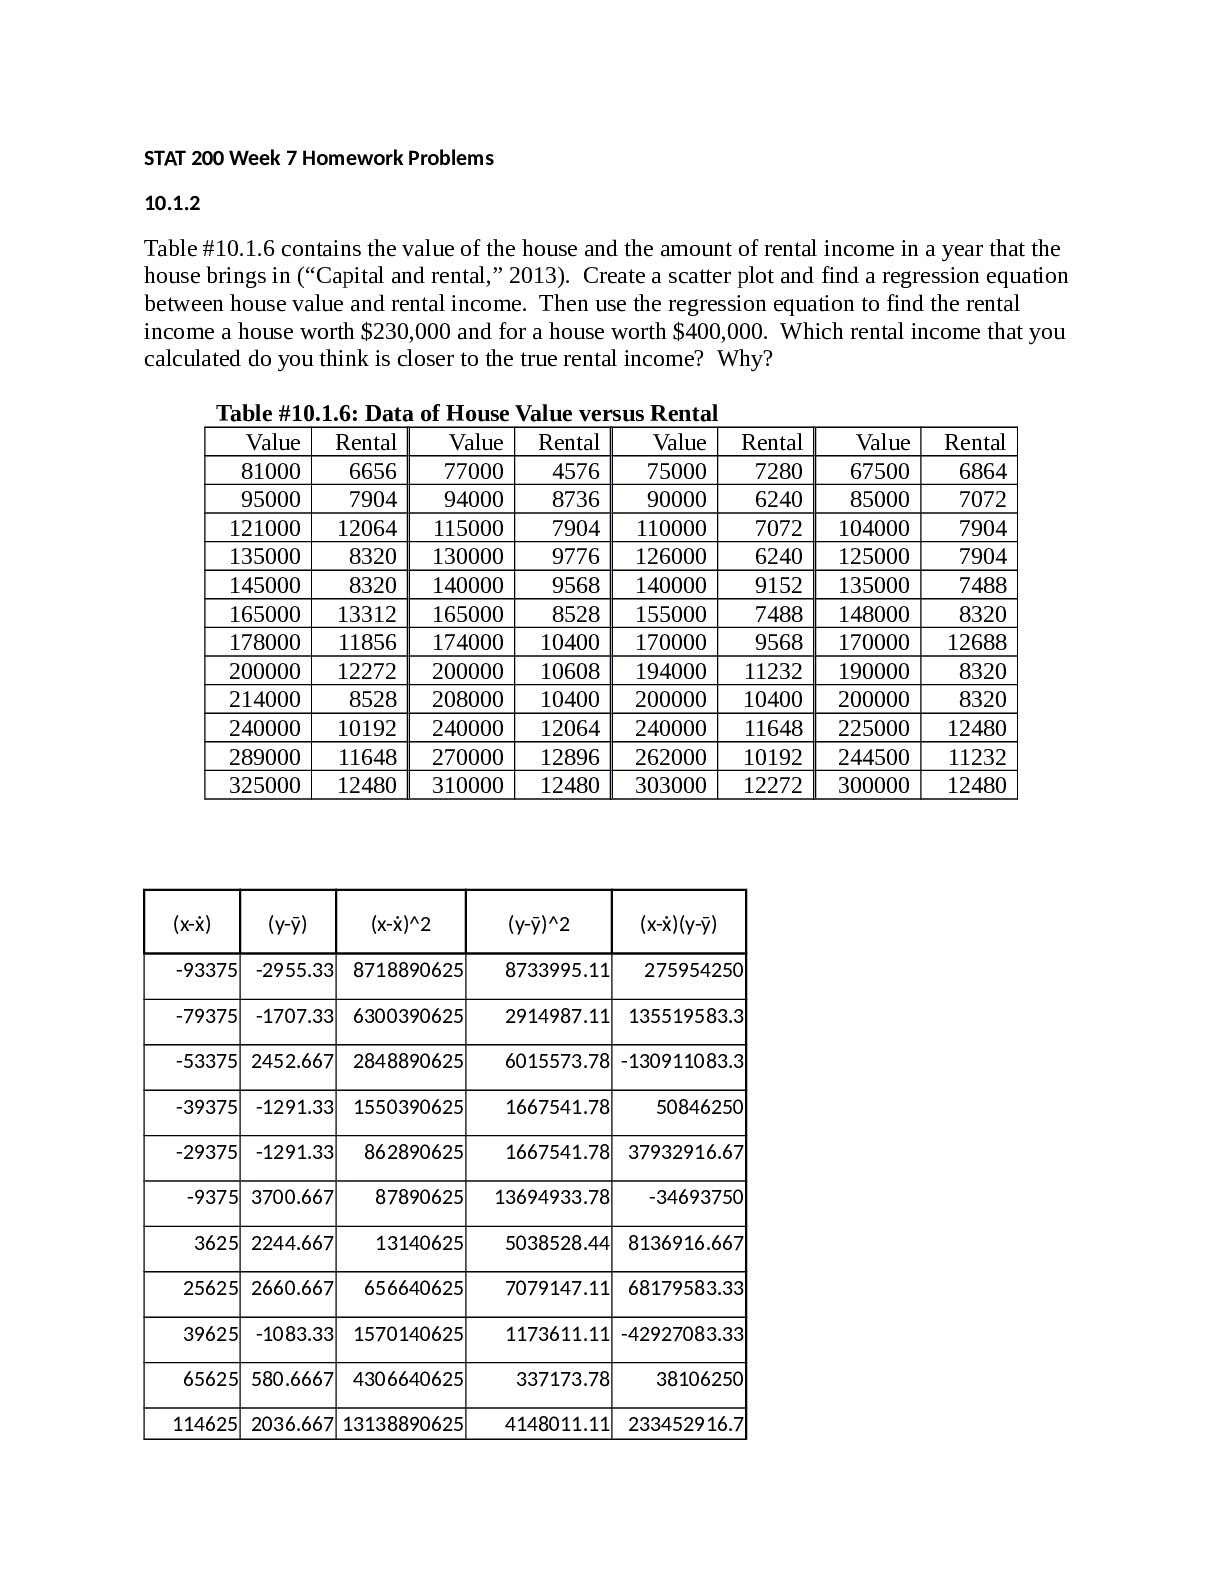
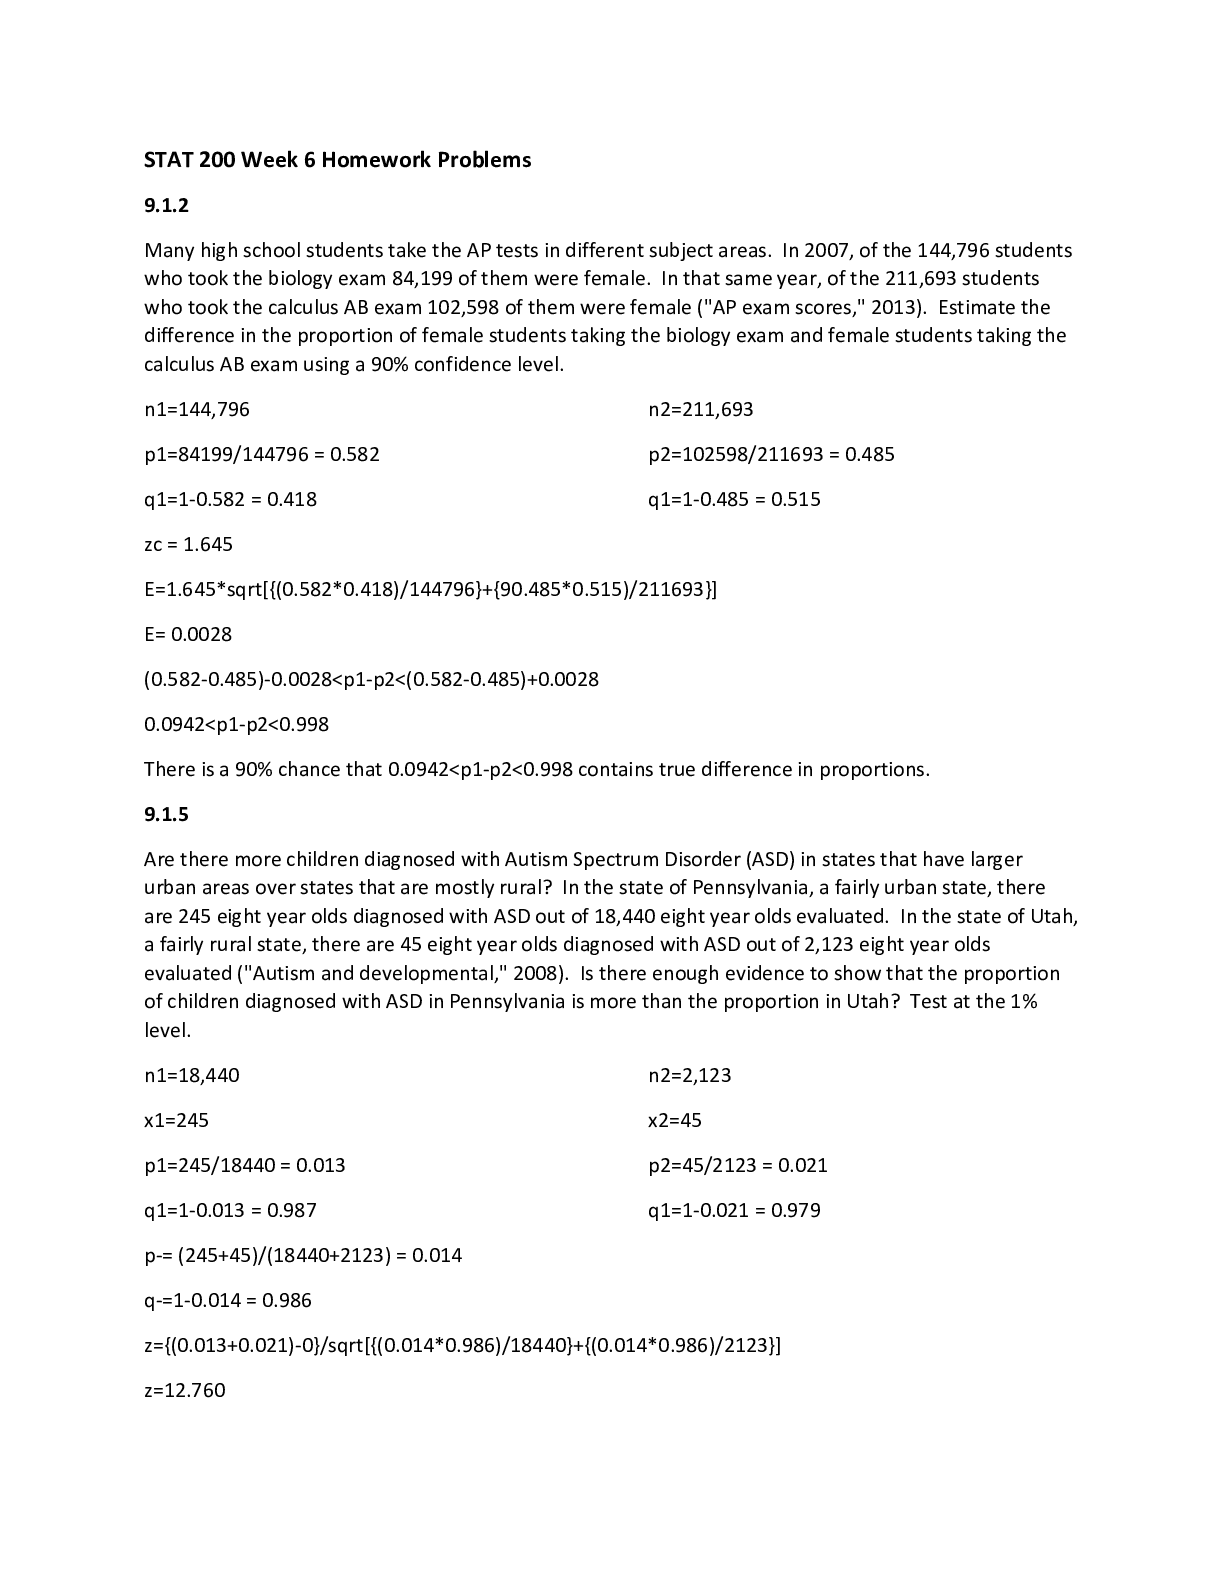
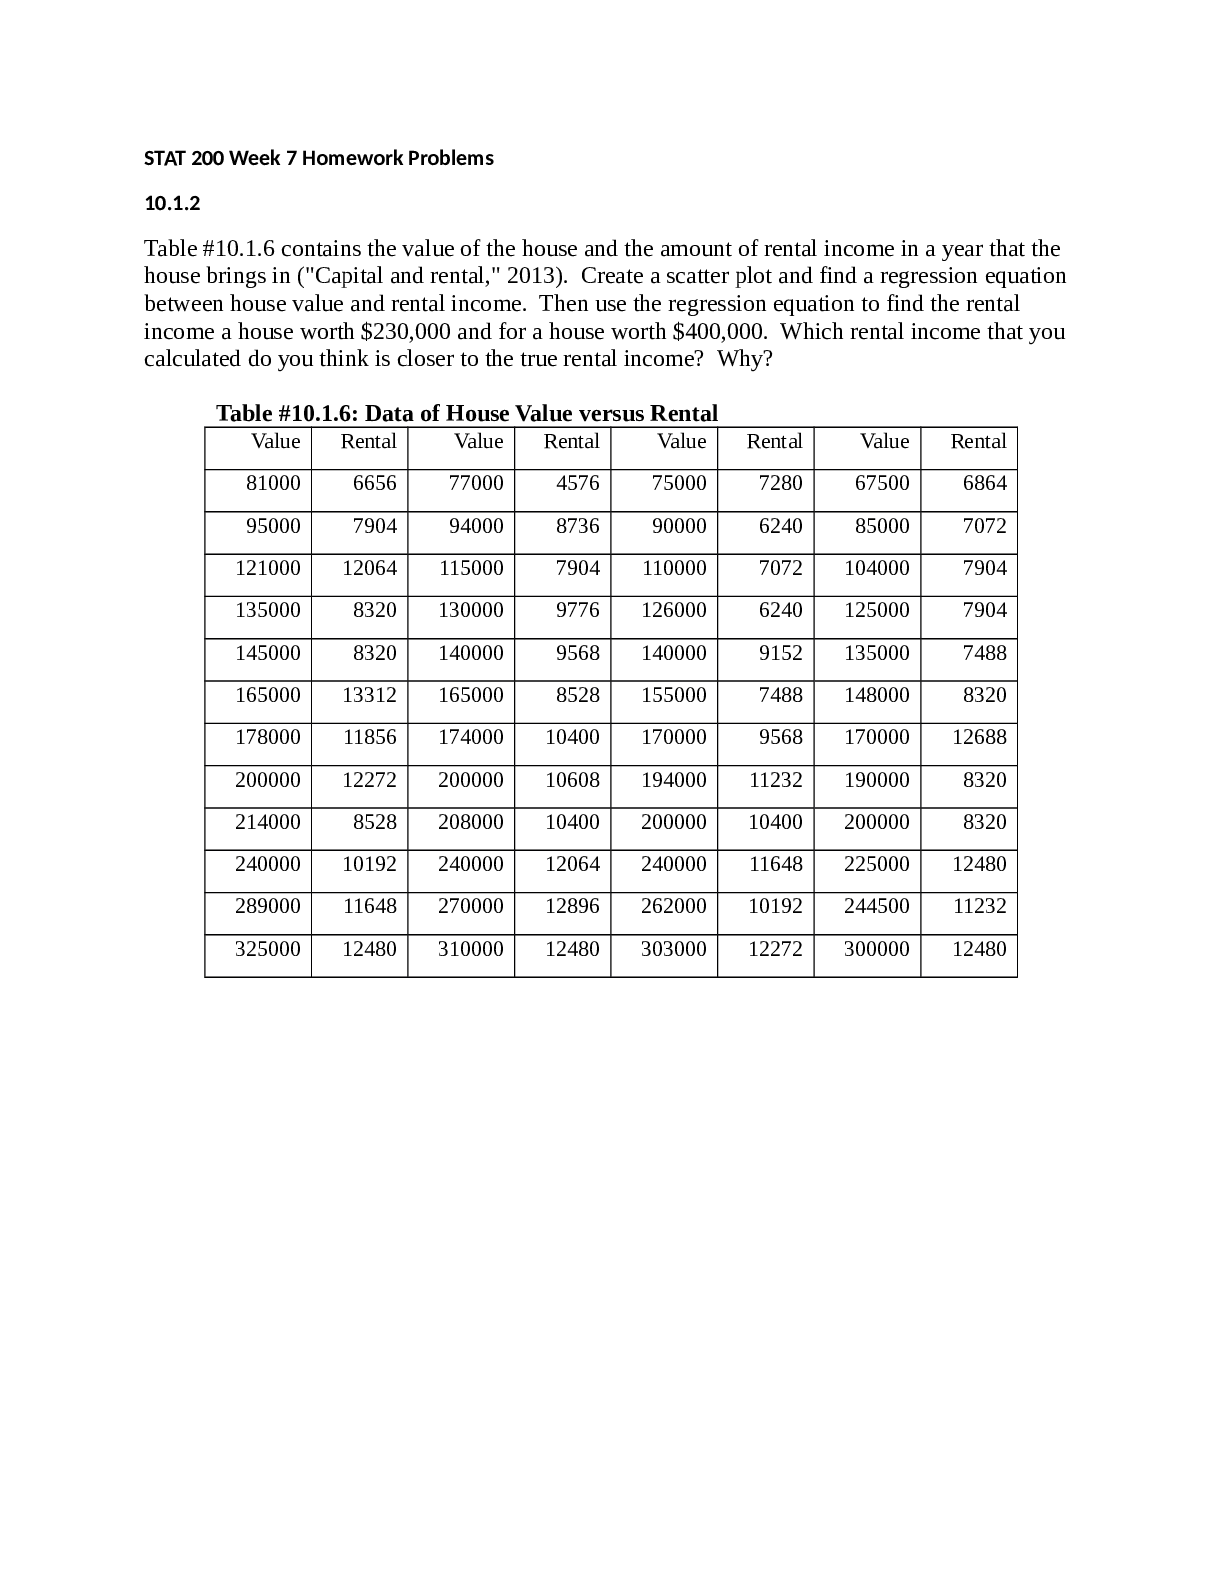
STAT 200 Week 7 Homework Problems 10.1.2 Table #10.1.6 contains the value of the house and the amount of rental income in a year that the house brings in (“Capital and rental,” 2013). Create a ... scatter plot and find a regression equation between house value and rental income. Then use the regression equation to find the rental income a house worth $230,000 and for a house worth $400,000. Which rental income that you calculated do you think is closer to the true rental income? [Show More]
Last updated: 1 year ago
Preview 1 out of 13 pages
Reviews( 0 )
Document information
Connected school, study & course
About the document
Uploaded On
Oct 08, 2021
Number of pages
13
Written in

Additional information
This document has been written for:
Uploaded
Oct 08, 2021
Downloads
0
Views
102


.png)