Mathematics > LAB QUIZ > MATH 221 Week 6 Lab Assignment (iLAB 6) | RATED A+ | DeVry University (All)
MATH 221 Week 6 Lab Assignment (iLAB 6) | RATED A+ | DeVry University
Document Content and Description Below
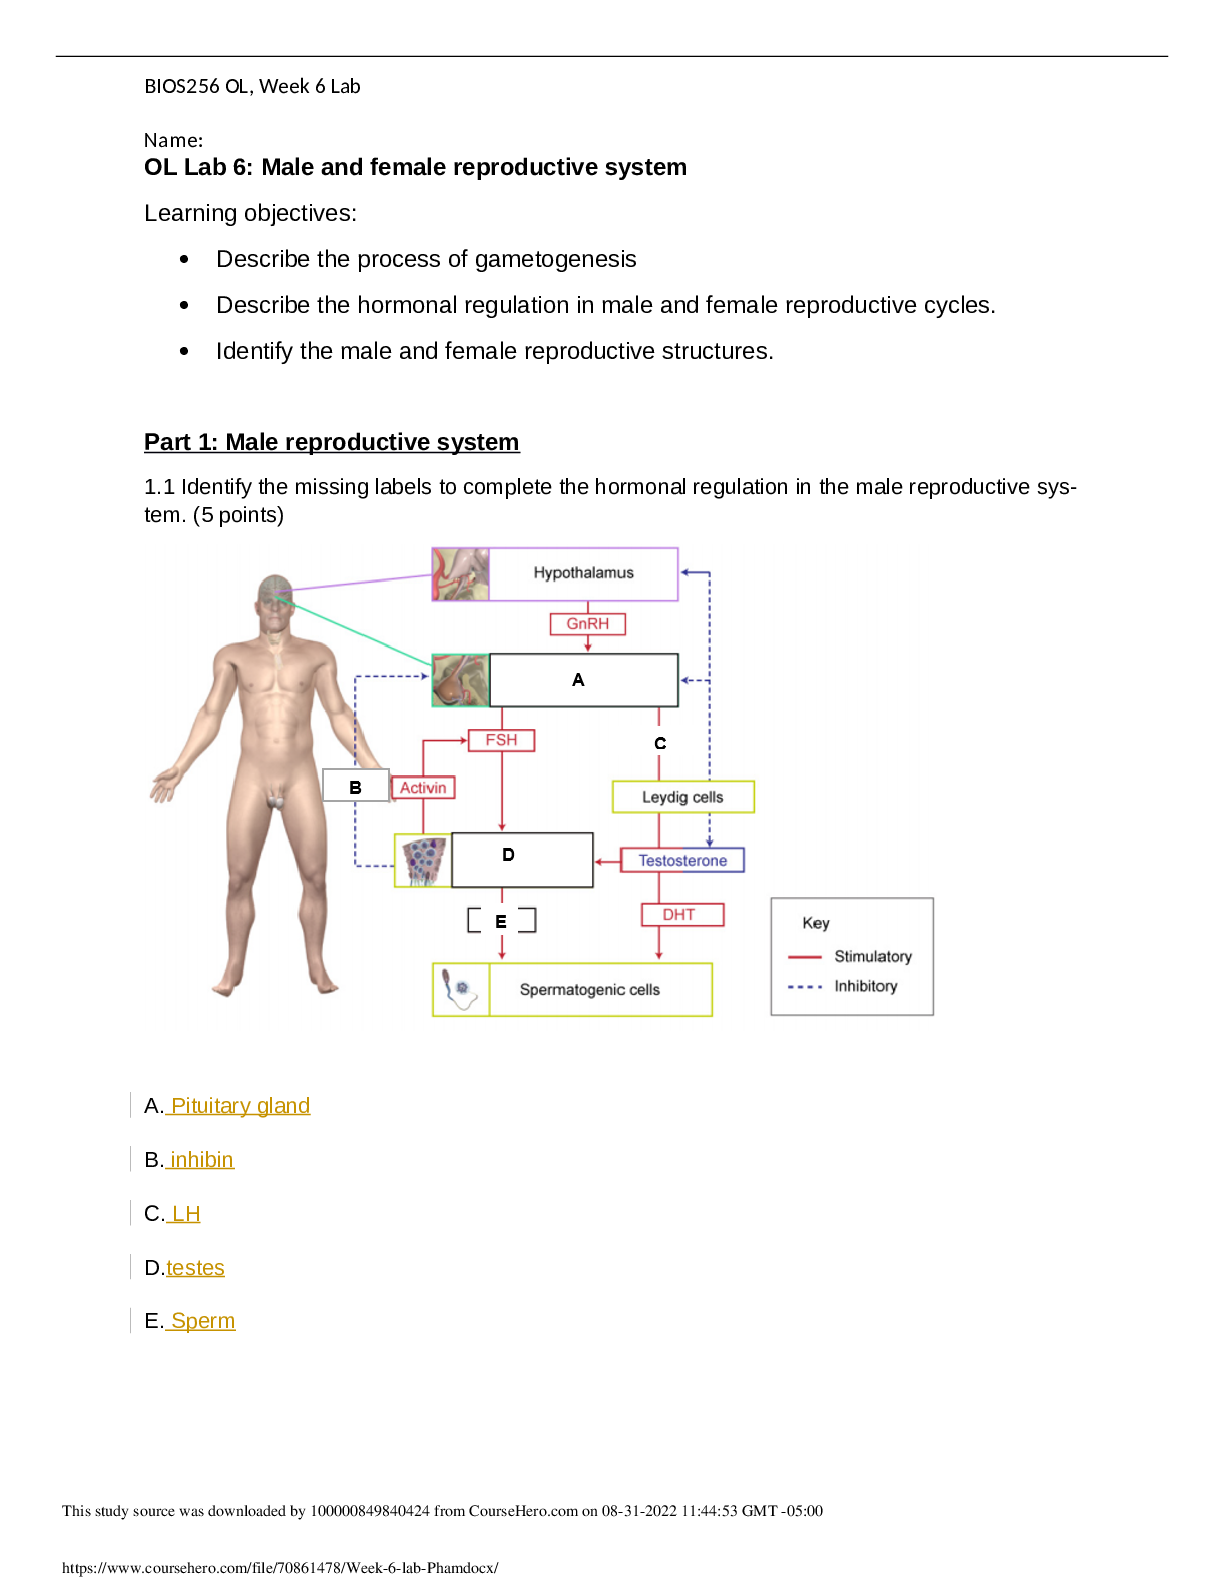
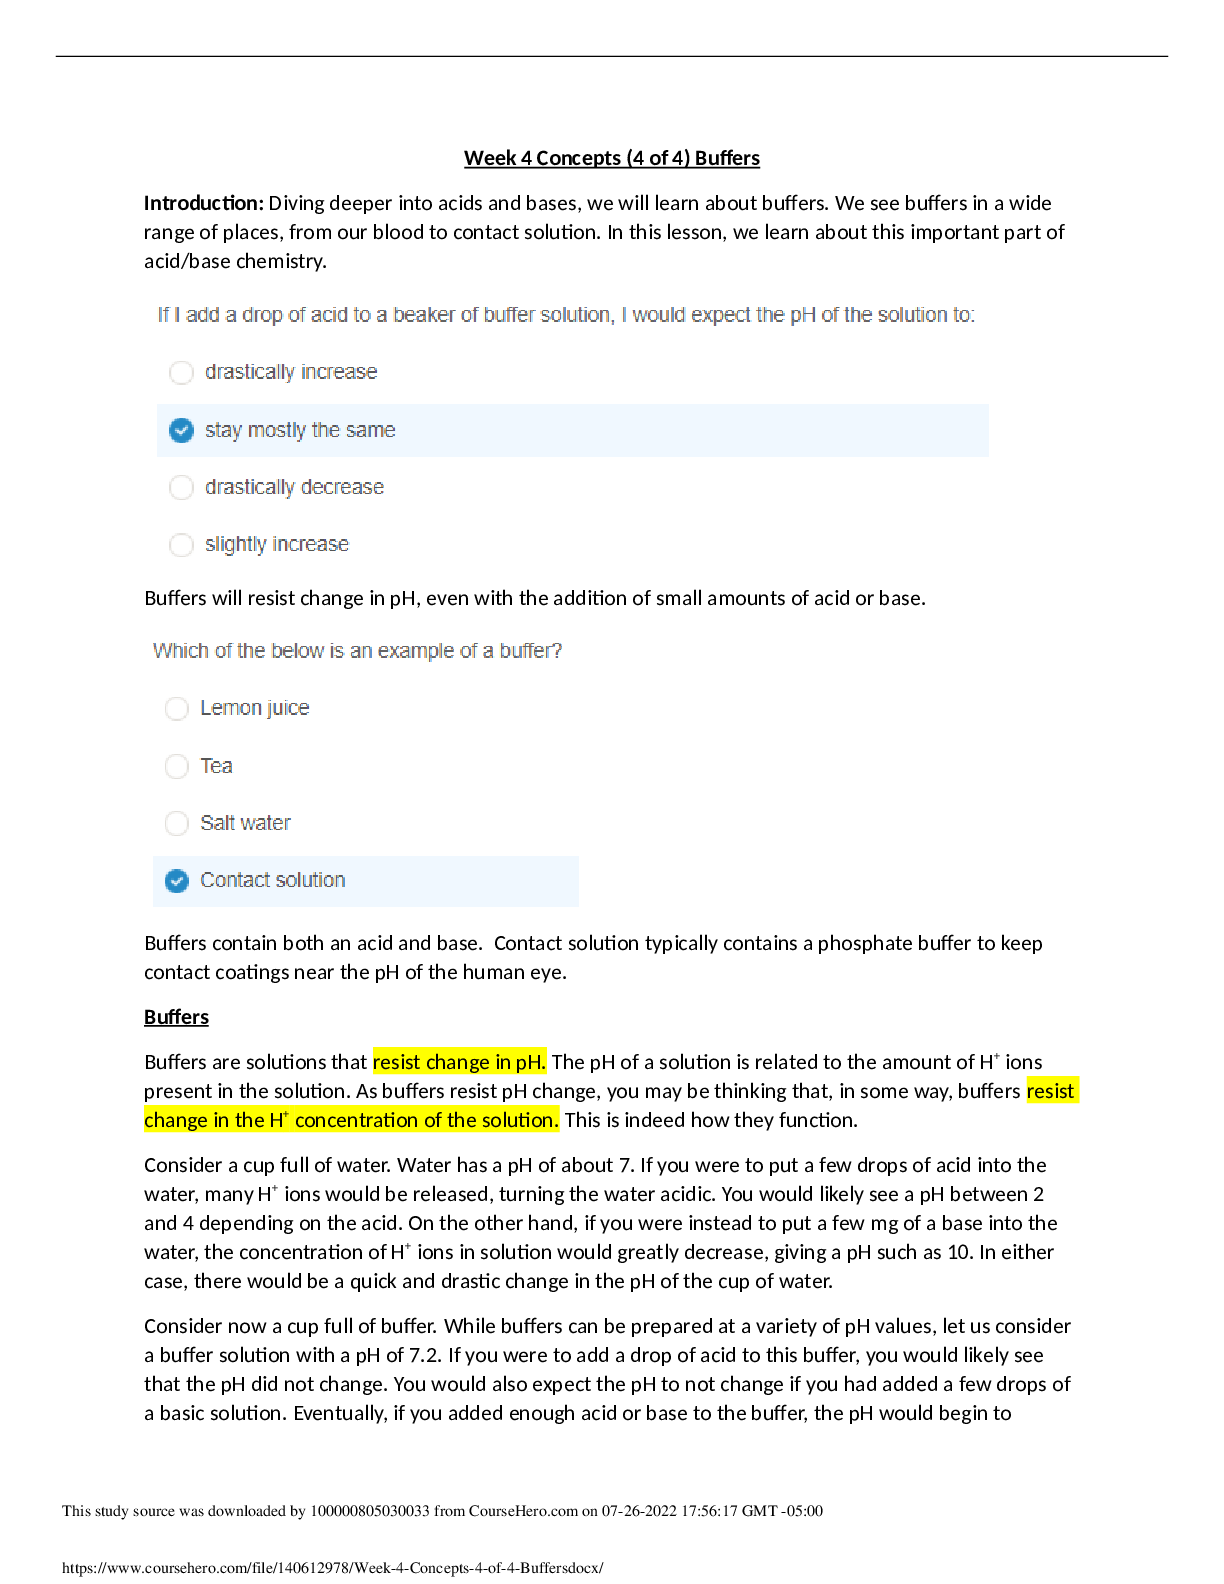
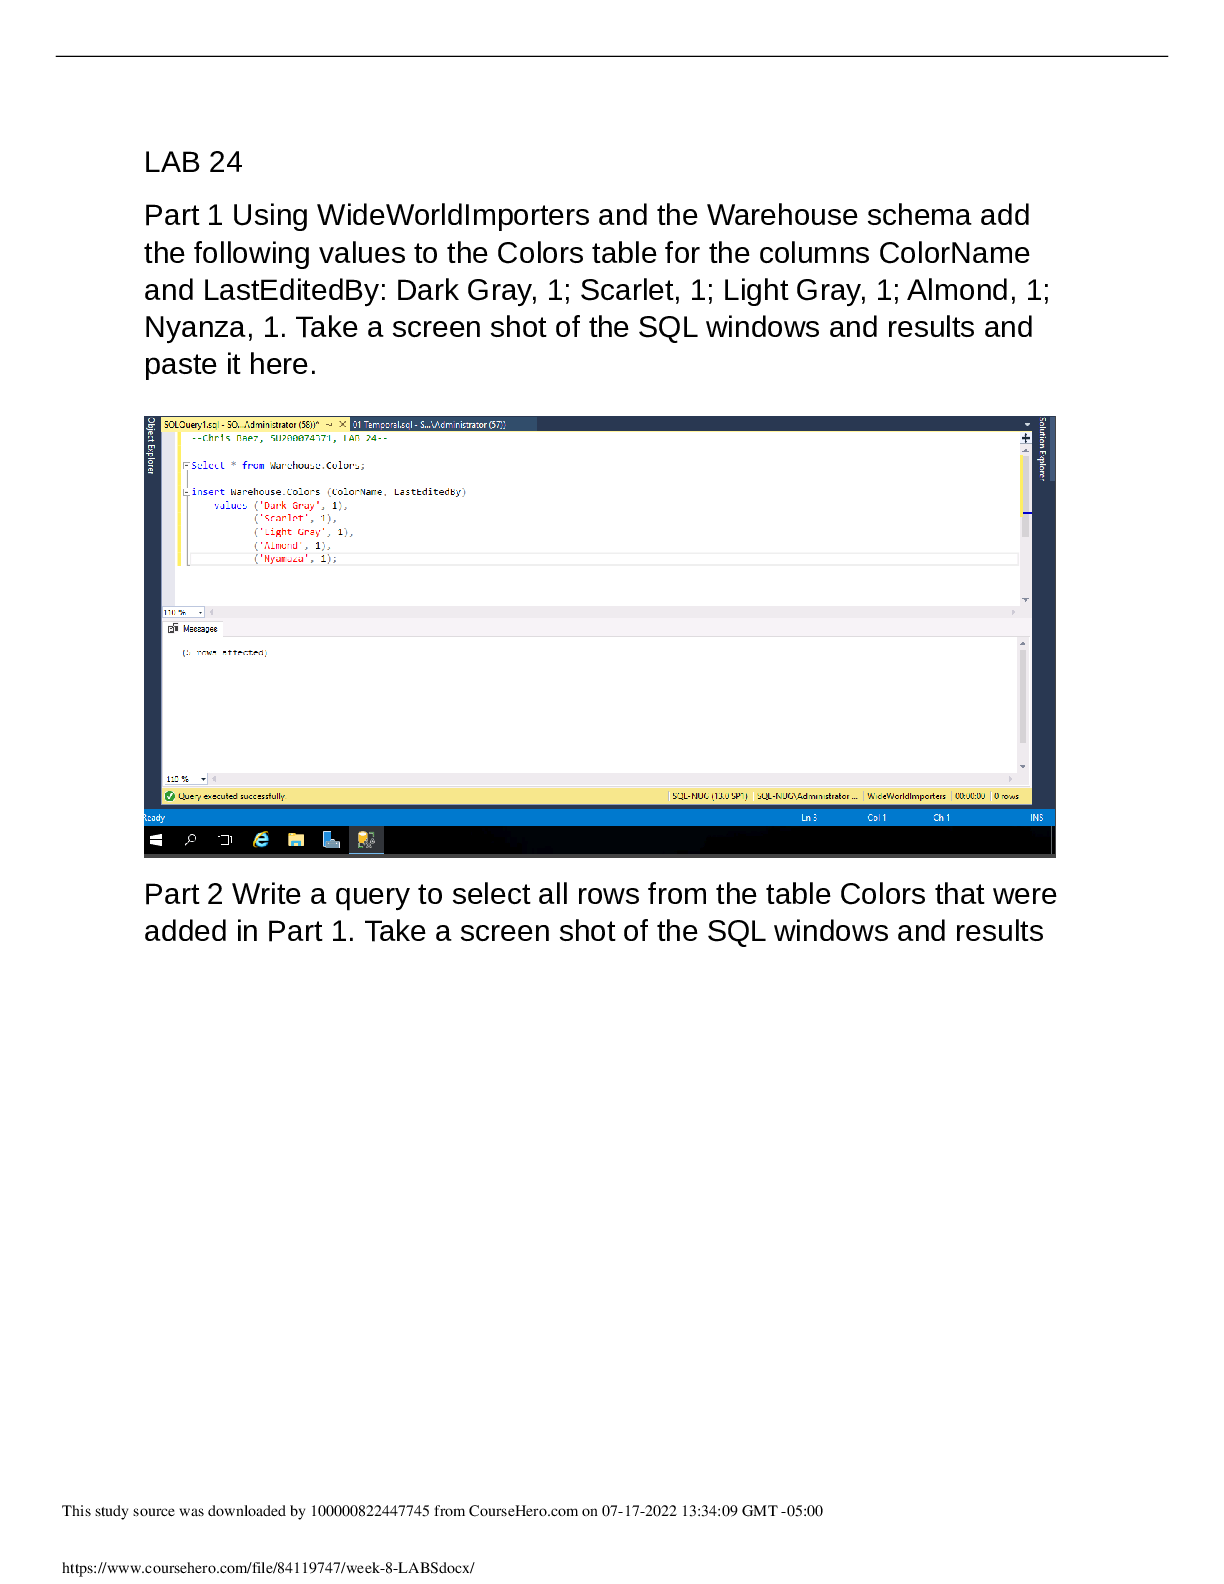
Statistical Concepts: Confidence Intervals Data Simulation Normal Probabilities Short Answer Writing Assignment All answers should be complete sentences. We need to find the confidence int... erval for the SLEEP variable. To do this, we need to find the mean and standard deviation with the Week 1 spreadsheet. Then we can the Week 5 spreadsheet to find the confidence interval. First, find the mean and standard deviation by copying the SLEEP variable and pasting it into the Week 1 spreadsheet. Write down the mean and the sample standard deviation as well as the count. Open the Week 5 spreadsheet and type in the values needed in the green cells at the top. The confidence interval is shown in the yellow cells as the lower limit and the upper limit. Give and interpret the 95% confidence interval for the hours of sleep a student Give and interpret the 99% confidence interval for the hours of sleep a student Compare the 95% and 99% confidence intervals for the hours of sleep a student gets. Explain the difference between these intervals and why this difference Give and interpret the 95% confidence intervals for males and females on the HEIGHT variable. Which is wider and why? Give and interpret the 99% confidence intervals for males and females on the HEIGHT variable. Which is wider and why? Find the mean and standard deviation of the DRIVE variable by copying that variable into the Week 1 spreadsheet. Use the Week 4 spreadsheet to determine the percentage of data points from that data set that we would expect to be less than 40. To find the actual percentage in the dataset, sort the DRIVE variable and count how many of the data points are less than 40 out of the total 35 data points. That is the actual percentage. How does this compare with your prediction? What percentage of data would you predict would be between 40 and 70 and what percentage would you predict would be more than 70 miles? Use the Week 4 spreadsheet again to find the percentage of the data set we expect to have values between 40 and 70 as well as for more than 70. Now determine the percentage of data points in the dataset that fall within this range, using same strategy as above for counting data points in the data set. How do each of these compare with your prediction and why is [Show More]
Last updated: 1 year ago
Preview 1 out of 4 pages
.png)

Reviews( 0 )
Document information
Connected school, study & course
About the document
Uploaded On
Jul 20, 2022
Number of pages
4
Written in

Additional information
This document has been written for:
Uploaded
Jul 20, 2022
Downloads
0
Views
77


.png)
.png)
.png)
 (1).png)

.png)