Financial Accounting > EXAM REVIEW > QMB 3200 QUIZ 1 - Review Questions with Answer Key (All)
QMB 3200 QUIZ 1 - Review Questions with Answer Key
Document Content and Description Below
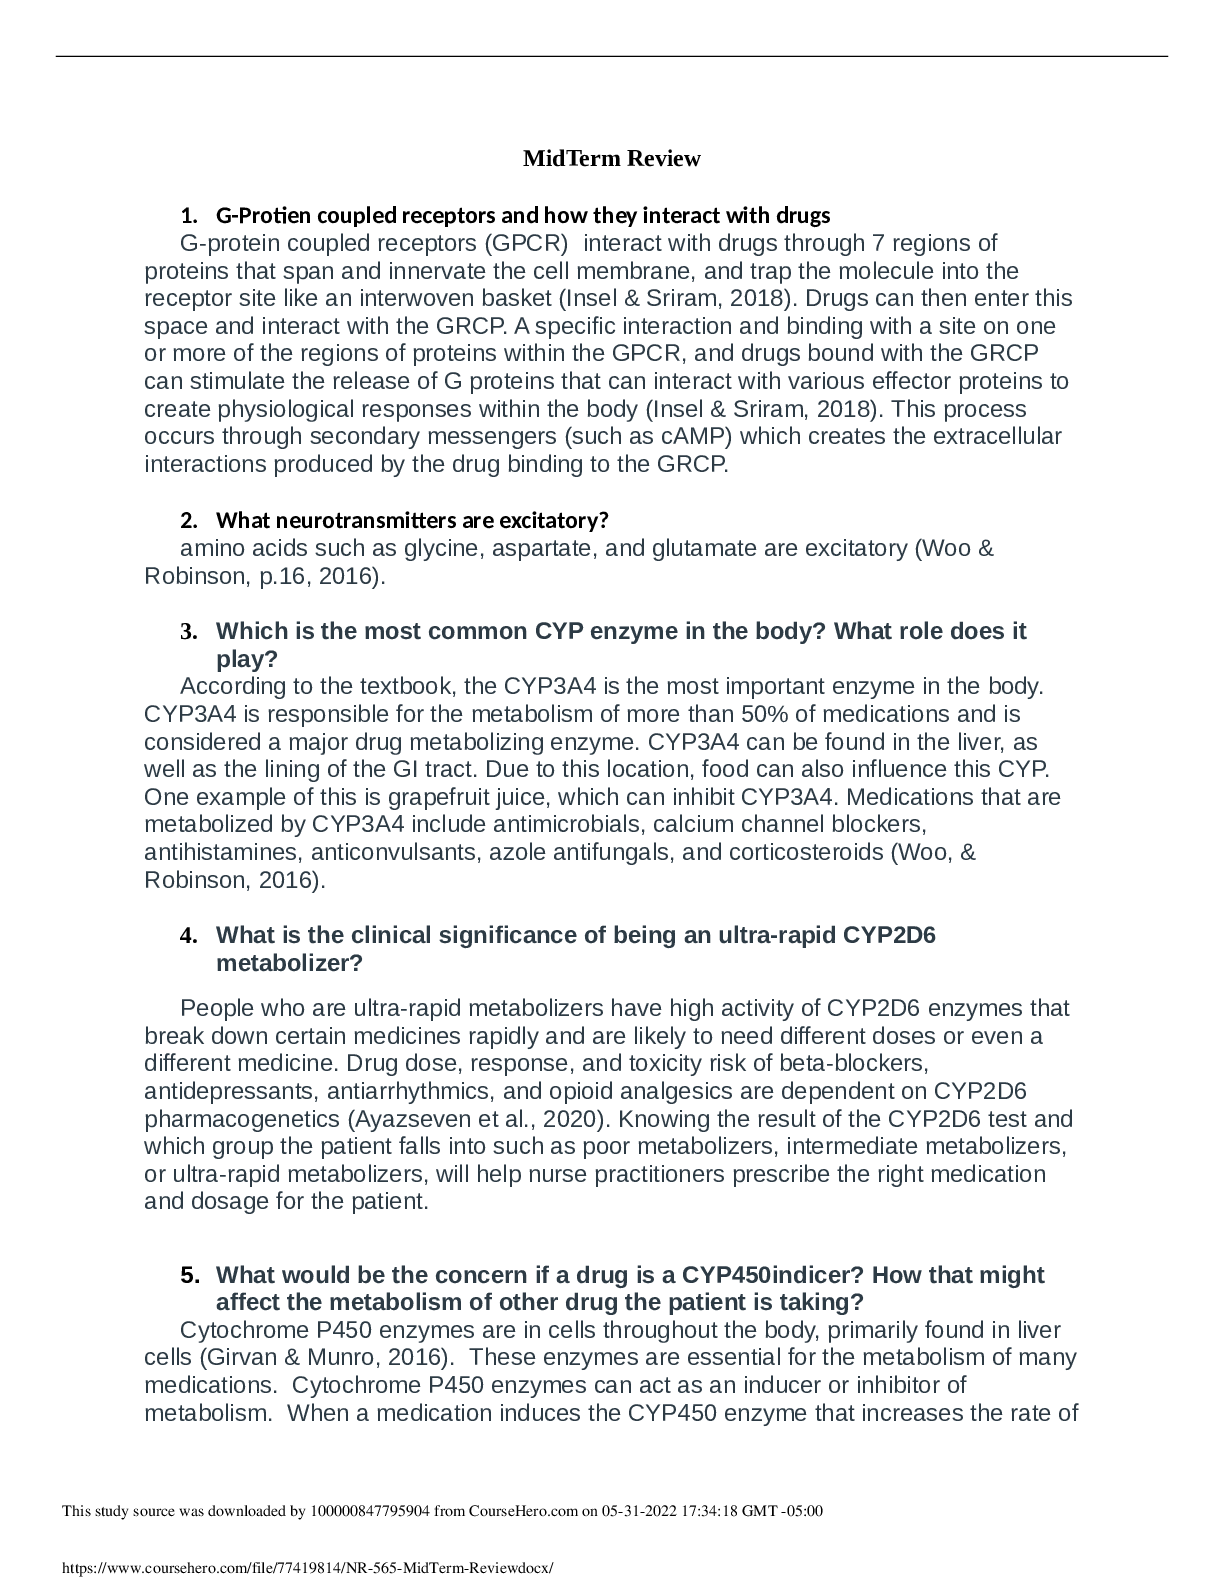
QMB 3200 QUIZ 1 - Review Questions with Answer Key QUIZ 1 – Review Questions The file available online on Module 1 : Quiz1Data.xls contains students’ scores for quiz 1 attempt 1. We have used ... that data to prepare the following questions on quiz 1 topics. QUESTION 1-4: There are 200 students enrolled in QMB3200 Online. The worksheet “Dataset01” of the file Quiz1Data.xls contains quiz 1 scores for a subgroup of 30 randomly selected students. Q1: The set of 200 students contained on worksheet “Dataset00” is a) a Sample b) the Population c) a Statistic d) a Parameter e) a Census Q2: The set of 30 students contained on worksheet “Dataset01” is a) a Sample b) the Population c) a Statistic d) a Parameter e) a Census Q3: The data for the 200 students contained on worksheet “Dataset00” is a) a Sample b) the Population c) a Statistic d) a Parameter e) a Census Q4: The average quiz 1 score for the 200 students contained on worksheet “Dataset00” is a) a Sample b) the Population c) a Statistic d) a Parameter e) a Census Q5: The average quiz 1 score for the 30 students shown on “DataSet01” worksheet is: a) a Sample b) the Population c) a Statistic d) a Parameter e) a Census QUESTION 6-8: Using the data on worksheet “DataSet01” compute the following statistics: Q6: The standard deviation of Quiz 1 scores is Q7: The median quiz 1 score is Q8: The mean quiz 1 score is QUESTION 9: The pie chart shown here was obtained using the data on worksheet “Dataset00”. According to the graph, the number of female students who took quiz 1 is approximately QUESTION 10: According to the graph on the right, the number of students who got scores between 3-4 is a) exactly 100 b) above 100 c) below 100 d) cannot be determined based on the graph alone QUESTION 11-14: This box plot corresponds to the quiz 1 data on worksheet “DataSet00” for the 200 students who took the 4 point quiz. Q11: How many students scored 70% or higher of the possible quiz points? Q12: According to the graph, 75% of students scored a) 90% or better b) 70% or better c) 50% or better in quiz 1 d) Cannot be determined from the information given. Q13: How many students had grades below 3.2 pts ? Q14: 25% of students had scores lower than pts. QUESTION 15-16: A cumulative frequency graph using the data on worksheet “Dataset00” is shown below. Q15: The number of students who had a score of 3 pts or less is _ a) Above 100 b) Between 60 and 80 c) Less than 20 d) Cannot be determined Q16: The number of students who had a score of 2 pts or less is a) Above 100 b) Between 60 and 80 c) Less than 20 d) Cannot be determined [Show More]
Last updated: 1 year ago
Preview 1 out of 4 pages
.png)
Reviews( 0 )
Document information
Connected school, study & course
About the document
Uploaded On
Jan 01, 2021
Number of pages
4
Written in

Additional information
This document has been written for:
Uploaded
Jan 01, 2021
Downloads
0
Views
170

.png)


.png)


.png)