Information Technology > EXAM REVIEW > Midterm Quiz 1 - Audit Learners _ Midterm Quiz 1 - Audit Learners _ ISYE6501x Courseware _ edX. (All)
Midterm Quiz 1 - Audit Learners _ Midterm Quiz 1 - Audit Learners _ ISYE6501x Courseware _ edX.
Document Content and Description Below
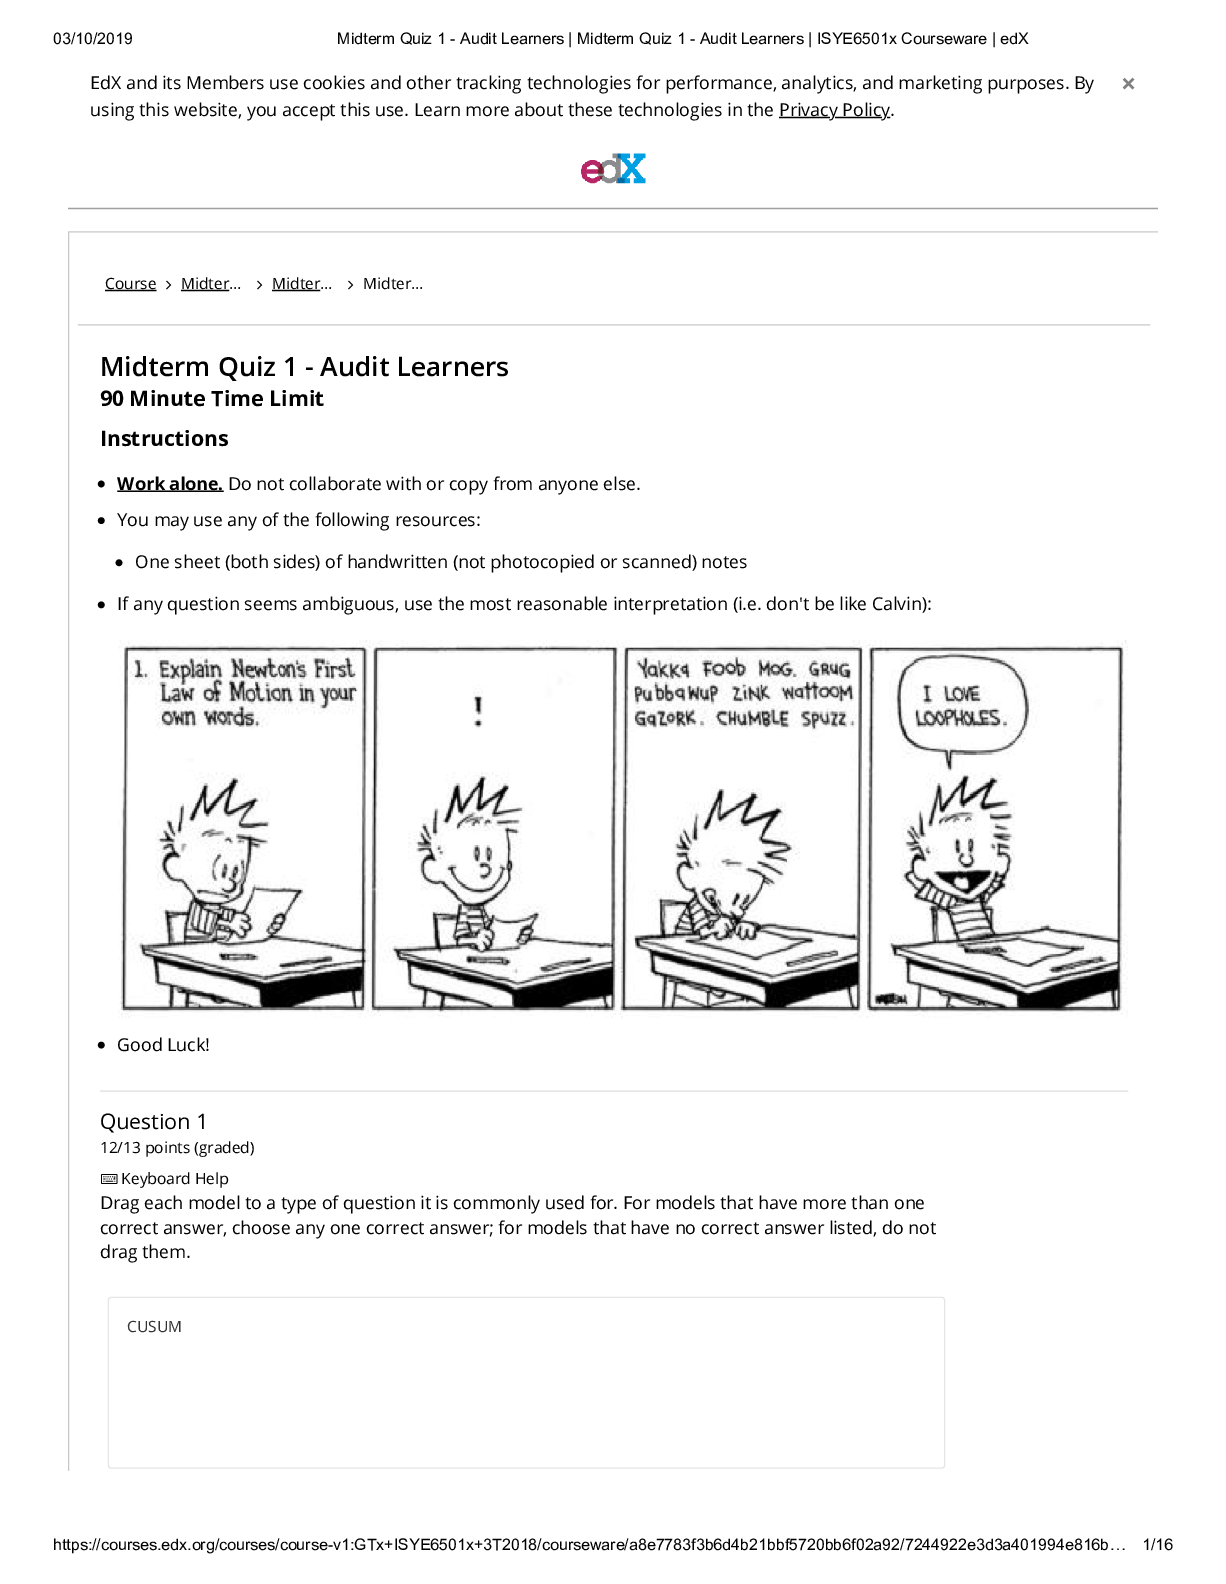
EdX and its Members use cookies and other tracking technologies for performance, analytics, and marketing purposes. By × using this website, you accept this use. Learn more about these technologies ... in the Privacy Policy. Course Midter… Midter… Midter… Midterm Quiz 1 - Audit Learners 90 Minute Time Limit Instructions Work alone. Do not collaborate with or copy from anyone else. You may use any of the following resources: One sheet (both sides) of handwritten (not photocopied or scanned) notes If any question seems ambiguous, use the most reasonable interpretation (i.e. don't be like Calvin): Good Luck! Question 1 12/13 points (graded) Keyboard Help Drag each model to a type of question it is commonly used for. For models that have more than one correct answer, choose any one correct answer; for models that have no correct answer listed, do not drag them. You have used 1 of 1 attempts. Reset Show Answer FEEDBACK Question 2 3.0/3.0 points (graded) Select all of the following models that are designed for use with time series data: You have used 1 of 1 attempt INFORMATION FOR QUESTIONS 3A, 3C FIGURES A AND B SHOW THE TRAINING DATA FOR A CLASSIFICATION PROBLEM, USING TWO PREDICTORS (X1 AND X2 ) TO SEPARATE BETWEEN BLACK AND WHITE POINTS. THE DASHED LINES ARE THE CLASSIFIERS. Figure A Figure B Question 3a 3.0/3.0 points (graded) Figure B shows an SVM classification using a complex nonlinear kernel. (To get this perfect fit to the training data, it required fitting 16 parameter values!) Which of the following is true? You have used 1 of 1 attempt INFORMATION FOR QUESTIONS 3B, 3C FIGURE C Question 3b 0.6/3 points (graded) Keyboard Help PROBLEM Figure C shows a classification that was found by a classification tree model. Drag the components of the classification tree into their correct places so that your tree gives the same classification shown in Figure C. You have used 1 of 1 attempts. Reset Show Answer FEEDBACK Question 3c 4.0/4.0 points (graded) Select all of the following models that would classify the point (3,3) as white: You have used 1 of 1 attempt Question 3d 3.0/3.0 points (graded) In the soft classification SVM model where we select coefficients a0 ... am to minimize n m m ∑ max{0, 1 − (∑ ai xij + a0 ) yj} + C ∑ a2 j−1 i=1 i=1 if we want to have a larger margin even though it means possibly having more classification error, the value of C should get You have used 1 of 1 attempt INFORMATION FOR QUESTIONS 4A, 4B Seven different regression models have been fitted, using different sets of variables. The figure below shows the resulting adjusted R-squared value for various models, as measured by cross-validation. Question 4a 3.0/3.0 points (graded) Just looking at the figure, if you don’t know anything about the predictors, response, etc., which model looks best: 1, 2, 3, 4, 5, 6, or 7? Enter a one-digit answer (1,2,3,4,5,6,or 7) You have used 1 of 1 attempt Question 4b 3.0/3.0 points (graded) Which model would you suggest if the regression predicts the effect of sunspots on the earth’s temperature two months in the future, and variable x6 is something that is not known until a month after the sunspots appear? Enter a one-digit answer (1,2,3,4,5,6,or 7) You have used 1 of 1 attempt INFORMATION FOR QUESTION 4C The table below shows the Akaike Information Criterion (AIC), Corrected AIC, and Bayesian Information Criterion (BIC) for each of the models. Model AIC Corrected AIC BIC 1 -5.58 -5.32 2.07 2 -5.67 -5.15 3.89 3 -6.51 -5.62 4.96 4 -4.77 -3.41 8.61 5 -2.80 -0.85 12.49 6 -1.31 1.35 15.90 7 0.19 3.71 19.31 Question 4c 3.0/3.0 points (graded) Based on the table above, select all of the following statements that are correct. You have used 1 of 1 attempt INFORMATION FOR ALL PARTS OF QUESTION 5 Atlanta’s main library has collected the following day-by-day data over the past six years (more than 2000 data points): x1 = Number of books borrowed from the library on that day x2 = Day of the week x3 = Temperature x4 = Amount of rainfall x5 = Whether the library was closed that day x6 = Whether public schools were open that day Question 5a 2.0/2.0 points (graded) Select all data that are categorical (including binary data): You have used 1 of 1 attempt INFORMATION FOR QUESTIONS 5B, 5C The library believes that if more books were borrowed yesterday, fewer will be borrowed today (and vice versa), so they add a new predictor: x7 = the number of books borrowed the day before. Question 5b 2.0/2.0 points (graded) What is the term for using this type of predictor? You have used 1 of 1 attempt Question 5c 2.0/2.0 points (graded) If the library is correct that on average, if more books were borrowed yesterday, fewer will be borrowed today (and vice versa), what sign (positive or negative) would you expect the new predictor's coefficient a7 to have? You have used 1 of 1 attempt Information for Question 5d The library believes that as the temperature gets either too cold or too hot, more people come indoors to the library to borrow books. They have fit the data to a quadratic function (see the figure below). Question 5d 4.0/4.0 points (graded) How would you incorporate the new information above into the library's regression model? You have used 1 of 1 attempt Question 5e (3 parts) 9.0/9.0 points (graded) The library has built a triple exponential smoothing (Holt-Winters) model of the number of books borrowed each day, using a multiplicative weekly cycle of sesaonality (i.e., L=7). i. The library is closed every year on July 4, so no books are borrowed that day. The model only has a weekly seasonality, not an annual one. Is the model likely to over-predict or under-predict books borrowed on July 4? ii. Is the model likely to over-predict or under-predict books borrowed on July 5? [Assume the library is open on July 5.] iii. Aside from seasonal and trend effects, the library believes that the random variation in books borrowed each day is small. Should they expect the best value of α to be: You have used 1 of 1 attempt INFORMATION FOR QUESTIONS 5F, 5G, 5H The library would like to compare the regression and exponential smoothing models to determine which is a better predictor, using the mean absolute error |(books borrowed) – (model’s estimate)| as a measure of prediction quality. Question 5g 4/4 points (graded) Keyboard Help PROBLEM Match each data set with its purpose. Drag the purpose next to the appropriate data set. You have used 1 of 1 attempts. INFORMATION FOR QUESTION 5H The person who built these models discovered that although the exponential smoothing model performed better on the validation set, the regression model performed better on the test set (see table below). Mean absolute error (validation set) Mean absolute error (test set) Exponential smoothing model 124 139 Regression model 147 126 Question 5h 1/1 point (graded) Which of these is a valid suggestion: Question 5i 3.0/3.0 points (graded) The library would like to determine whether there has been a decrease in the amount of borrowing over the past six years. Select all of the approaches that might reasonably be correct. You have used 1 of 1 attempt INFORMATION FOR QUESTIONS 6A, 6B A logistic regression model was built to model the probability that a retailer’s inventory of a popular product will run out before the next delivery from the manufacturer, based on a number of factors (amount of current inventory, past demand, promotions, etc.). If the logistic regression’s output is greater than a threshold value p, the retailer pays an additional amount for a quick delivery to avoid running out. There are three confusion matrices below, for three different threshold values of p: Question 6a 4/4 points (graded) Keyboard Help PROBLEM Let D be the cost of paying for a quick delivery (if the model's output is above p). Let C be the cost of running out of inventory. Drag C and D and 0 to write the expression for the total cost of using threshold value p=0.3. ....................................................................................continued..................................................................................... [Show More]
Last updated: 1 year ago
Preview 1 out of 16 pages
Reviews( 0 )
Document information
Connected school, study & course
About the document
Uploaded On
Jul 14, 2021
Number of pages
16
Written in

Additional information
This document has been written for:
Uploaded
Jul 14, 2021
Downloads
0
Views
101


.png)