Statistics > QUESTIONS & ANSWERS > Questions and Answers > Concordia University INSE 6220 | Winter 2017 Advanced Statistical Approaches (All)
Questions and Answers > Concordia University INSE 6220 | Winter 2017 Advanced Statistical Approaches to Quality Assignment #1: Solutions
Document Content and Description Below
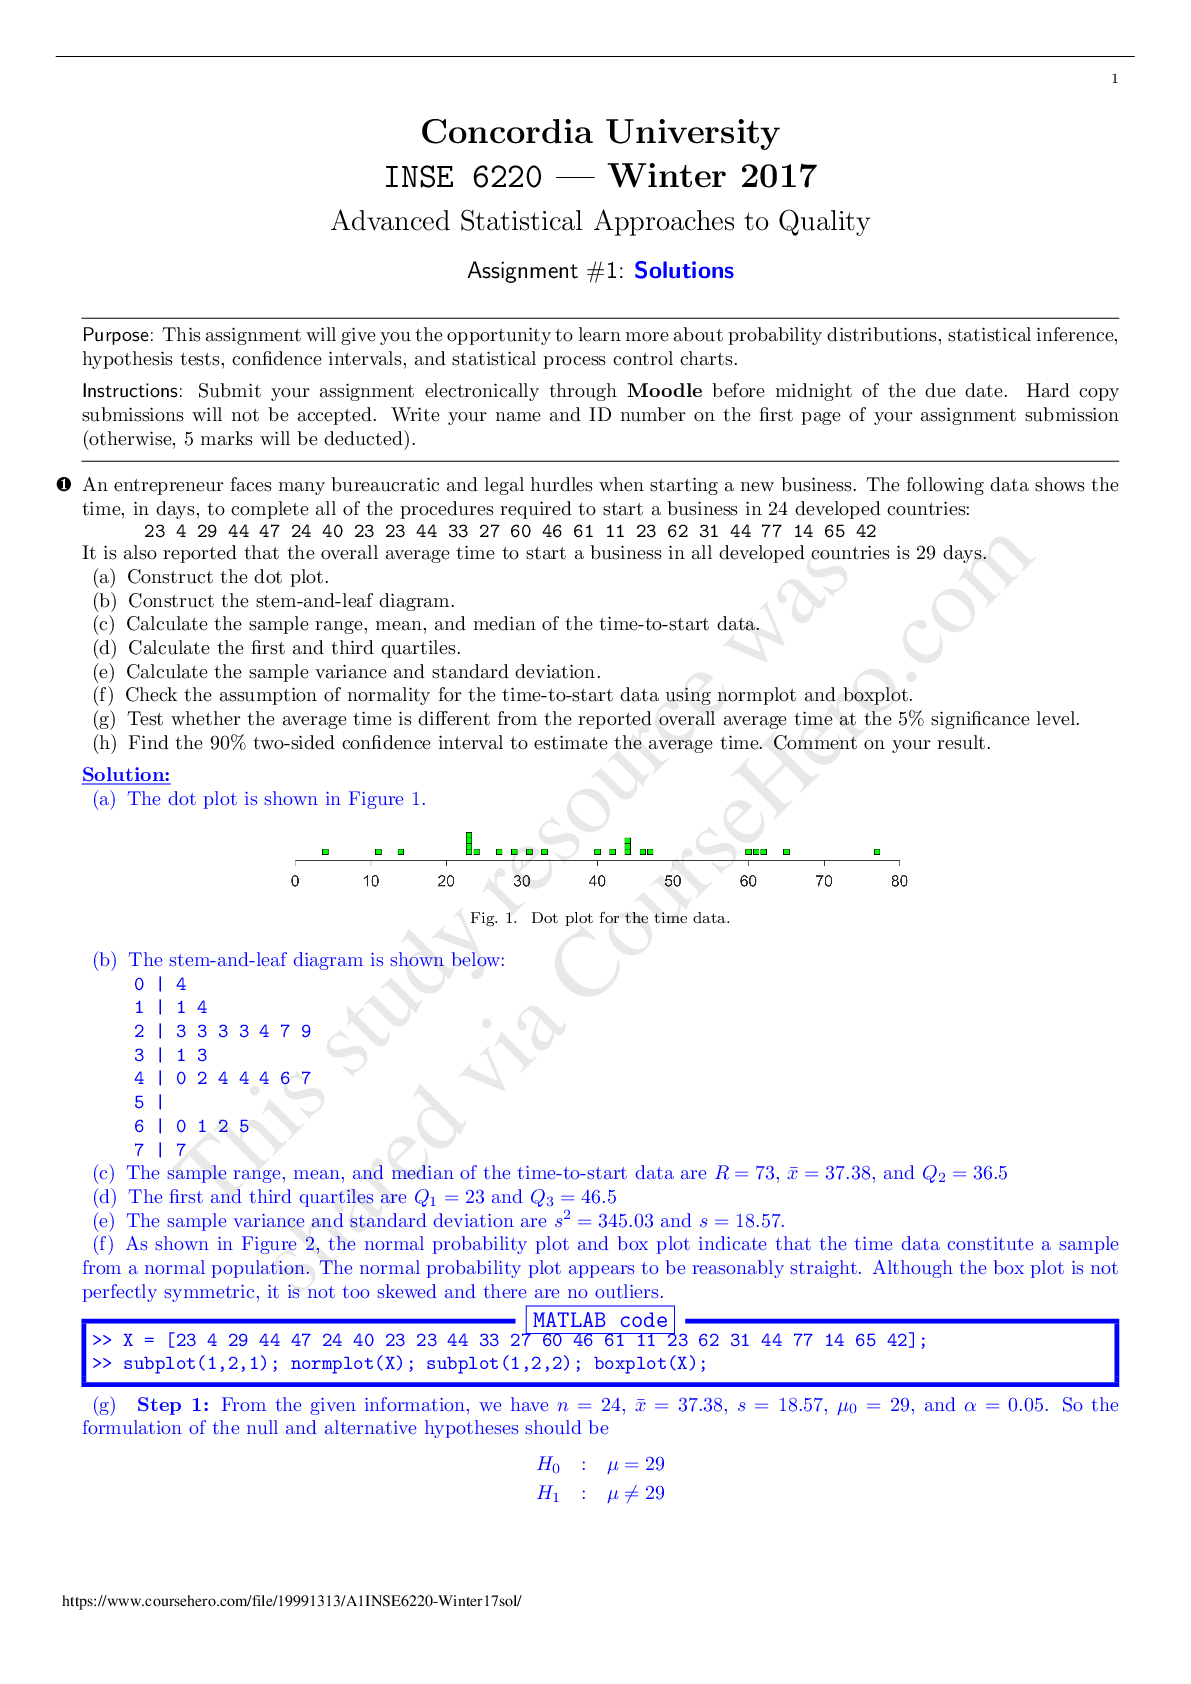
Questions and Answers > Concordia University INSE 6220 | Winter 2017 Advanced Statistical Approaches to Quality Assignment #1: Solutions Concordia University INSE 6220 | Winter 2017 Advanced Statis... tical Approaches to Quality Assignment #1: Solutions An entrepreneur faces many bureaucratic and legal hurdles when starting a new business. The following data shows the time, in days, to complete all of the procedures required to start a business in 24 developed countries: 23 4 29 44 47 24 40 23 23 44 33 27 60 46 61 11 23 62 31 44 77 14 65 42 It is also reported that the overall average time to start a business in all developed countries is 29 days. (a) Construct the dot plot. (b) Construct the stem-and-leaf diagram. (c) Calculate the sample range, mean, and median of the time-to-start data. (d) Calculate the first and third quartiles. (e) Calculate the sample variance and standard deviation. (f) Check the assumption of normality for the time-to-start data using normplot and boxplot. (g) Test whether the average time is different from the reported overall average time at the 5% significance level. (h) Find the 90% two-sided confidence interval to estimate the average time. Comment on your result The management of a bank has embarked on a program of statistical process control and has decided to use variable control charts to study the waiting time of customers during the peak noon to 1 p.m. lunch hour to detect special causes of variation. Four customers are selected during the one-hour period; the first customer to enter the bank every 15 minutes. Each set of four measurements makes up a subgroup (sample). Table I lists the waiting time (operationally defined as the time from when the customer enters the line until he or she begins to be served by the teller) for 20 days. (a) Construct a table that shows the waiting time data along with the sample means and sample ranges. (b) Estimate the process mean and standard deviation. (c) Construct the R- and the X-charts. Identify the out-of-control points using all Western Electric rules. If necessary, revise your control limits, assuming that any samples that violate Western Electric rules can de discarded. (d) Assuming that the waiting times are normally distributed and and that specifications are 6 ± 5 minutes, calculate the process capability index and the proportion of the process that will not meet specifications. [Show More]
Last updated: 1 year ago
Preview 1 out of 5 pages
Buy this document to get the full access instantly
Instant Download Access after purchase
Add to cartInstant download
We Accept:

Reviews( 0 )
$14.00
Document information
Connected school, study & course
About the document
Uploaded On
Jan 10, 2021
Number of pages
5
Written in

Additional information
This document has been written for:
Uploaded
Jan 10, 2021
Downloads
0
Views
41