Statistics > QUESTIONS & ANSWERS > CHAPTER 2 TEST REVIEW QUESTIONS WITH CORRECT ANSWERS (All)
CHAPTER 2 TEST REVIEW QUESTIONS WITH CORRECT ANSWERS
Document Content and Description Below
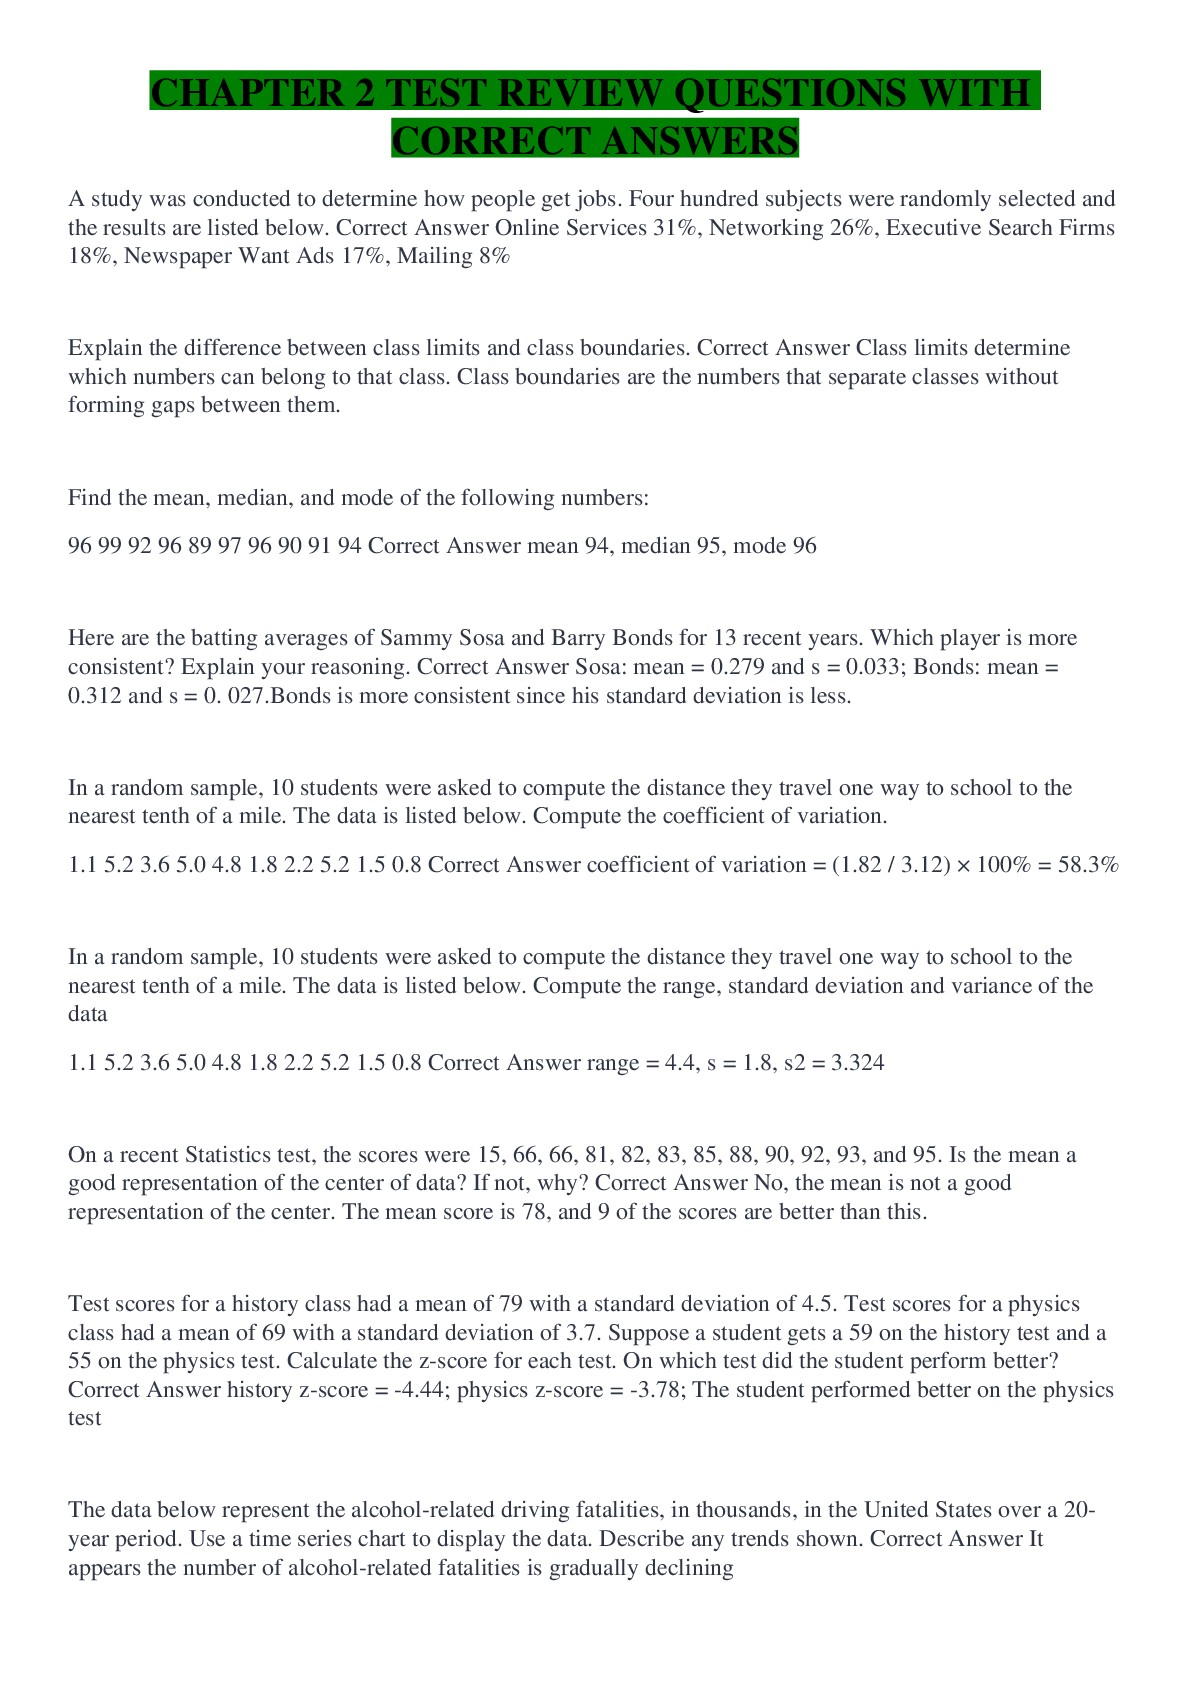
A study was conducted to determine how people get jobs. Four hundred subjects were randomly selected and the results are listed below. Correct Answer Online Services 31%, Networking 26%, Executive Sea... rch Firms 18%, Newspaper Want Ads 17%, Mailing 8% Explain the difference between class limits and class boundaries. Correct Answer Class limits determine which numbers can belong to that class. Class boundaries are the numbers that separate classes without forming gaps between them. Find the mean, median, and mode of the following numbers: 96 99 92 96 89 97 96 90 91 94 Correct Answer mean 94, median 95, mode 96 Here are the batting averages of Sammy Sosa and Barry Bonds for 13 recent years. Which player is more consistent? Explain your reasoning. Correct Answer Sosa: mean = 0.279 and s = 0.033; Bonds: mean = 0.312 and s = 0. 027.Bonds is more consistent since his standard deviation is less. In a random sample, 10 students were asked to compute the distance they travel one way to school to the nearest tenth of a mile. The data is listed below. Compute the coefficient of variation. 1.1 5.2 3.6 5.0 4.8 1.8 2.2 5.2 1.5 0.8 Correct Answer coefficient of variation = (1.82 / 3.12) × 100% = 58.3% In a random sample, 10 students were asked to compute the distance they travel one way to school to the nearest tenth of a mile. The data is listed below. Compute the range, standard deviation and variance of the data 1.1 5.2 3.6 5.0 4.8 1.8 2.2 5.2 1.5 0.8 Correct Answer range = 4.4, s = 1.8, s2 = 3.324 On a recent Statistics test, the scores were 15, 66, 66, 81, 82, 83, 85, 88, 90, 92, 93, and 95. Is the mean a good representation of the center of data? If not, why? Correct Answer No, the mean is not a good representation of the center. The mean score is 78, and 9 of the scores are better than this. Test scores for a history class had a mean of 79 with a standard deviation of 4.5. Test scores for a physics class had a mean of 69 with a standard deviation of 3.7. Suppose a student gets a 59 on the history test and a 55 on the physics test. Calculate the z-score for each test. On which test did the student perform better? Correct Answer history z-score = -4.44; physics z-score = -3.78; The student performed better on the physics test The data below represent the alcohol-related driving fatalities, in thousands, in the United States over a 20-year period. Use [Show More]
Last updated: 1 year ago
Preview 1 out of 6 pages
Reviews( 0 )
Document information
Connected school, study & course
About the document
Uploaded On
Dec 16, 2022
Number of pages
6
Written in

Additional information
This document has been written for:
Uploaded
Dec 16, 2022
Downloads
0
Views
36


 Exam Preparation With Correct Answers Graded A+-1.png)