Economics > STUDY GUIDE > Study guide MATH 225N Week 8 Performing Linear Regressions with Technology (All)
Study guide MATH 225N Week 8 Performing Linear Regressions with Technology
Document Content and Description Below
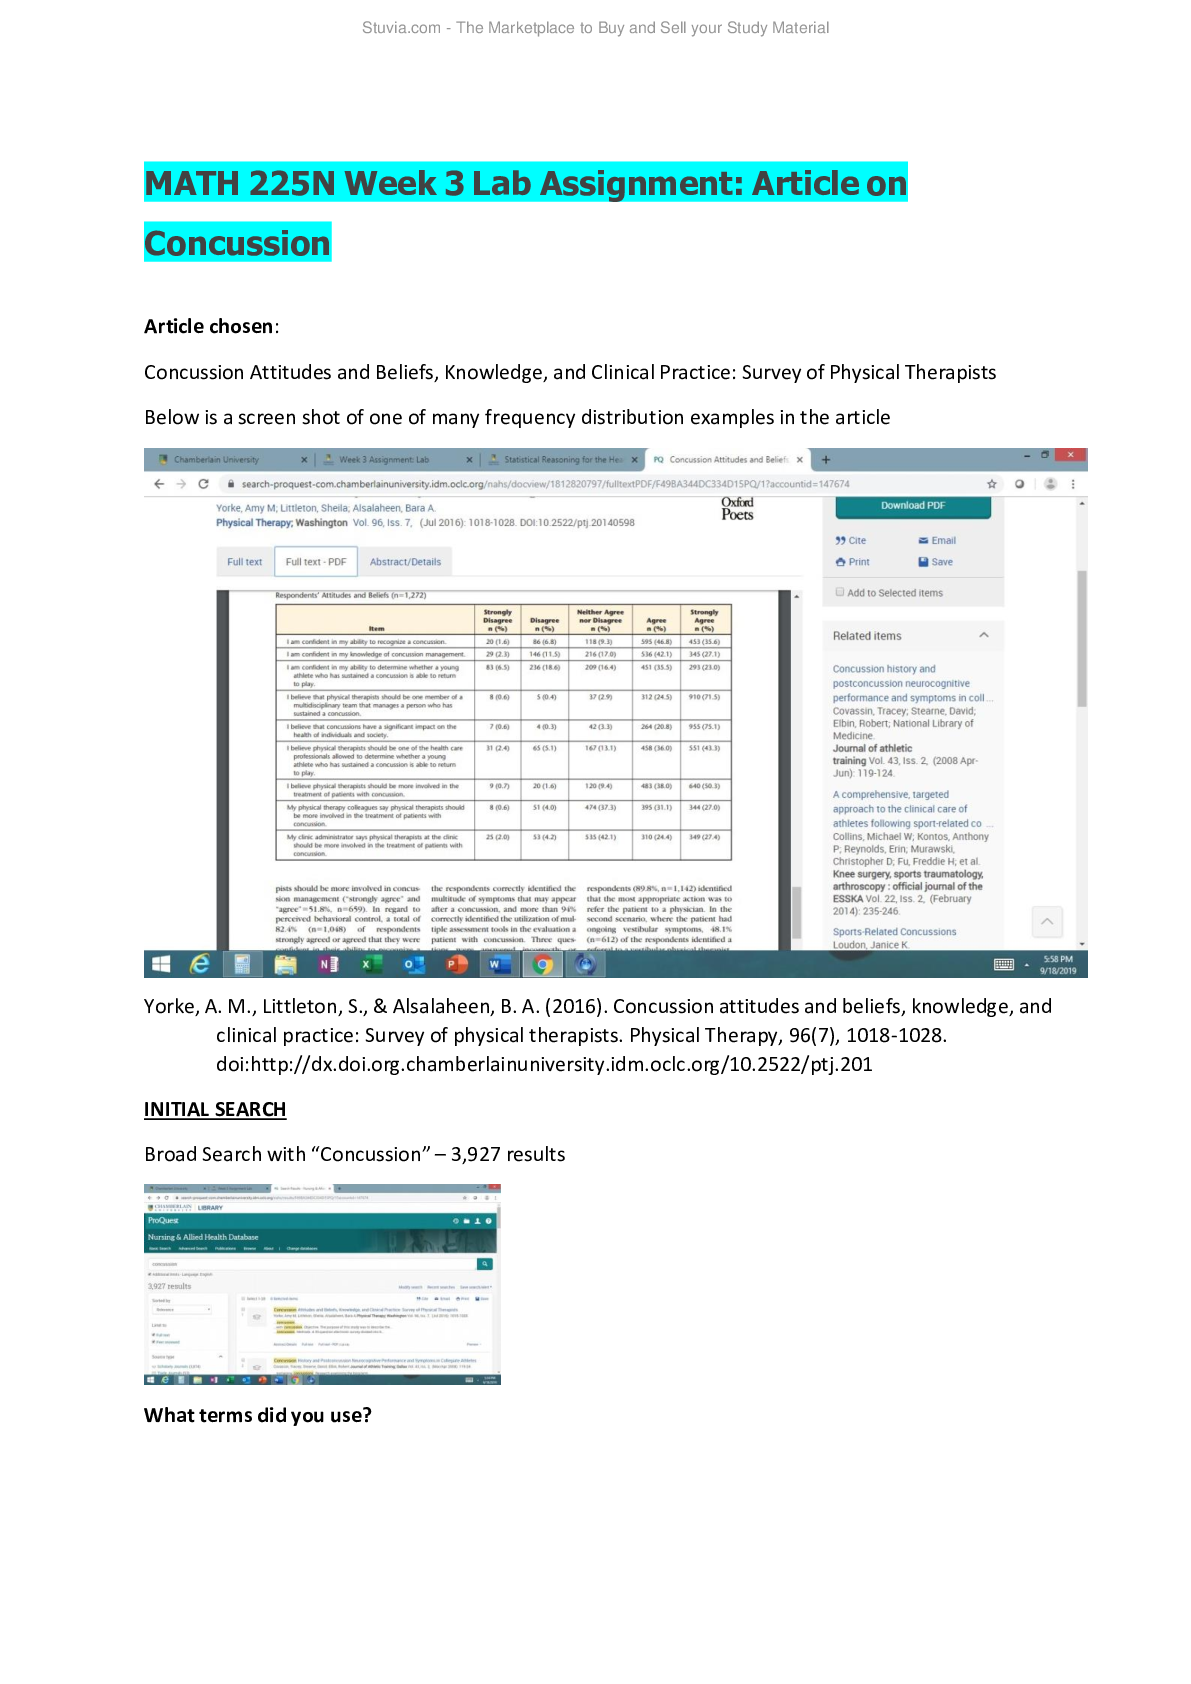
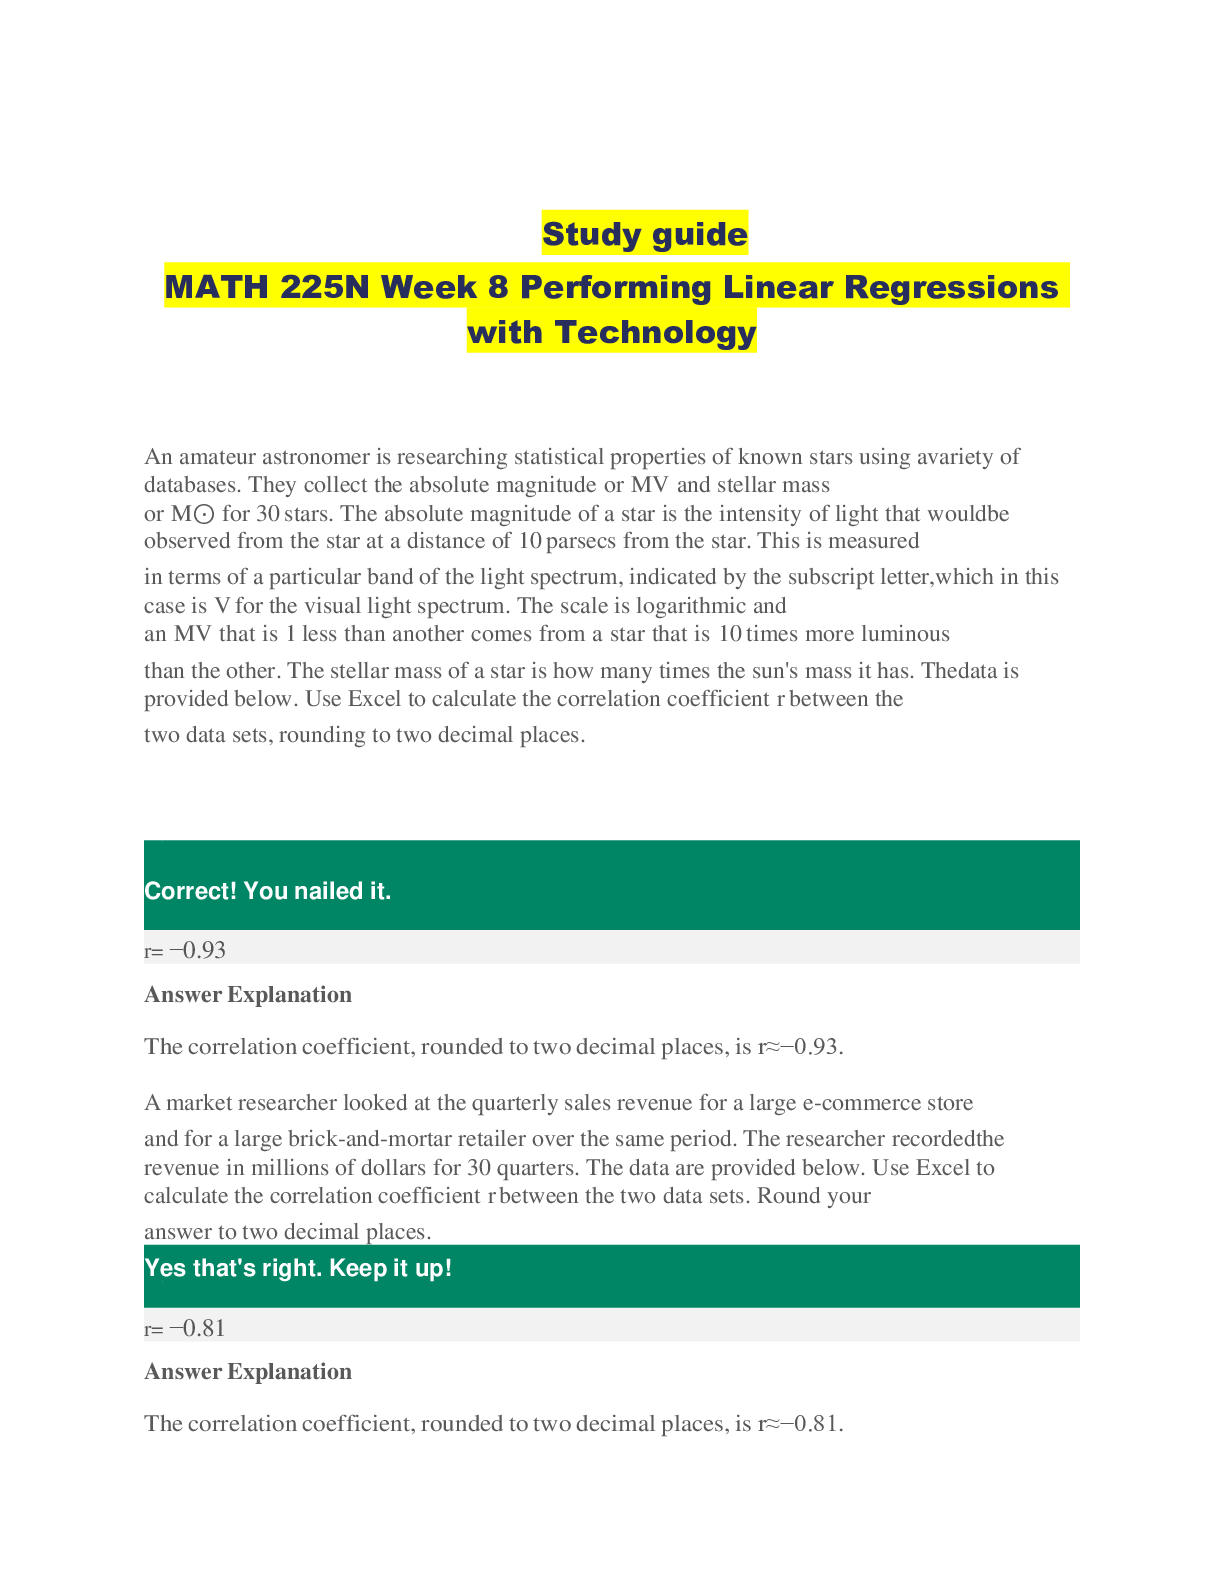
An amateur astronomer is researching statistical properties of known stars using a variety of databases. They collect the absolute magnitude or MV and stellar mass or M⊙ for 30 stars. The absolute ... magnitude of a star is the intensity of light that would be observed from the star at a distance of 10 parsecs from the star. This is measured in terms of a particular band of the light spectrum, indicated by the subscript letter, which in this case is V for the visual light spectrum. The scale is logarithmic and an MV that is 1 less than another comes from a star that is 10 times more luminous than the other. The stellar mass of a star is how many times the sun's mass it has. The data is provided below. Use Excel to calculate the correlation coefficient r between the two data sets, rounding to two decimal places. Answer Explanation The correlation coefficient, rounded to two decimal places, is r≈−0.93. A market researcher looked at the quarterly sales revenue for a large e-commerce store and for a large brick-and-mortar retailer over the same period. The researcher recorded the revenue in millions of dollars for 30 quarters. The data are provided below. Use Excel to calculate the correlation coefficient r between the two data sets. Round your answer to two decimal places. Answer Explanation The correlation coefficient, rounded to two decimal places, is r≈−0.81. [Show More]
Last updated: 1 year ago
Preview 1 out of 55 pages
Reviews( 0 )
Document information
Connected school, study & course
About the document
Uploaded On
Jan 02, 2023
Number of pages
55
Written in

Additional information
This document has been written for:
Uploaded
Jan 02, 2023
Downloads
0
Views
86