Business > Solutions Guide > University of Michigan - IOE 373ioe373w14-HW10-solution (All)
University of Michigan - IOE 373ioe373w14-HW10-solution
Document Content and Description Below
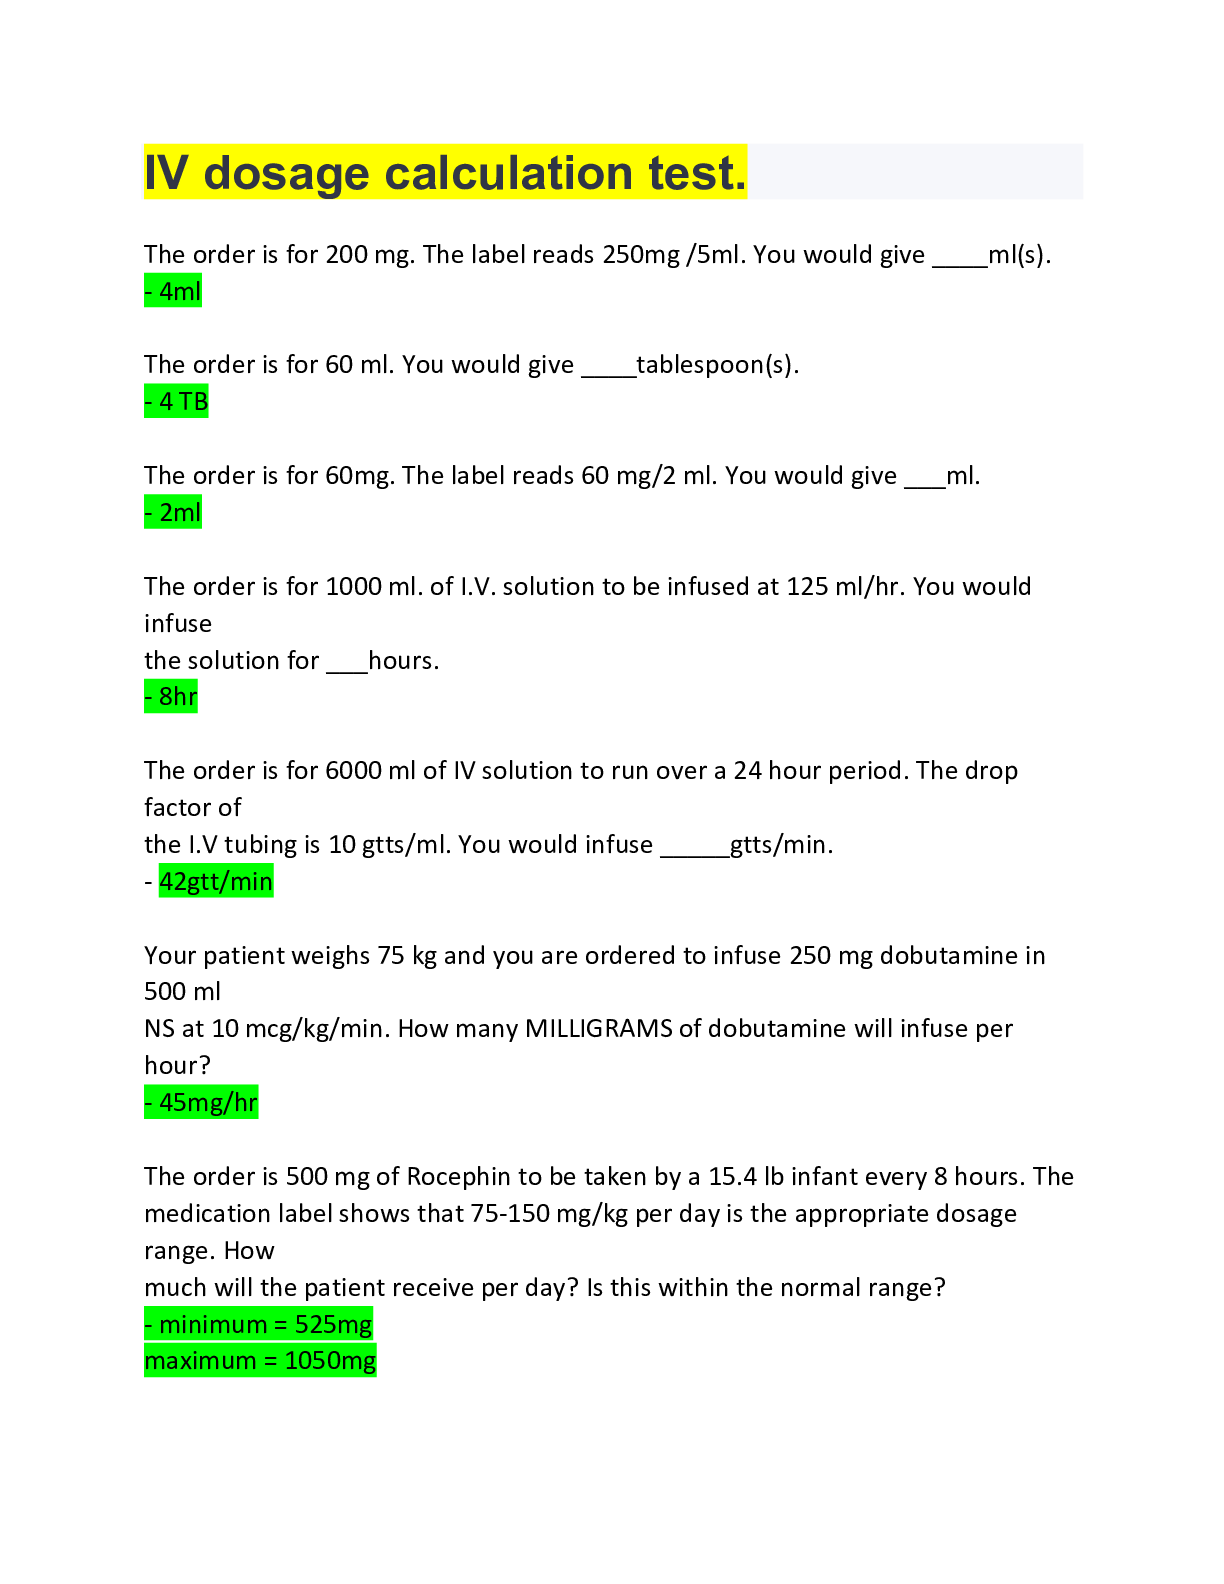
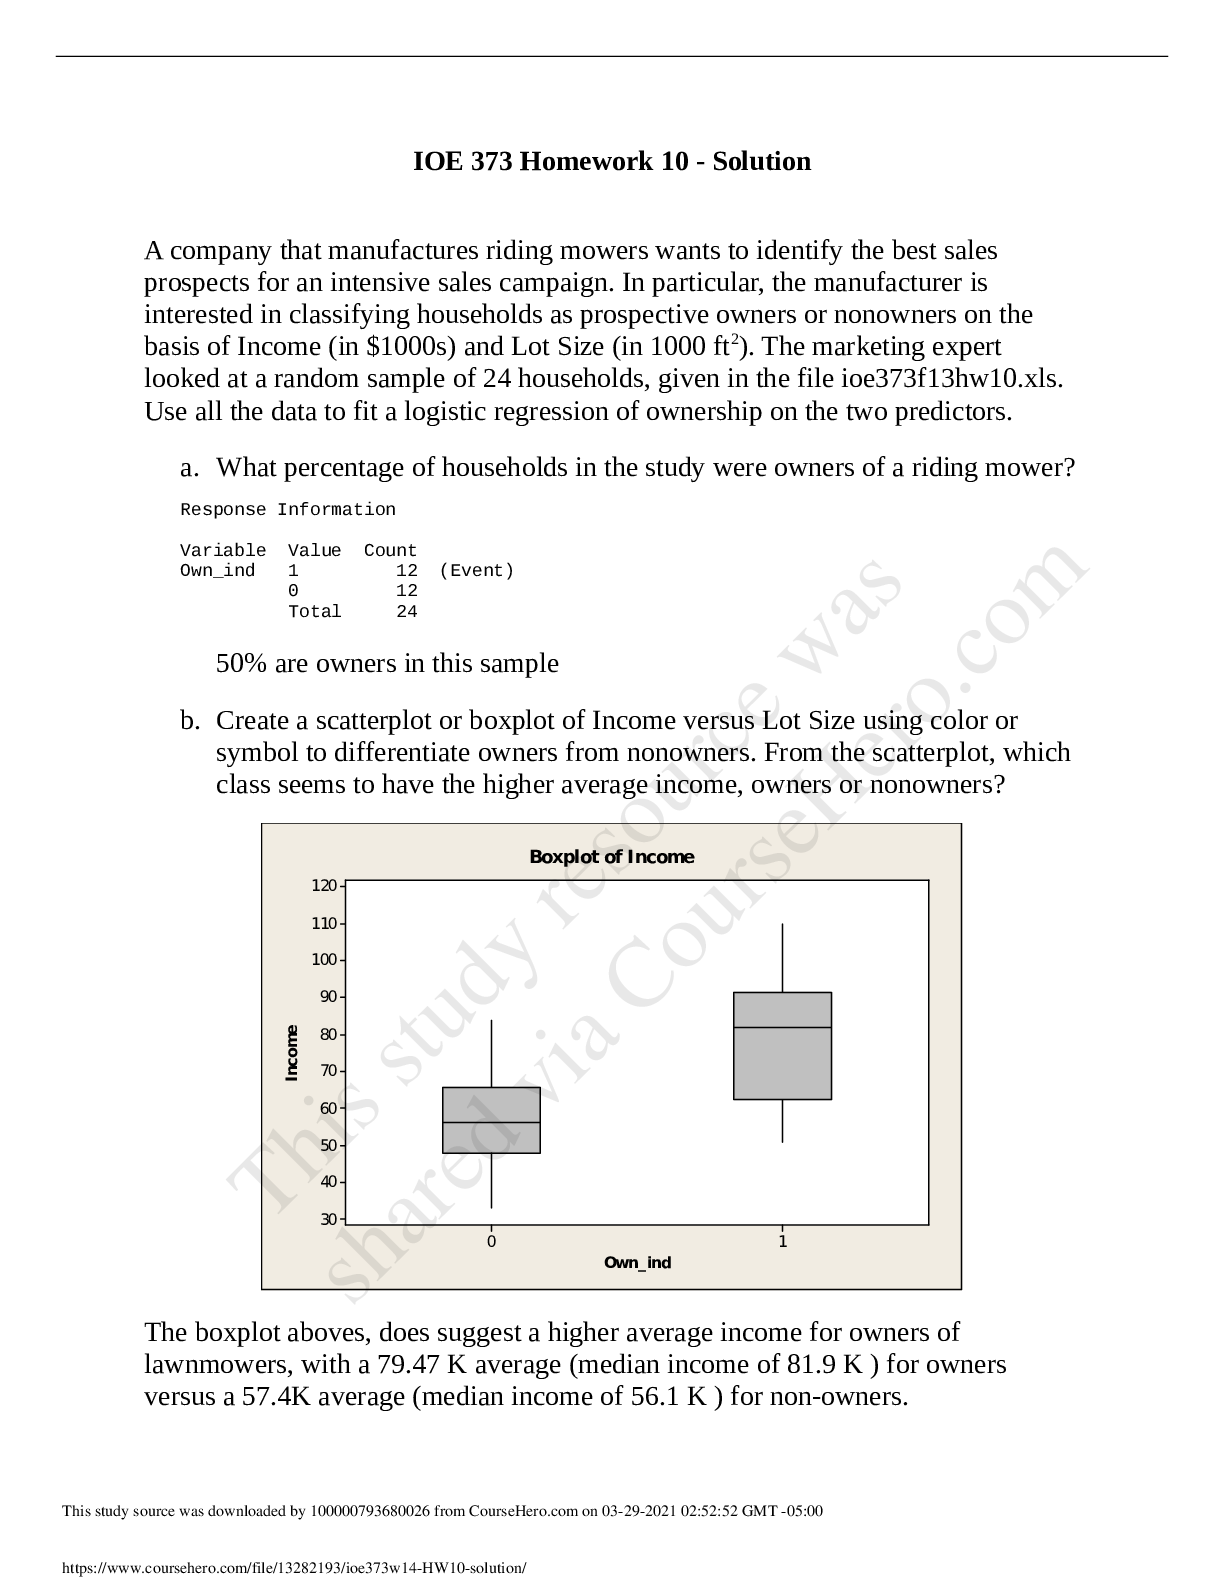
IOE 373 Homework 10 - Solution A company that manufactures riding mowers wants to identify the best sales prospects for an intensive sales campaign. In particular, the manufacturer is interested in... classifying households as prospective owners or nonowners on the basis of Income (in $1000s) and Lot Size (in 1000 ft2). The marketing expert looked at a random sample of 24 households, given in the file ioe373f13hw10.xls. Use all the data to fit a logistic regression of ownership on the two predictors. a. What percentage of households in the study were owners of a riding mower? Response Information Variable Value Count Own_ind 1 12 (Event) 0 12 Total 24 50% are owners in this sample b. Create a scatterplot or boxplot of Income versus Lot Size using color or symbol to differentiate owners from nonowners. From the scatterplot, which class seems to have the higher average income, owners or nonowners? [Show More]
Last updated: 1 year ago
Preview 1 out of 3 pages
Reviews( 0 )
Document information
Connected school, study & course
About the document
Uploaded On
Mar 29, 2021
Number of pages
3
Written in

Additional information
This document has been written for:
Uploaded
Mar 29, 2021
Downloads
0
Views
122


.png)


.png)


.png)