Mathematics > MARK SCHEME > AS Practice Paper H (Statistics & Mechanics) mark scheme LATEST 2021/2022 (All)
AS Practice Paper H (Statistics & Mechanics) mark scheme LATEST 2021/2022
Document Content and Description Below
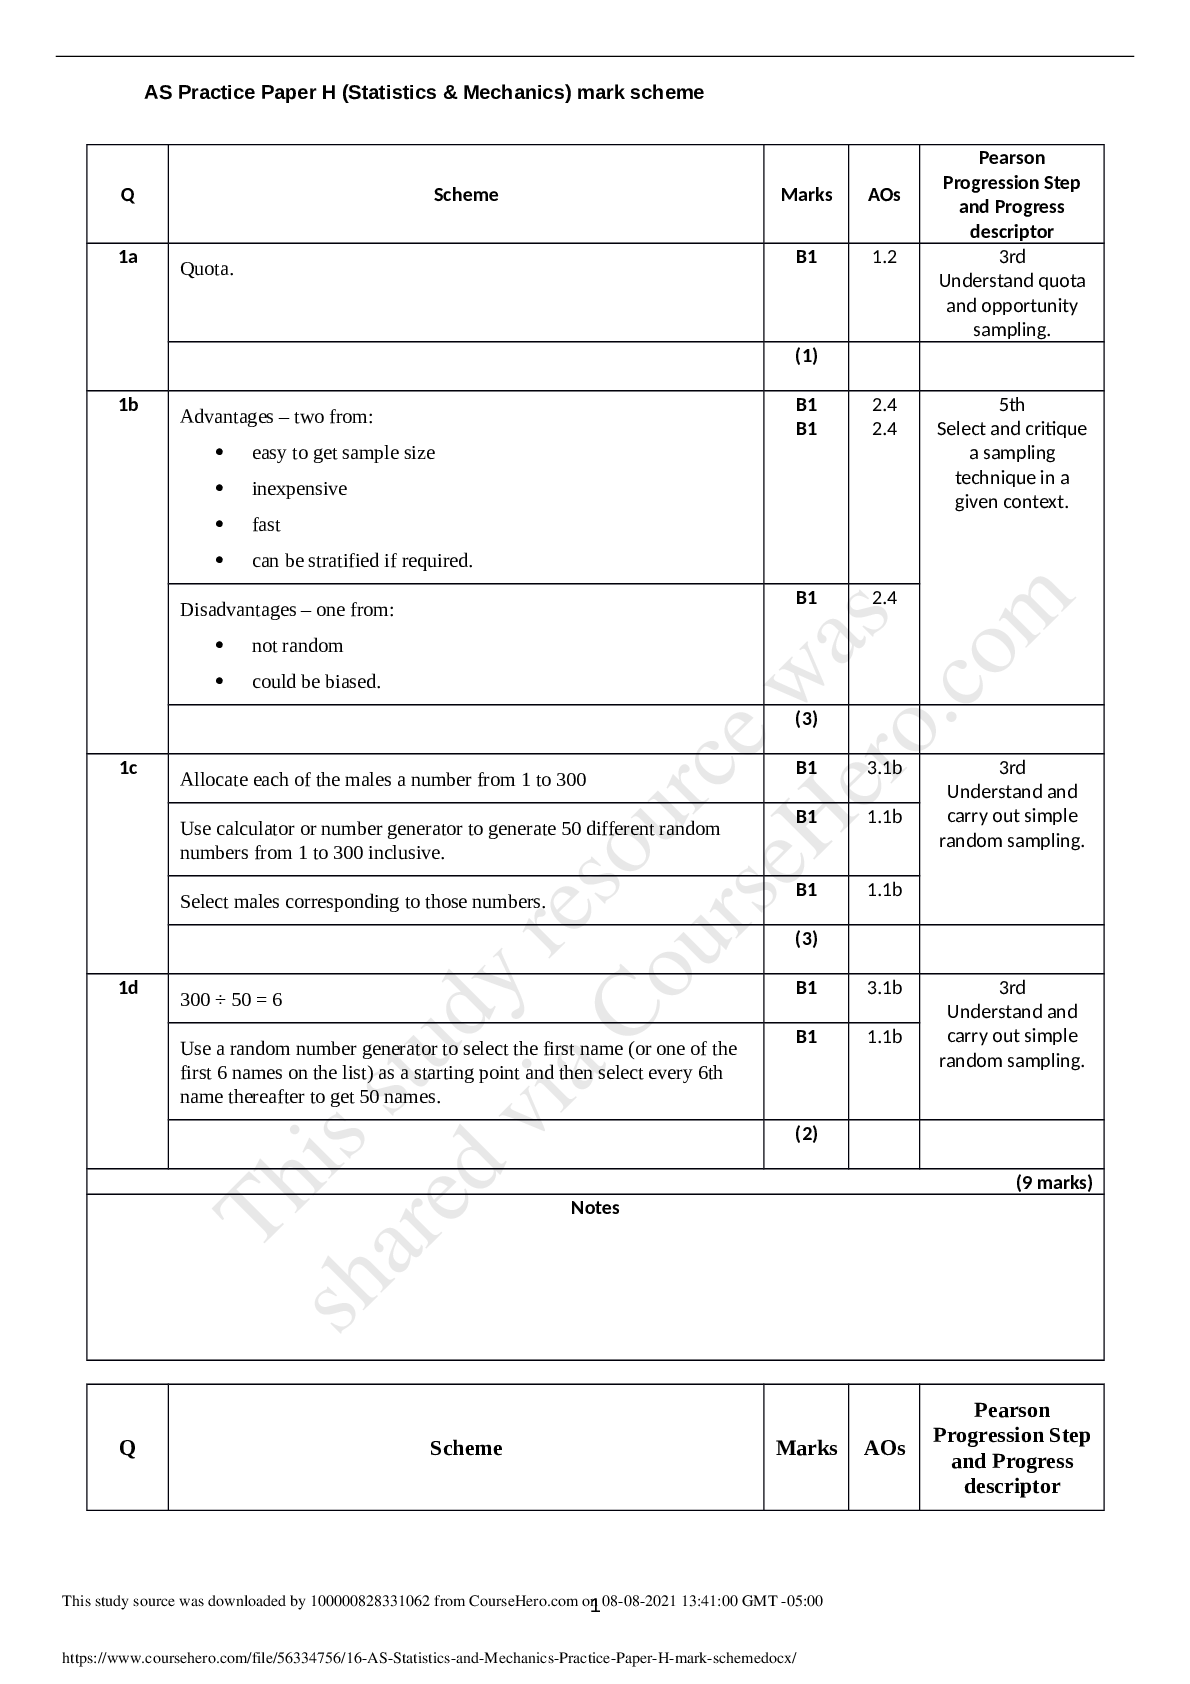
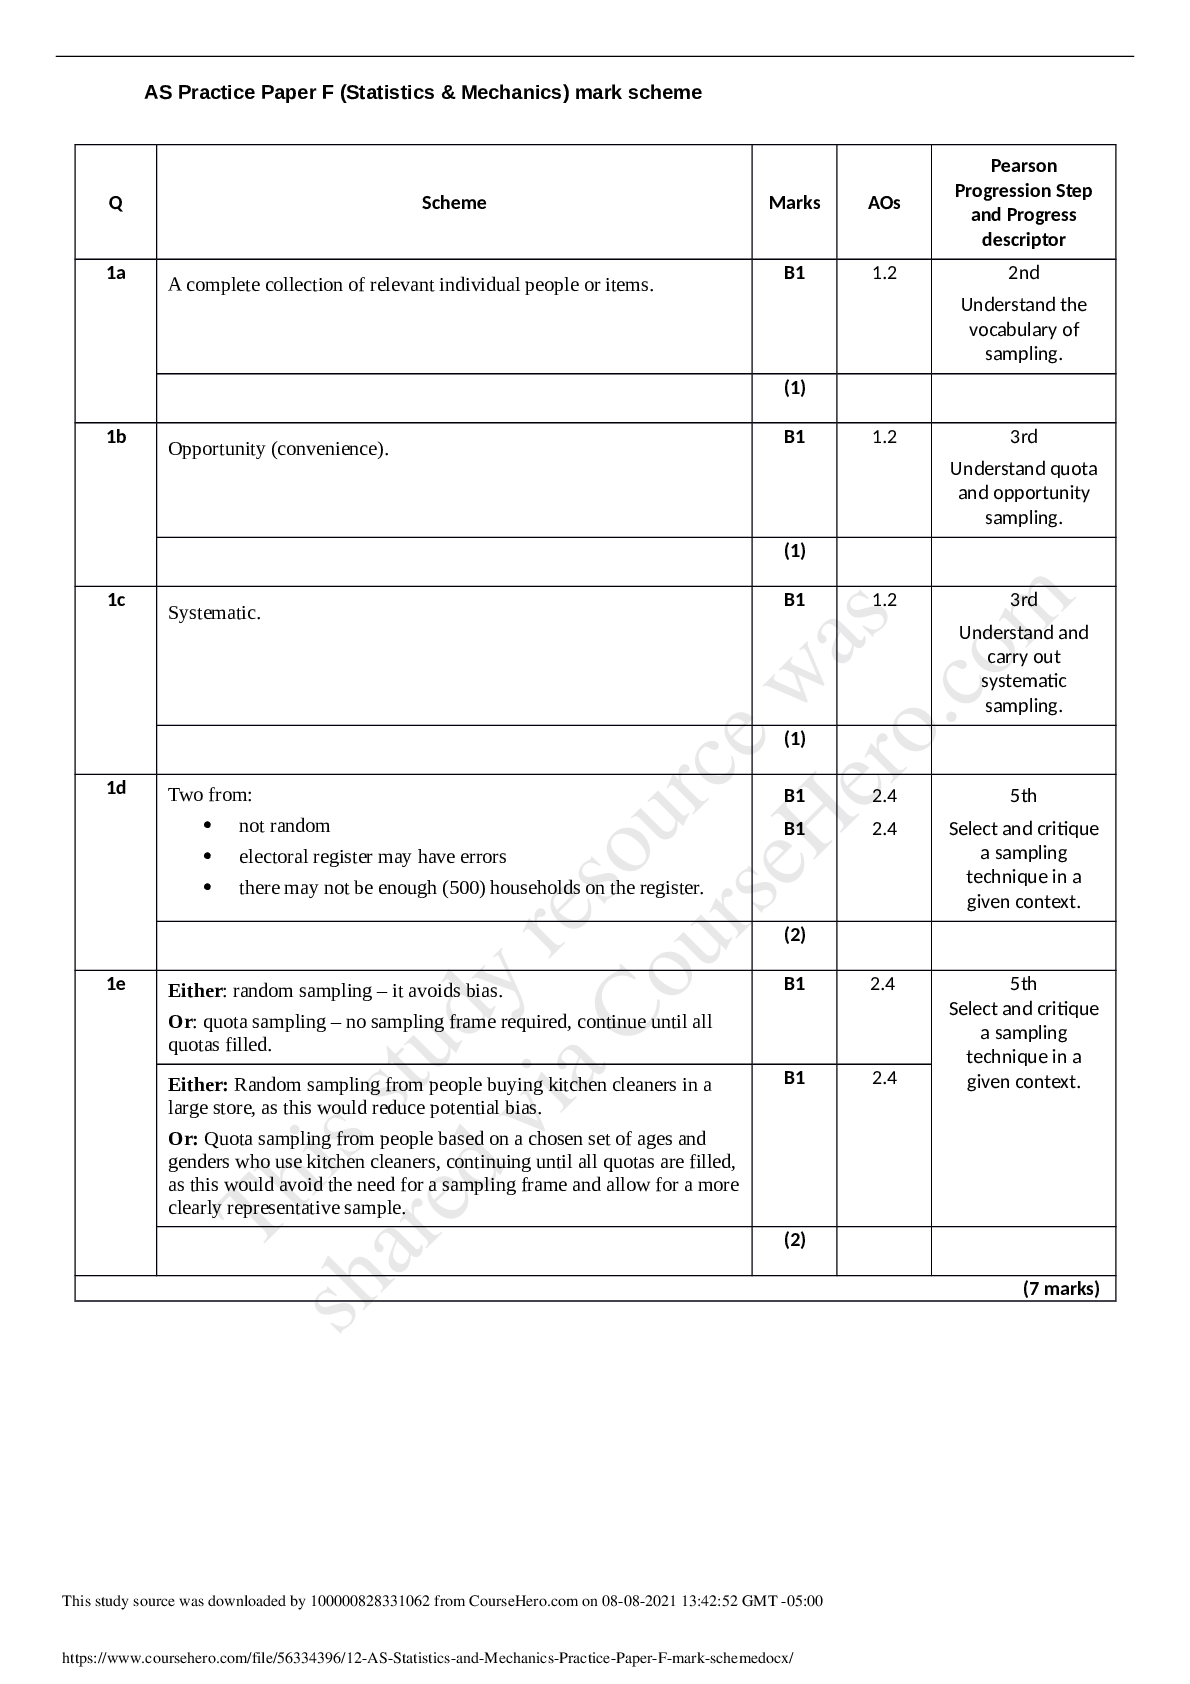
AS Practice Paper H (Statistics & Mechanics) mark scheme Q Scheme Marks AOs Pearson Progression Step and Progress descriptor 1a Quota. B1 1.2 3rd Understand quota and opportunity sampling. ( 1) 1b Adv... antages – two from: easy to get sample size inexpensive fast can be stratified if required. B1 B1 2.4 2.4 5th Select and critique a sampling technique in a given context. Disadvantages – one from: not random could be biased. B1 2.4 (3) 1c Allocate each of the males a number from 1 to 300 B1 3.1b 3rd Understand and carry out simple random sampling. Use calculator or number generator to generate 50 different random numbers from 1 to 300 inclusive. B1 1.1b Select males corresponding to those numbers. B1 1.1b (3) 1d 300 ÷ 50 = 6 B1 3.1b 3rd Understand and carry out simple random sampling. Use a random number generator to select the first name (or one of the first 6 names on the list) as a starting point and then select every 6th name thereafter to get 50 names. B1 1.1b (2) (9 marks) Notes Q Scheme Marks AOs Pearson Progression Step and Progress descriptor 1 This study source was downloaded by 100000818171864 from CourseHero.com on 06-25-2021 04:14:13 GMT -05:00 https://www.coursehero.com/file/56334756/16-AS-Statistics-and-Mechanics-Practice-Paper-H-mark-schemedocx/ This study resource was shared via CourseHero.comAS Practice Paper H (Statistics & Mechanics) mark scheme 2a All points correctly plotted. B2 1.1b 2nd Draw and interpret scatter diagrams for bivariate data. (2) 2b The points lie reasonably close to a straight line (o.e.). B1 2.4 2nd Draw and interpret scatter diagrams for bivariate data. (1) 2c f B1 1.2 2nd Know and understand the language of correlation and regression. (1) 2d Line of best fit plotted for at least 2.2 ⩽ x ⩽ 8 with D and F above and B and C below. M1 1.1a 4th Make predictions using the regression line within the range of the data. 26 to 31 inclusive (must be correctly read from x = 7 from the line of best fit). A1 1.1b (2) 2 This study source was downloaded by 100000818171864 from CourseHero.com on 06-25-2021 04:14:13 GMT -05:00 https://www.coursehero.com/file/56334756/16-AS-Statistics-and-Mechanics-Practice-Paper-H-mark-schemedocx/ This study resource was shared via CourseHero.comAS Practice Paper H (Statistics & Mechanics) mark scheme 2e It is reliable because it is interpolation (700 km is within the range of values collected). B1 2.4 4th Understand the concepts of interpolation and extrapolation. (1) 2f No, it is not sensible since this would be extrapolation (as 180 km is outside the range of distances collected). B1 2.4 4th Understand the concepts of interpolation and extrapolation. (1) (8 marks) Notes 2a First B1 for at least 4 points correct, second B1 for all points correct. 2b Do not accept ‘The points lie reasonably close to a line’. Linear or straight need to be noted. 2e Also allow ‘It is reliable because the points lie reasonably close to a straight line’. 2f Allow the answer ‘It is sensible since even though it is extrapolation it is not by much’ provided that the answer contains both ideas (i.e. it IS extrapolation but by a small amount compared to the given range of data). 3 This study source was downloaded by 100000818171864 from CourseHero.com on 06-25-2021 04:14:13 GMT -05:00 https://www.coursehero.com/file/56334756/16-AS-Statistics-and-Mechanics-Practice-Paper-H-mark-schemedocx/ This study resource was shared via CourseHero.comAS Practice Paper H (Statistics & Mechanics) mark scheme Q Scheme Marks AOs Pearson Progression Step and Progress descriptor 3a Correct tree structure. All labels correct. All probabilities correct. B1 B1 B1 3.1a 1.1b 1.1b 3rd Draw and use tree diagrams with three branches and/or three levels. (3) 3bi 1 3 ´ 1 10 = 1 30 or equivalent. M1 A1 3.4 1.1b 3rd Draw and use tree diagrams with three branches and/or three levels. (2) 3bii Car NL + Bike NL + Foot NL = 1 2 ´ 4 5 æ è ç ö ø ÷ + 1 6 ´ 3 5 æ è ç ö ø ÷ + 1 3 ´ 9 10 æ è ç ö ø ÷ M1 3.4 3rd Draw and use tree diagrams with three branches and/or three = levels. 4 5 or equivalent. A1 1.1b (2) (7 marks) Notes 3bii ft from their tree diagram. Allow one error for M1. 4 This study source was downloaded by 100000818171864 from CourseHero.com on 06-25-2021 04:14:13 GMT -05:00 https://www.coursehero.com/file/56334756/16-AS-Statistics-and-Mechanics-Practice-Paper-H-mark-schemedocx/ This study resource was shared via CourseHero.comAS Practice Paper H (Statistics & Mechanics) mark scheme Can also be found from 1- 1 2 ´ 1 5 æ è ç ö ø ÷ + 1 6 ´ 2 5 æ è ç ö ø ÷ + 1 3 ´ 1 10 æ è ç ö ø ÷ æ è ç ö ø ÷ Q Scheme Marks AOs Pearson Progression Step and Progress descriptor 4a Two from: Each bolt is either faulty or not faulty. The probability of a bolt being faulty (or not) may be assumed constant. Whether one bolt is faulty (or not) may be assumed to be independent (or does not affect the probability of) whether another bolt is faulty (or not). There is a fixed number (50) of bolts. A random sample. B2 1.2 1.2 5th Understand the binomial distribution (and its notation) and its use as a model. (2) 4b Let X represent the number of faulty bolts. X~B(50, 0.25) P(X ⩽ 6) = 0.0194 P(X ⩽ 7) = 0.0453 P(X ⩾ 19) = 0.0287 P(X ⩾ 20) = 0.0139 M1 M1dep 3.4 1.1b 5th Find critical values and critical regions for a binomial distribution. Critical Region is X ⩽ 6 X ⩾ 20 A2 1.1b 1.1b (4) (6 marks) Notes 4a Each comment must be in context for its mark. 5 This study source was downloaded by 100000818171864 from CourseHero.com on 06-25-2021 04:14:13 GMT -05:00 https://www.coursehero.com/file/56334756/16-AS-Statistics-and-Mechanics-Practice-Paper-H-mark-schemedocx/ This study resource was shared via CourseHero.comAS Practice Paper H (Statistics & Mechanics) mark scheme Q Scheme Marks AOs Pearson Progression Step and Progress descriptor 5a Makes an attempt to find the absolute value. For example, 2 2 14 22 + is seen. M1 3.1b 4th Find the magnitude and direction of a vector quantity. Simplifies to 680 M1 1.1b Finds speed = 26.07… (ms−1) Accept awrt 26.1 (ms−1) A1 1.1b (3) 5b States that 22 tan 14 = M1 1.1b 4th Find the magnitude and direction of a vector quantity. Finds the value of θ, θ = 57.52… A1 1.1b Demonstrates that the angle with the unit j vector is 90 – 57.52… M1 1.1b Finds 32.47… (°) Accept awrt 32.5(°) A1 1.1b (4) 5c Ignore the value of friction between the hockey puck and the ice. B1 3.4 3rd Understand assumptions common in mathematical modelling. (1) 5d 3 1.4 g 1kg 100cm 100 cm 100cm 1cm 1000g 1m 1m 1m ´ ´ ´ ´ Award 1 method mark for division by 1000 and 1 method mark for multiplication by 100 only once and the final method mark for multiplication by 100 three times. M3 1.1b 4th Know derived quantities and SI units. 1400 kg m−3 A1 1.1b (4) (12 marks) Notes 5b Award all 4 marks for a correct final answer. Award 2 marks for a student stating 14 tan 22 = , and then either making a mistake with the inverse or subtracting that answer from 90. 6 This study source was downloaded by 100000818171864 from CourseHero.com on 06-25-2021 04:14:13 GMT -05:00 https://www.coursehero.com/file/56334756/16-AS-Statistics-and-Mechanics-Practice-Paper-H-mark-schemedocx/ This study resource was shared via CourseHero.comAS Practice Paper H (Statistics & Mechanics) mark scheme 7 This study source was downloaded by 100000818171864 from CourseHero.com on 06-25-2021 04:14:13 GMT -05:00 https://www.coursehero.com/file/56334756/16-AS-Statistics-and-Mechanics-Practice-Paper-H-mark-schemedocx/ This study resource was shared via CourseHero.comAS Practice Paper H (Statistics & Mechanics) mark scheme Q Scheme Marks AOs Pearson Progression Step and Progress descriptor 6 Makes an attempt to integrate 1 2 3 20 500 a t t = - Raising power by one would constitute an attempt. M1 3.1b 6th Uses differentiation to solve problems in kinematics. Correctly finds 1 20 1 3 4 . 500 3 4 v t t æ ö = - ç ÷ è ø Note that C = 0. A1 1.1b Makes an attempt to integrate 1 20 1 3 4 500 3 4 v t t æ ö = - ç ÷ è ø . Raising power by one would constitute an attempt. M1 3.1b Correctly finds 1 20 1 4 5 500 12 20 s t t æ ö = - ç ÷ è ø . Note that C = 0. A1 1.1b Substitutes t = 10 into 1 20 1 4 5 500 12 20 s t t æ ö = - ç ÷ è ø to obtain 70 3 s = (m). Accept awrt 23.3 (m). A1 f 1.1b (5) (5 marks) Notes 6 Award the final accuracy mark for a correct substitution using their equation for displacement. Q Scheme Marks AOs Pearson Progression Step and Progress 8 This study source was downloaded by 100000818171864 from CourseHero.com on 06-25-2021 04:14:13 GMT -05:00 https://www.coursehero.com/file/56334756/16-AS-Statistics-and-Mechanics-Practice-Paper-H-mark-schemedocx/ This study resource was shared via CourseHero.comAS Practice Paper H (Statistics & Mechanics) mark scheme descriptor 7a Makes an attempt to substitute t = 25 into 2 s t t = - 30 0.4 . For example 2 s = - 30 25 0.4 25 is seen. M1 1.1b 5th Use equations of motion to solve problems in unfamiliar contexts. Correctly states that AB = 500 (m). Accept s = 500 (m). A1 1.1b (2) 7b Differentiates 2 s t t = - 30 0.4 to obtain v t = - 30 0.8 M1 3.1b 6th Solve problems using calculus and the equations of motion. Differentiates v t = - 30 0.8 to obtain a =- 0.8 M1 3.1b States that a =- 0.8 (m s−2) is a constant as it does not depend on t. A1 3.5a (3) 7c States distance of the car from point A is 2 1 s t t = - 30 0.4 M1 3.3 6th Solve problems using calculus and the equations of motion. u = 2 and a = 0.1 and an attempt to use 1 2 2 s ut at = + is seen. M1 3.3 States distance of the runner from point B is 2 2 s t t = + 2 0.05 M1 1.1b States that the runner and the car will pass each other when their distances total 500 (m), or writes 1 2 s s + =500 (m)or writes 2 2 30 0.4 2 0.05 500 t t t t - + + = M1 3.3 States that 2 0.35 32 500 0 t t - + = or equivalent. A1 1.1b Solves to find t = 20 (s). Answer does not need to state that t = 500 7 or 71.4… (s) is not in the given range. A1 1.1b Makes an attempt to substitute t = 20 into 2 1 s t t = - 30 0.4 or 2 2 s t t = + 2 0.05 . M1 1.1b Correctly states they will pass each other 440 (m) from A or 60 (m) from B. A1 f 3.5a (8) (13 marks) Notes 9 This study source was downloaded by 100000818171864 from CourseHero.com on 06-25-2021 04:14:13 GMT -05:00 https://www.coursehero.com/file/56334756/16-AS-Statistics-and-Mechanics-Practice-Paper-H-mark-schemedocx/ This study resource was shared via CourseHero.com Powered by TCPDF (www.tcpdf.org [Show More]
Last updated: 1 year ago
Preview 1 out of 9 pages
Reviews( 0 )
Document information
Connected school, study & course
About the document
Uploaded On
Aug 08, 2021
Number of pages
9
Written in

Additional information
This document has been written for:
Uploaded
Aug 08, 2021
Downloads
0
Views
82


.png)


 October 2020 Pearson Edexcel GCE In AS Level Mathematics 8MA0 Paper 1 Pure Mathematics.png)