Mathematics > MARK SCHEME > AS Practice Paper F (Statistics & Mechanics) mark scheme (All)
AS Practice Paper F (Statistics & Mechanics) mark scheme
Document Content and Description Below
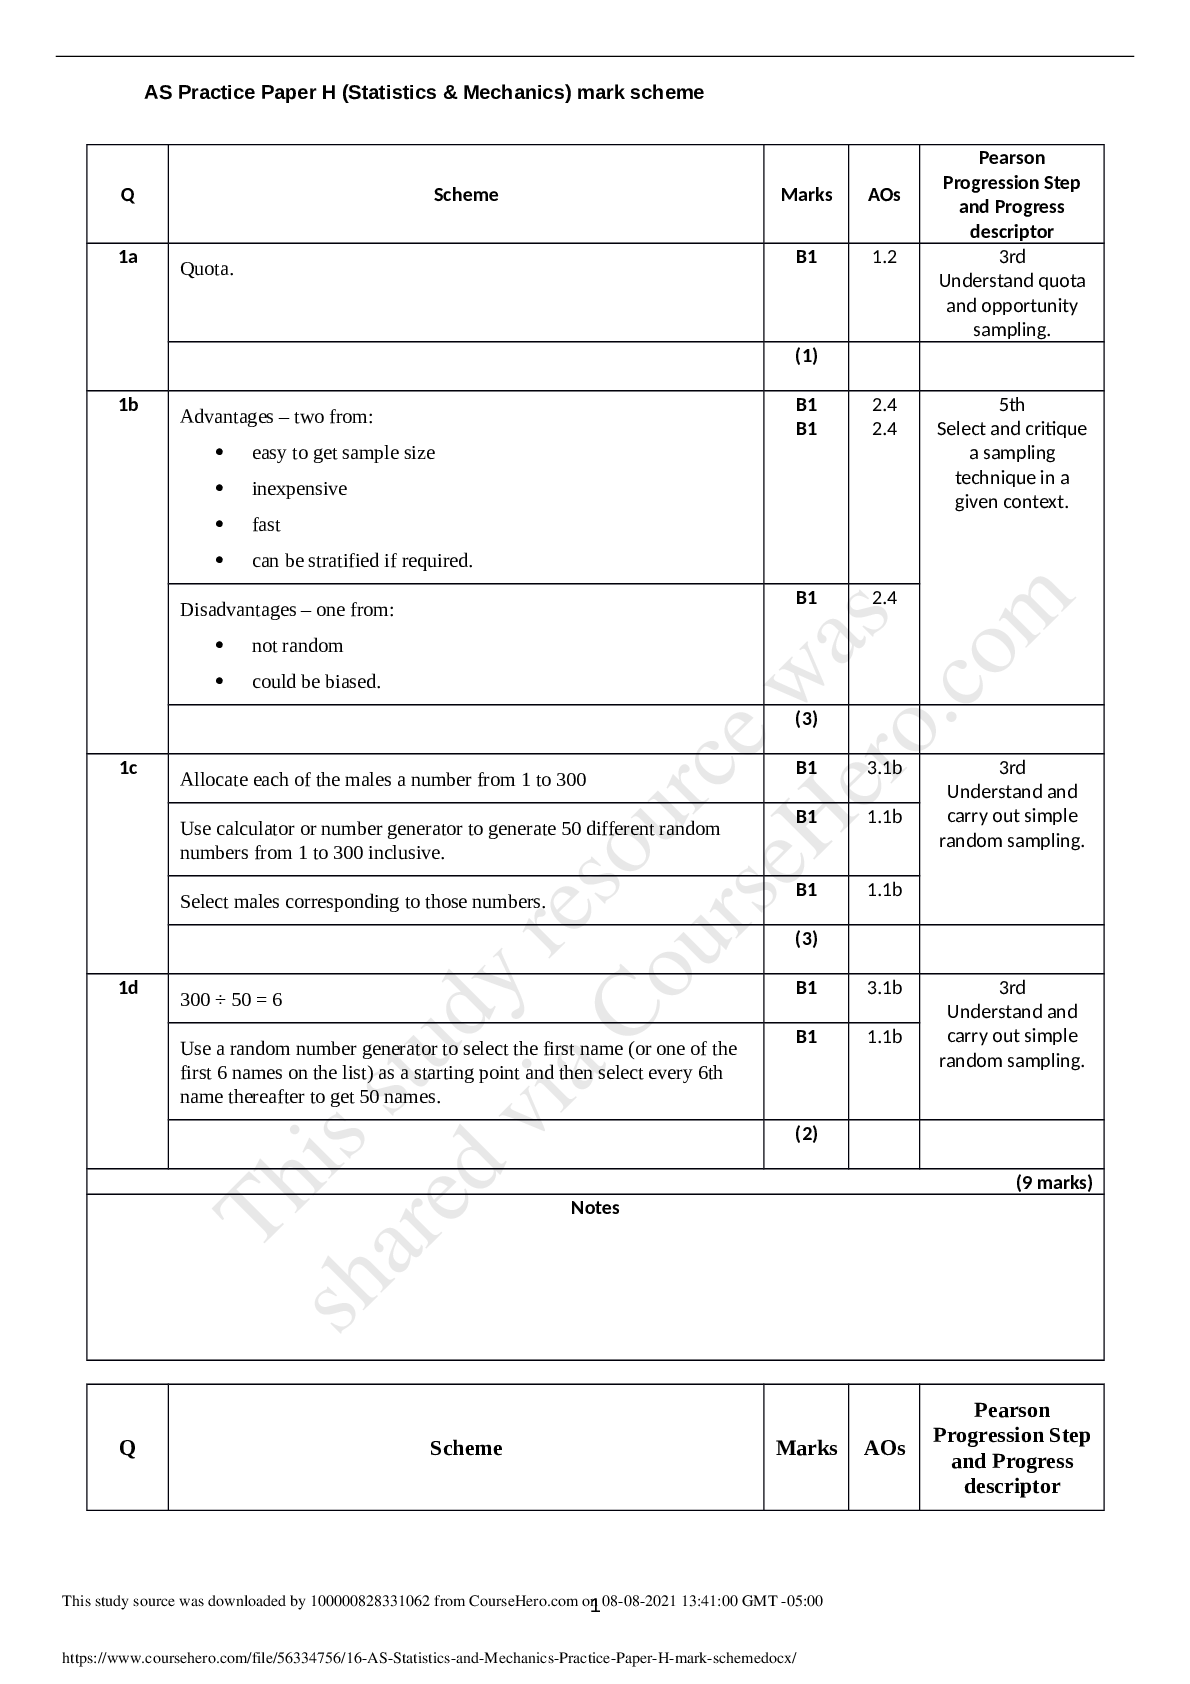
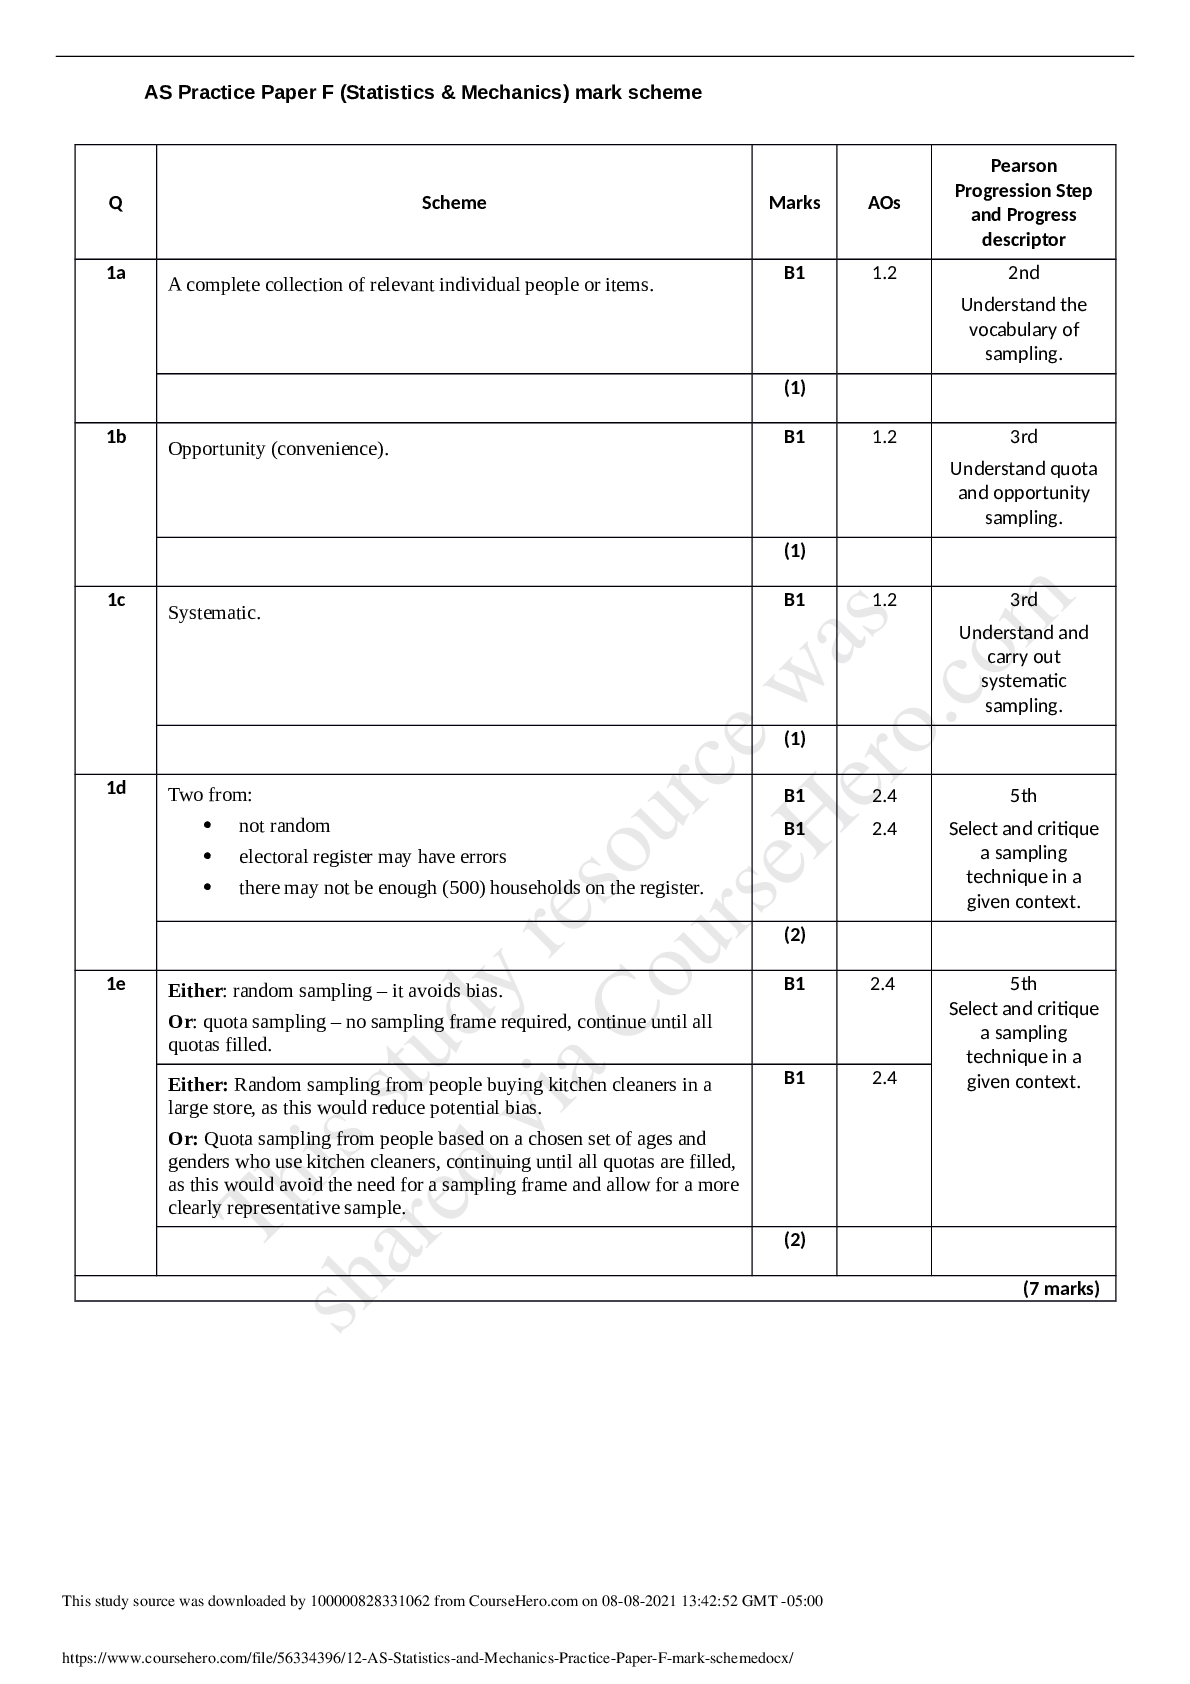
AS Practice Paper F (Statistics & Mechanics) mark scheme Q Scheme Marks AOs Pearson Progression Step and Progress descriptor 1a A complete collection of relevant individual people or items. B1 1... .2 2nd Understand the vocabulary of sampling. (1) 1b Opportunity (convenience). B1 1.2 3rd Understand quota and opportunity sampling. (1) 1c Systematic. B1 1.2 3rd Understand and carry out systematic sampling. (1) 1d Two from: not random electoral register may have errors there may not be enough (500) households on the register. B1 B1 2.4 2.4 5th Select and critique a sampling technique in a given context. (2) 1e Either: random sampling – it avoids bias. Or: quota sampling – no sampling frame required, continue until all quotas filled. B1 2.4 5th Select and critique a sampling technique in a Either: Random sampling from people buying kitchen cleaners in a given context. large store, as this would reduce potential bias. Or: Quota sampling from people based on a chosen set of ages and genders who use kitchen cleaners, continuing until all quotas are filled, as this would avoid the need for a sampling frame and allow for a more clearly representative sample. B1 2.4 (2) (7 marks) This study source was downloaded by 100000818171864 from CourseHero.com on 06-25-2021 04:20:41 GMT -05:00 https://www.coursehero.com/file/56334396/12-AS-Statistics-and-Mechanics-Practice-Paper-F-mark-schemedocx/ This study resource was shared via CourseHero.comAS Practice Paper F (Statistics & Mechanics) mark scheme Q Scheme Marks AOs Pearson Progression Step and Progress descriptor 2a Tree (both sections) and labels 0.85, 0.15 0.03, 0.97, 0.06, 0.94 B1 B1 B1 3.1a 1.1b 1.1b 2nd Draw and use simple tree diagrams with two branches and two levels. (3) 2b P(Not faulty) = (0.85 × 0.97) + (0.15 × 0.94) = 0.9655 M1 M1dep A1 3.4 1.1b 1.1b 2nd Draw and use simple tree diagrams with two branches and two levels. (3) (6 marks) Notes 2b M1 for either 0.85 × 0.97 or 0.15 × 0.94 (ft from their tree diagram) and M1 (dep) for adding two such probabilities (allow one error). This study source was downloaded by 100000818171864 from CourseHero.com on 06-25-2021 04:20:41 GMT -05:00 https://www.coursehero.com/file/56334396/12-AS-Statistics-and-Mechanics-Practice-Paper-F-mark-schemedocx/ This study resource was shared via CourseHero.comAS Practice Paper F (Statistics & Mechanics) mark scheme Q Scheme Marks AOs Pearson Progression Step and Progress descriptor 3 Three comparisons in context: For example: Very much warmer in Beijing than Perth. Both consistent in the temperatures. Less rainfall in Beijing. Less likely to have high rainfall in Beijing. Rainfall in Beijing is consistently less than in Perth. Evidence of use of a statistic from the boxplots: For example: Medians Measure of a difference in medians Mention of a particular outlier B3 B1 2.4 2.4 4th Compare data sets using a range of familiar calculations and diagrams. For accurately reading data from boxplots. B1 2.4 (5) (5 marks) Notes This study source was downloaded by 100000818171864 from CourseHero.com on 06-25-2021 04:20:41 GMT -05:00 https://www.coursehero.com/file/56334396/12-AS-Statistics-and-Mechanics-Practice-Paper-F-mark-schemedocx/ This study resource was shared via CourseHero.comAS Practice Paper F (Statistics & Mechanics) mark scheme Q Scheme Marks AOs Pearson Progression Step and Progress descriptor 4a X ~ B(15, 0.5) B1 for binomial B1 for 15 and 0.5 B1 B1 3.1b 3.1b 5th Understand the binomial distribution (and its notation) and its use as a model. (2) 4bi from calculator P(X = 8) = 0.19638… M1 A1 3.4 1.1b 5th Calculate binomial probabilities. (2) 4bii P(X … 4) = 1 – P(X „ 3) = 1 – 0.0176 M1 3.4 6th Use statistical tables and calculators to find cumulative binomial probabilities. = awrt 0.982 or 503 512 A1 1.1b (2) (6 marks) Notes 4bi P(X = 8) = P(X …8) – P(X „ 7) = 0.6964 – 0.5 or 15! 8!7! 0.58 (1- 0.5) 7 or 15C8´0.58 ´0.57 or 6435´0.515 = awrt 0.196 or 6435 32768 This study source was downloaded by 100000818171864 from CourseHero.com on 06-25-2021 04:20:41 GMT -05:00 https://www.coursehero.com/file/56334396/12-AS-Statistics-and-Mechanics-Practice-Paper-F-mark-schemedocx/ This study resource was shared via CourseHero.comAS Practice Paper F (Statistics & Mechanics) mark scheme Q Scheme Marks AOs Pearson Progression Step and Progress descriptor 5a P(X ⩽ 1) = 0.0076 and P (X ⩽ 2) = 0.0355 M1 1.1b 5th Find critical values and critical regions for a binomial distribution. P(X ⩾ 10) = 1 – 0.9520 = 0.0480 and P(X ⩾ 11) = 1 – 0.9829 = 0.0171 A1 1.1b Critical region is X ⩽ 1 11 ⩽ X (⩽ 20) A1 1.1b (3) 5b Significance level = 0.0076 + 0.0171 = 0.0247 or 2.47% B1 1.1b 6th Calculate actual significance levels for a binomial distribution test. (1) 5c Not in critical region therefore insufficient evidence to reject H0. B1 2.2b 6th Interpret the results of a binomial distribution test in context. There is insufficient evidence at the 5% level to suggest that the value of p is not 0.3. B1 3.2a (2) (6 marks) Notes 5c Conclusion must contain context and non-assertive for first B1. This study source was downloaded by 100000818171864 from CourseHero.com on 06-25-2021 04:20:41 GMT -05:00 https://www.coursehero.com/file/56334396/12-AS-Statistics-and-Mechanics-Practice-Paper-F-mark-schemedocx/ This study resource was shared via CourseHero.comAS Practice Paper F (Statistics & Mechanics) mark scheme Q Scheme Marks AOs Pearson Progression Step and Progress descriptor 6a Makes an attempt to find the distance from A to B. For example, 2 2 - 28 80 is seen. M1 3.1b 4th Find the magnitude and direction of a Makes an attempt to find the distance from vector quantity. B to C. For example, 2 2 130 15 is seen. M1 3.1b Demonstrates an understanding that these two values need to be added. For example, 84.75… + 130.86… is seen. M1 1.1b 215.62… (m) Accept anything which rounds to 216 (m) A1 1.1b (4) 6b States that AC 102 95 i j (m) Award one point for each value. B2 3.1b 4th Find the magnitude and direction of a vector quantity. States or implies that 95 tan 102 M1 1.1b Finds 42.96... Accept awrt 43.0° A1 1.1b (4) (8 marks) Notes This study source was downloaded by 100000818171864 from CourseHero.com on 06-25-2021 04:20:41 GMT -05:00 https://www.coursehero.com/file/56334396/12-AS-Statistics-and-Mechanics-Practice-Paper-F-mark-schemedocx/ This study resource was shared via CourseHero.comAS Practice Paper F (Statistics & Mechanics) mark scheme Q Scheme Marks AOs Pearson Progression Step and Progress descriptor 7a Velocity = acceleration × time seen or implied. M1 3.1b 4th Use and interpret graphs of velocity against time. Velocity = 11 × 8 = 88 m s−1 A1 1.1b Figure 2 General shape of the graph is correct. i.e. positive gradient, followed by horizontal line, followed by negative gradient not returning to zero. M1 3.3 Vertical axis labelled correctly. A1 1.1b Horizontal axis labelled correctly. A1 1.1b (5) 7b Makes an attempt to find the area of the trapezoidal section. For example, 1 2 88 40 2 ´ is seen. M1 1.1b 4th Calculate and interpret areas under velocity– Demonstrates an understanding that the three areas must total time graphs. 1404. For example, 1 1 8 88 88 2 88 40 1404 2 2 ´ ´ T or 352 88 128 1404 T is seen. M1 2.1 Correctly solves to find T = 10.5 (s). A1 1.1b (3) (8 marks) Notes 7a Accept the horizontal axis labelled with the correct intervals. 7b Award full marks for correct final answer, even if some work is missing. This study source was downloaded by 100000818171864 from CourseHero.com on 06-25-2021 04:20:41 GMT -05:00 https://www.coursehero.com/file/56334396/12-AS-Statistics-and-Mechanics-Practice-Paper-F-mark-schemedocx/ This study resource was shared via CourseHero.comAS Practice Paper F (Statistics & Mechanics) mark scheme Q Scheme Marks AOs Pearson Progression Step and Progress descriptor 8a Either states that 10 tan30 a or tan 60 10 a M1 1.1b 5th Use Newton’s second law to model motion in two directions. Correctly find a 10 3 M1 1.1b Interprets a in the context of the question, stating a - 10 3 A1 3.2 (3) 8b States that the magnitude of 2 2 R - 10 3 10 M1 1.1b 5th Use Newton’s second law to model motion in two directions. States R = 20 (N). A1 ft 1.1b (2) 8c States F = ma or implies use of F = ma. For example 20 = 6 × a is seen. M1 3.3 5th Use Newton’s second law to model motion in Correctly finds two directions. 10 3 a m s−2 . A1 ft 1.1b (2) 8d States that 1 2 2 s ut at or implies it use by writing 1 10 2 640 (0) 2 3 ´ ´ t t M1 3.1b 5th Use Newton’s second law to model motion in two directions. Solves to find t 8 6 (s). Accept awrt 19.6 (s). A1 ft 1.1b (2) (9 marks) Notes 8b Award ft marks for a correct answer using their value from part a for the i component of the force. 8c Award ft marks for a correct answer using their value from part b for the resultant force. 8d Award ft marks for a correct answer using their value from part c for the acceleration. This study source was downloaded by 100000818171864 from CourseHero.com on 06-25-2021 04:20:41 GMT -05:00 https://www.coursehero.com/file/56334396/12-AS-Statistics-and-Mechanics-Practice-Paper-F-mark-schemedocx/ This study resource was shared via CourseHero.comAS Practice Paper F (Statistics & Mechanics) mark scheme Q Scheme Marks AOs Pearson Progression Step and Progress descriptor 9 t = 5, v = 0 B1 1.1b 6th Uses differentiation to solve problems in kinematics. Expands brackets and attempts differentiation. Reducing any power by one is sufficient evidence of differentiation. M1 3.1b Solves 2 25 20 3 0 - t t to find t = 5 . 3 The expression can be factorised, or the quadratic formula can be used. t = 5 does not have to be seen to award the mark. A1 1.1b Makes an attempt to substitute t = 5 3 into 1 2 5 . 20 v t t - For example, 2 1 5 10 20 3 3 v is seen. M1 2.2a Correctly finds 25 27 v or 0.92… (m s−1). Accept awrt 0.9 (m s−1). A1 f 1.1b (5) (7 marks) Notes 9 Award the final method mark and the final accuracy mark for a correct substitution using their value for t. This study source was downloaded by 100000818171864 from CourseHero.com on 06-25-2021 04:20:41 GMT -05:00 https://www.coursehero.com/file/56334396/12-AS-Statistics-and-Mechanics-Practice-Paper-F-mark-schemedocx/ This study resource was shared via CourseHero.com Powered by TCPDF (www.tcpdf.org [Show More]
Last updated: 1 year ago
Preview 1 out of 9 pages
Buy this document to get the full access instantly
Instant Download Access after purchase
Add to cartInstant download
We Accept:

Reviews( 0 )
$11.00
Document information
Connected school, study & course
About the document
Uploaded On
Jun 25, 2021
Number of pages
9
Written in

Additional information
This document has been written for:
Uploaded
Jun 25, 2021
Downloads
0
Views
85