Statistics > EXAM > STAT 200 Week 3 Homework Problems,100% CORRECT (All)
STAT 200 Week 3 Homework Problems,100% CORRECT
Document Content and Description Below
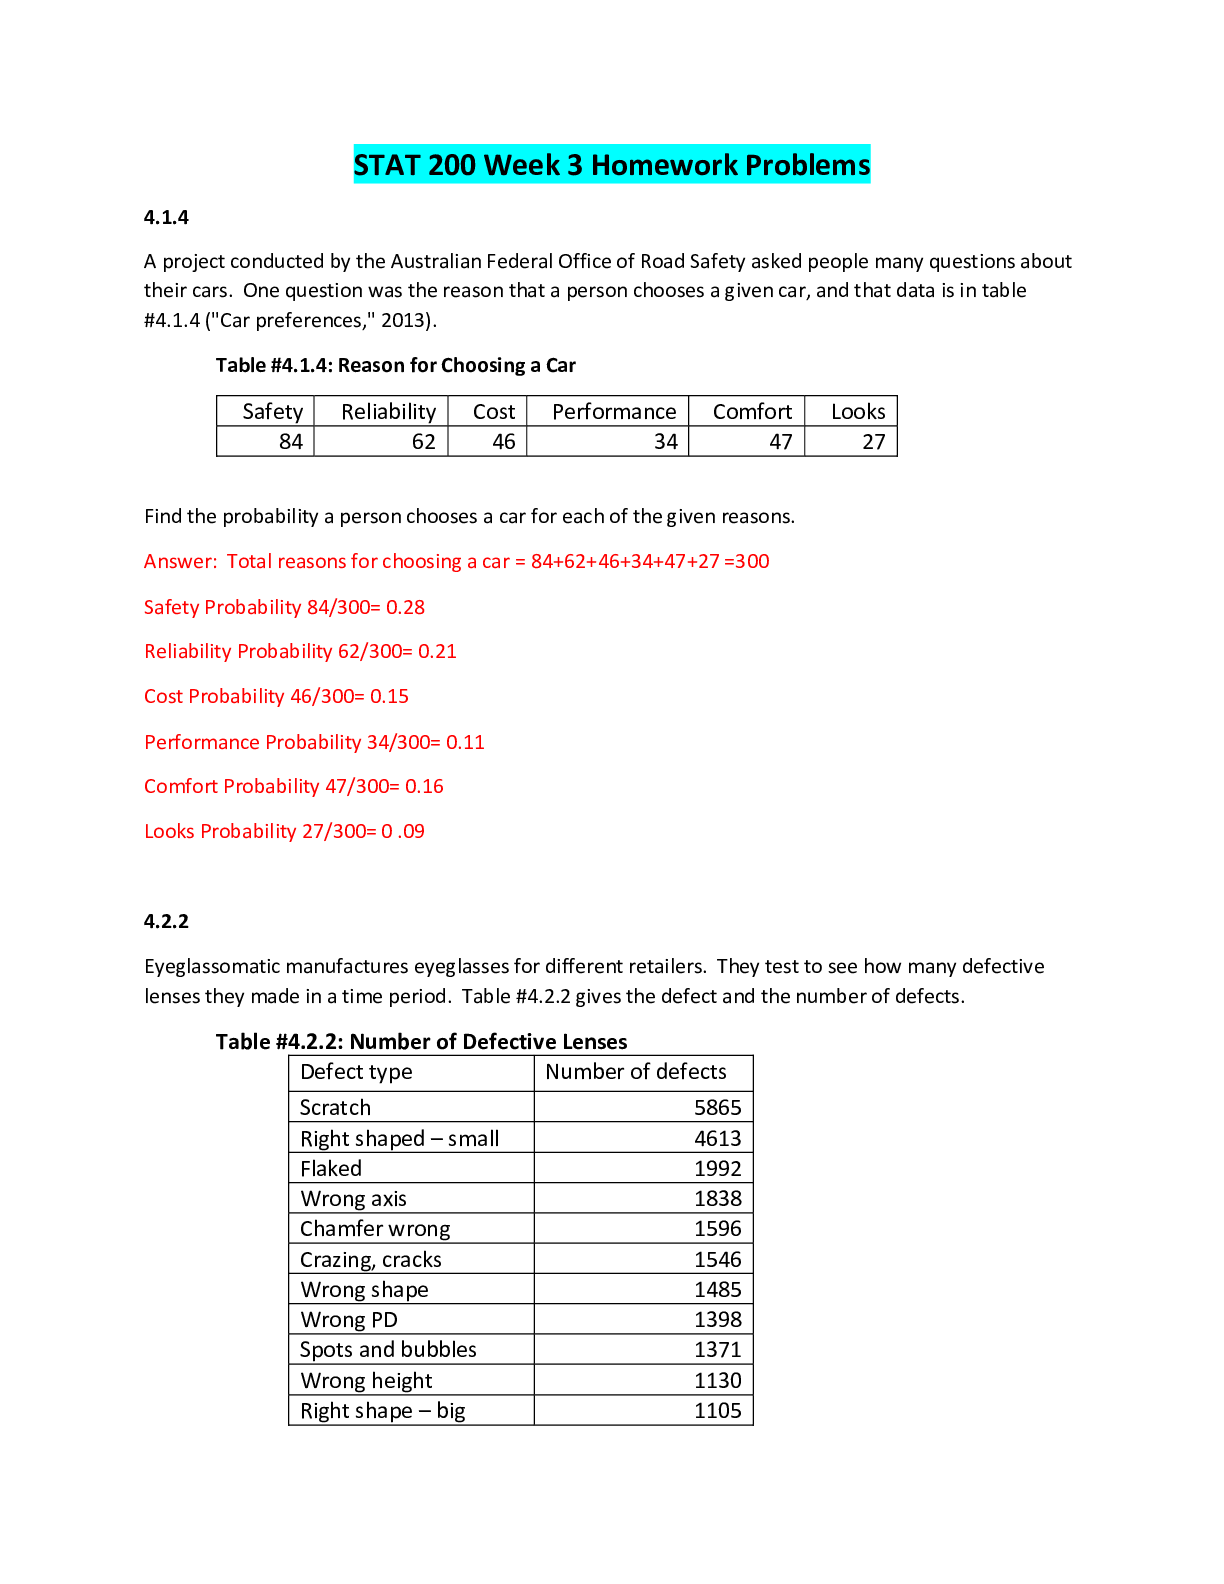
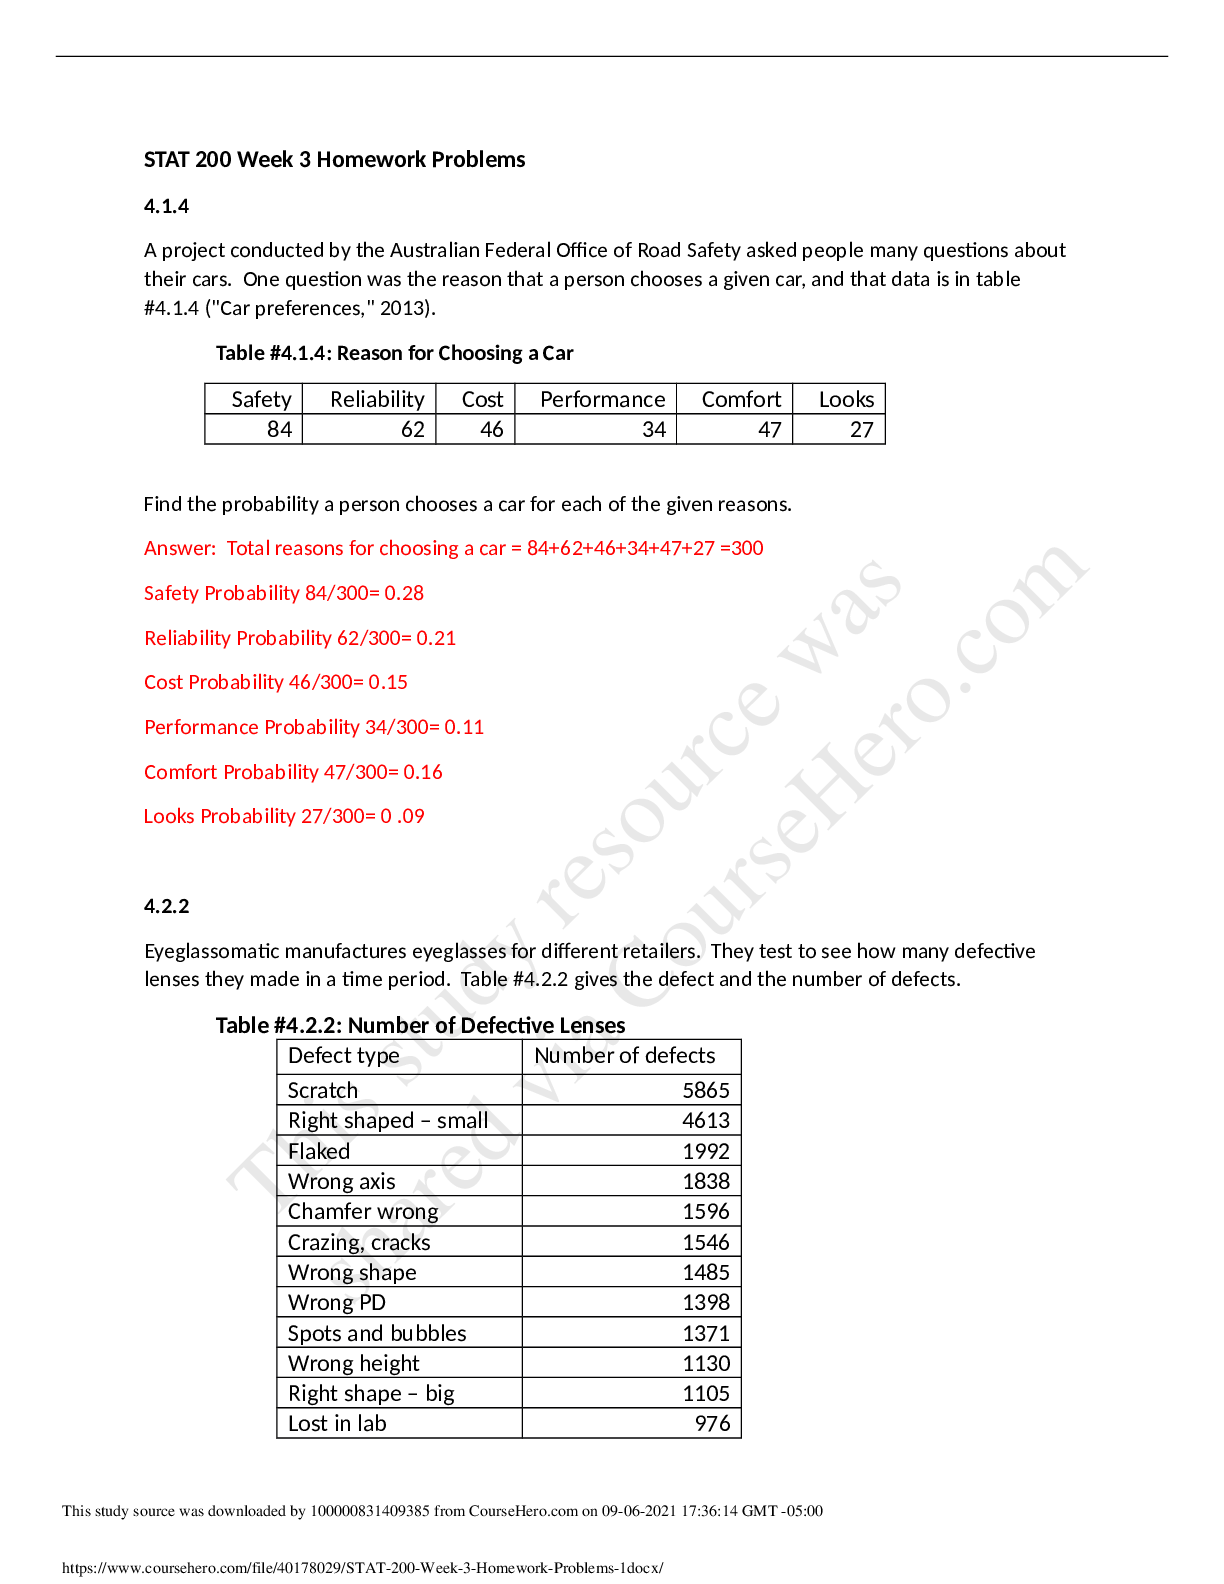
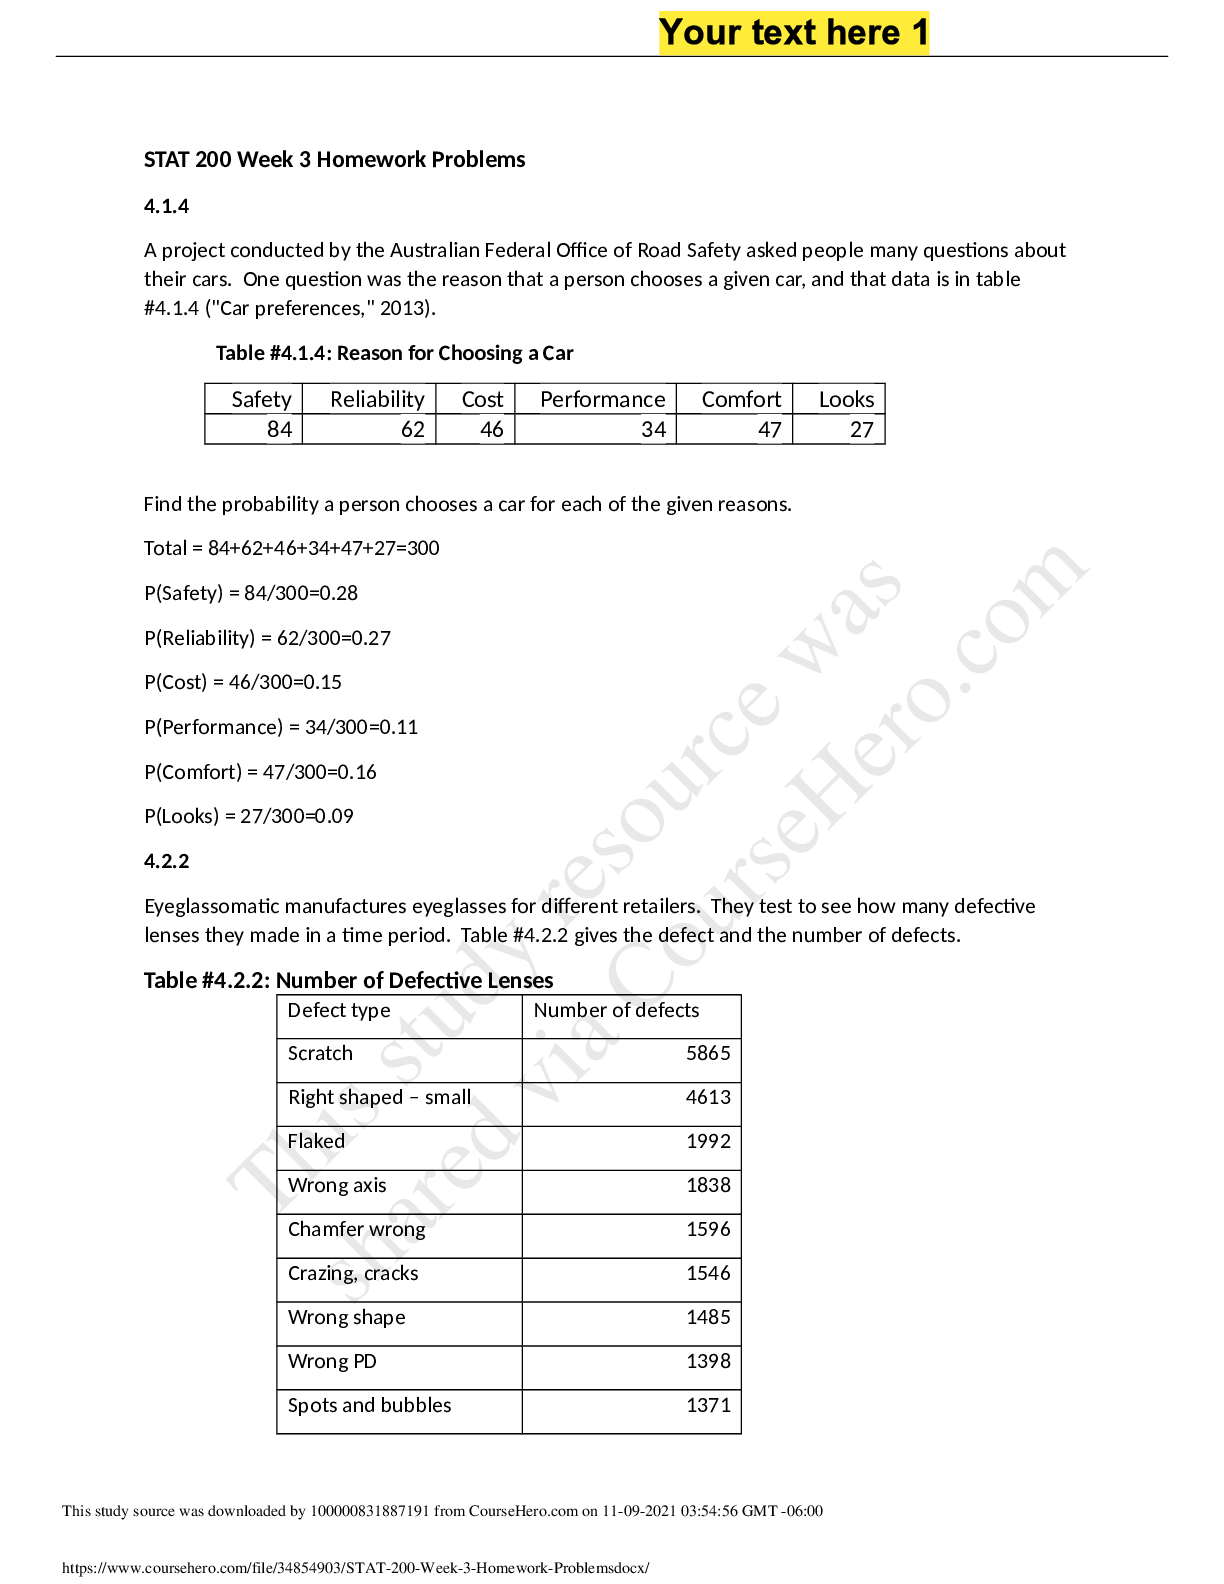
STAT 200 Week 3 Homework Problems 4.1.4 A project conducted by the Australian Federal Office of Road Safety asked people many questions about their cars. One question was the reason that a person ch... ooses a given car, and that data is in table #4.1.4 ("Car preferences," 2013). Table #4.1.4: Reason for Choosing a Car Safety Reliability Cost Performance Comfort Looks 84 62 46 34 47 27 Find the probability a person chooses a car for each of the given reasons. Total = 84+62+46+34+47+27=300 P(Safety) = 84/300=0.28 P(Reliability) = 62/300=0.27 P(Cost) = 46/300=0.15 P(Performance) = 34/300=0.11 P(Comfort) = 47/300=0.16 P(Looks) = 27/300=0.09 4.2.2 Eyeglassomatic manufactures eyeglasses for different retailers. They test to see how many defective lenses they made in a time period. Table #4.2.2 gives the defect and the number of defects. Table #4.2.2: Number of Defective Lenses Defect type Number of defects Scratch 5865 Right shaped – small 4613 Flaked 1992 Wrong axis 1838 Chamfer wrong 1596 Crazing, cracks 1546 Wrong shape 1485 Wrong PD 1398 Spots and bubbles 1371 Wrong height 1130 Right shape – big 1105 Lost in lab 976 Spots/bubble – intern 976 a.) Find the probability of picking a lens that is scratched or flaked. Scratch + Flaked = 5865+1992=7857 7857/25891=0.303 b.) Find the probability of picking a lens that is the wrong PD or was lost in lab. Wrong PD + Lost in lab = 1398+976=2374 2374/25891=0.091 c.) Find the probability of picking a lens that is not scratched. P(Scratch) = 5865/25891=0.227 P(Not scratch) = 1-0.227=0.773 d.) Find the probability of picking a lens that is not the wrong shape. P(Wrong shape) = 1485/25891=0.057 P(Not wrong shape) = 1-0.057=0.943 4.2.8 In the game of roulette, there is a wheel with spaces marked 0 through 36 and a space marked 00. a.) Find the probability of winning if you pick the number 7 and it comes up on the wheel. P(7)= 1/38=0.026 b.) Find the odds against winning if you pick the number 7. P(Not 7)= 37/38=0.974 Odds against 7 = P(Not 7)/P(7) = 37/38 / 1/38 = 37:1 c.) The casino will pay you $20 for every dollar you bet if your number comes up. How much profit is the casino making on the bet? The actual odds is 37:1, meaning the casino would pay $37 on every $1 bet. The casino actually pays $20 for every $1 bet. Therefore, the profit is $37-$20=$17 4.4.6 Find = 10!/(10-6)! = 10!/4! = 151200 4.4.12 How many ways can you choose seven people from a group of twenty? n=20 r=7 20C7 = 20!/(7!(20-7)! = 20!/(7!x13!) = 77520 5.1.2 Suppose you have an experiment where you flip a coin three times. You then count the number of heads. a.) State the random variable. x=number of heads. b.) Write the probability distribution for the number of heads. 7 successful trials out of 8 total. P(X=1) = 0.000003337860107421875 P(X=2) = 0.00008177757263183594 P(X=3) = 0.0011448860168457031 P(X=4) = 0.010017752647399902 P(X=5) = 0.05609941482543945 P(X=6) = 0.19634795188903809 P(X=7) = 0.39269590377807617 c.) Draw a histogram for the number of heads. d.) Find the mean number of heads. Mean = 7*(⅞) = 6.125 e.) Find the variance for the number of heads. Variance = 7*0.875*0.125 = 0.766 f.) Find the standard deviation for the number of heads. Standard Deviation = √0.766 = 0.875 g.) Find the probability of having two or more number of heads. P(x≥2)-P(x=8)=P(x=2)+P(x=3)+P(x=4)+P(x=5)+P(x=6)+P(x=7)-P(x=8) = 0.656 - 0.344 = 0.312 h.) Is it unusual to flip two heads? P(x≤2)=P(x=2)+P(x=1) = 0.0002 Yes, it is unusual. 5.1.4 An LG Dishwasher, which costs $800, has a 20% chance of needing to be replaced in the first 2 years of purchase. A two-year extended warrantee costs $112.10 on a dishwasher. What is the expected value of the extended warranty assuming it is replaced in the first 2 years? Chances to be replaced = 20% chances not to be replaced = 80% EV = 0.20*800 + 0.80*0 EV= 160 5.2.4 Suppose a random variable, x, arises from a binomial experiment. If n = 6, and p = 0.30, find the following probabilities using technology. a.) = 6C1*(0.30^1){0.70^(6-1)} = [6!/{1!(6-1)!}]*0.30*(0.70^5) = [6!/5!]*0.30*0.17 = 6*0.30*0.17 = 0.306 b.) =6C5*(0.30^5){0.70^(6-5)} = [6!/{5!(6-5)!}]*0.002*0.70 = 6*0.002*0.70 = 0.008 c.) =6C3*(0.30^3){0.70^(6-3)} = [6!/{3!(6-3)!}]*0.027*0.343 = 20*0.027*0.343 =0.185 d.) = P(x=0)+P(x=1)+P(x=2)+P(x=3) =6C0*(0.30^0){0.70^(6-0)} + 0.306 + 6C2*(0.30^2){0.70^(6-2)} + 0.185 = 1*1*0.118 + 0.306 + 15*0.09*0.24 + 0.185 = 0.118 + 0.306 + 0.324 + 0.185 =0.993 e.) = P(x=5)+P(x=6) = 0.008 + 6C6*(0.30^6){0.70^(6-6)} = 0.008 + 1*0.001*1 = 0.008 + 0.001 = 0.009 f.) = P(x≤3)+P(x=4) = 0.993 + 6C4*(0.30^4){0.70^(6-4) = 0.993 + 15*0.008*0.49 = 0.993 + 0.059 = 1.052 5.2.10 The proportion of brown M&M’s in a milk chocolate packet is approximately 14% (Madison, 2013). Suppose a package of M&M’s typically contains 52 M&M’s. a.) State the random variable. x= number of brown M&M’s b.) Argue that this is a binomial experiment n=52 p=0.14 Find the probability that c.) Six M&M’s are brown. P(x=6)= 52C6*(0.14^6){0.86^(52-6)} = 20358520*0.00000753*0.00097035 = 0.149 d.) Twenty-five M&M’s are brown. P(x=25)= 52C25*(0.14^25){0.86^(52-25)} = 4.78E+14*4.50E-22*0.01703955245 =3.66E-09 e.) All of the M&M’s are brown. P(x=52)= 52C52*(0.14^52){0.86^(52-52)} = 1*3.97E-45*1 =3.97E-45 f.) Would it be unusual for a package to have only brown M&M’s? If this were to happen, what would you think is the reason? one major reason could of been human error. 5.3.4 Approximately 10% of all people are left-handed. Consider a grouping of fifteen people. a.) State the random variable. x = left handed people b.) Write the probability distribution. Calculation Taken from online calculator. P(X=0) = 0.8179069375972307 P(X=1) = 0.16523372476711728 P(X=2) = 0.01585576146755166 P(X=3) = 0.0009609552404576765 P(X=4) = 0.00004125312900954671 P(X=5) = 0.0000013334344730358534 P(X=6) = 3.367258770292559e-8 P(X=7) = 6.802542970287998e-10 P(X=8) = 1.1165790229008079e-11 P(X=9) = 1.50381013185294e-13 P(X=10) = 1.6709001465032665e-15 P(X=11) = 1.5343435688735235e-17 P(X=12) = 1.162381491570851e-19 P(X=13) = 7.225370576974987e-22 P(X=14) = 3.649177059078276e-24 P(X=15) = 1.4744149733649604e-26 P(X=16) = 4.654087668450001e-29 P(X=17) = 1.10614086e-31 P(X=18) = 1.8621900000000004e-34 P(X=19) = 1.9800000000000006e-37 P(X=20) = 1.0000000000000001e-40 c.) Draw a histogram. d.) Describe the shape of the histogram. The graph represents the chances that X will be equal that value. e.) Find the mean. Mean = 15*0.10 = 1.5 f.) Find the variance. q = 1 - 0.10 = 0.90 Variance = 15*0.10*0.90 = 1.35 g.) Find the standard deviation. Standard Deviation = √1.35 = 1.162 [Show More]
Last updated: 1 year ago
Preview 1 out of 12 pages
Instant download
Buy this document to get the full access instantly
Instant Download Access after purchase
Add to cartInstant download
Reviews( 0 )
Document information
Connected school, study & course
About the document
Uploaded On
Nov 15, 2021
Number of pages
12
Written in

Additional information
This document has been written for:
Uploaded
Nov 15, 2021
Downloads
0
Views
26