Economics > Dissertation > ECON 102 Final Exam Quizzes HW Lecture and Transcript. (All)
ECON 102 Final Exam Quizzes HW Lecture and Transcript.
Document Content and Description Below
ECON 102 Final Exam Quizzes HW Lecture and Transcript Submitted by ROBERTSON, KRISTI (KLR5625) on 4/10/2019 4:33:52 PM Points Awarded 10.00 Points Missed 0.00 Percentage 100% 1. Which two... industry structures are characterized by easy entry and exit? A) Perfect competition and monopolistic competition B) Oligopoly and monopoly. C) Oligopoly and monopolistic competition D) Perfect competition and monopoly E) Oligopoly and perfect competition Feedback: Assumptions made about the different industry structures Table for Individual Question Feedback 2. In monopolistic competition, A) there is only one firm. B) firms are large relative to the total market. C) firms are small relative to the total market. D) firms produce identical products. Feedback: Assumptions made about the different industry structures Table for Individual Question Feedback 1.0/1.0 C 3. Unlike a monopolist’s product, a monopolistically competitive firm’s product A) has many close substitutes B) has no close substitutes C) is homogeneous D) is unique Feedback: Firms in monopolistic competition produce differentiated products which are close substitutes for each other, Table for Individual Question Feedback 4. Which of the following industries is most similar to monopolistic competition? A) The pizza industry in State College B) The soft drink industry C) The wheat industry D) The steel industry Feedback: The pizza industry in State College has many firms that produce differentiated products. It is also easy to enter and exit the industry. Table for Individual Question Feedback 1.0/1.0 A 5. In a monopolistically competitive industry, in long run equilibrium A) firms produce at minimum average total cost and make zero economic profit. B) firms produce at greater than minimum average total cost and make positive economic profit. C) firms produce at greater than minimum average total cost and make zero economic profit. D) firms produce at minimum average total cost and make positive economic profit. Feedback: In long run equilibrium, firms make zero economic profit because of free entry and exit. However they do not produce at minimum average total cost. Table for Individual Question Feedback 1.0/1.0 C 6. For a monopolistically competitive firm, A) price is less than marginal revenue. B) price is equal to marginal revenue. C) price can be greater than or less than marginal revenue. D) price is greater than marginal revenue. Feedback: Since a monopolistically competitive firm faces a downward sloping demand curve, price is greater than marginal revenue. Table for Individual Question Feedback 1.0/1.0 D 7. A monopolistically competitive firm A) must lower price to sell more output. B) can change output, but cannot change price. C) can sell as much output as it wants at the market price. D) sells a fixed amount of output, regardless of price. Feedback: A monopolistically competitive firm faces a downward sloping demand curve, so it must lower price to sell more output. Table for Individual Question Feedback 1.0/1.0 A 8. Monopolistically competitive firms in long run equilibrium produce at _________ than the optimal scale. A) less than B) more than C) sometimes more and sometimes less than D) exactly Feedback: A monopolistically competitive firm in long run equilibrium will produce a quantity less than the quantity that minimizes ATC Table for Individual Question Feedback 1.0/1.0 A 9. Refer to the figure above. If this firm is monopolistically competitive, in order to maximize profit, it should charge a price of A) $10 B) $20 C) $23 D) $18 Feedback: The firm should produce where MR = MC, and charge as much as the demand curve will allow at that quantity. Table for Individual Question Feedback 1.0/1.0 C 10. Informative advertising A) is designed to change a consumer’s preferences and is usually associated with experience goods. B) is designed to change a consumer’s preferences and is usually associated with search goods. C) is designed to describe a product’s characteristics and is usually associated with search goods. D) is designed to describe a product’s characteristics and is usually associated with experience goods. Feedback: Informative advertising is designed to describe a product’s characteristics and is usually associated with search goods. Table for Individual Question Feedback 1.0/1.0 C Submitted by ROBERTSON, KRISTI (KLR5625) on 4/10/2016 4:19:47 PM Points Awarded 8.00 Points Missed 2.00 Percentage 80.0% 1. Which two industry structures are characterized by easy entry and exit? A) Perfect competition and monopoly B) Oligopoly and monopoly. C) Perfect competition and monopolistic competition D) Oligopoly and monopolistic competition E) Oligopoly and perfect competition Feedback: Assumptions made about the different industry structures Table for Individual Question Feedback 1.0/1.0 C 2. Monopolistic competition differs from perfect competition because A) there are barriers to entry in monopolistic competition B) firms can differentiate their products in perfect competition C) firms can differentiate their products in monopolistic competition D) there are no barriers to entry in monopolistic competition Feedback: Assumptions made about the different industry structures Table for Individual Question Feedback 1.0/1.0 C 3. Which of the following industries is most similar to monopolistic competition? A) The steel industry B) The wheat industry C) The soft drink industry D) The pizza industry in State College Feedback: The pizza industry in State College has many firms that produce differentiated products. It is also easy to enter and exit the industry. Table for Individual Question Feedback 0.0/1.0 D 4. A monopolistically competitive firm faces A) A perfectly elastic demand curve. B) A vertical demand curve. C) A horizontal demand curve. D) A downward sloping demand curve. Feedback: Because of product differentiation, if a monopolistically competitive firm raises its price, it will lose some, but not all of its customers. Table for Individual Question Feedback 1.0/1.0 D 5. For a monopolistically competitive firm, in long run equilibrium A) P > MR > MC B) P < MR = MC C) P = MR = MC D) P > MR = MC Feedback: Since a monopolistically competitive firm faces a downward sloping demand curve, price is greater than marginal revenue. Since the firm is maximizing profit in long run equilibrium, MR = MC. Table for Individual Question Feedback 1.0/1.0 D 6. Suppose a monopolistically competitive firm in the short run is selling 100 units of output at $10 each. At that level of output, MR = MC and marginal cost is rising. Also, ATC = $15, AVC = $12 and AFC = $3. This firm should A) increase output to the point where price equals marginal cost. B) decrease output to the point where marginal cost equals average total cost. C) shut down and produce 0 units of output. D) continue to produce 100 units of output since MR = MC. Feedback: Since P < AVC, the firm should shut down. Table for Individual Question Feedback 1.0/1.0 C 7. A monopolistically competitive firm A) sells a fixed amount of output, regardless of price. B) can sell as much output as it wants at the market price. C) can change output, but cannot change price. D) must lower price to sell more output. Feedback: A monopolistically competitive firm faces a downward sloping demand curve, so it must lower price to sell more output. Table for Individual Question Feedback 1.0/1.0 D 8. Compared to a perfectly competitive firm with the same costs, a monopolistically competitive firm produces _________ output and charges a _________ price. A) less; lower B) less; higher C) more; higher D) more; lower Feedback: A monopolistically competitive firm produces where MR = MC. Since P > MR, the firm produces less output and charges a higher price. Table for Individual Question Feedback 1.0/1.0 B 9. Refer to the figure above. If this firm is monopolistically competitive and is maximizing profit, its total revenue is A) $200 B) $460 C) $60 D) $400 Feedback: TR = P*Q Table for Individual Question Feedback 0.0/1.0 B 10. Informative advertising is usually associated with A) normal goods B) experience goods C) inferior goods D) search goods Feedback: Informative advertising describes a product’s characteristics. Table for Individual Question Feedback 1.0/1.0 D Submitted by ROBERTSON, KRISTI (KLR5625) on 4/16/2016 3:57:48 PM Points Awarded 10.00 Points Missed 0.00 Percentage 100% 1. Suppose that two players are playing the following game. Player 1 can choose either Top or Bottom, and Player 2 can choose either Left or Right. The payoffs are given in the following table: where the number on the left is the payoff to Player A, and the number on the right is the payoff to Player B. Player A has _____________________, and player B has ___________________ Player B Player A Left Right Top 4 2 2 3 Bottom 3 3 1 4 A) None of these B) no dominant strategy; a dominant strategy to play Left. C) a dominant strategy to play Top; a dominant strategy to play Right. D) no dominant strategy; a dominant strategy to play Right E) a dominant strategy to play Bottom; no dominant strategy. Feedback: Definition of dominant strategy. Table for Individual Question Feedback 1.0/1.0 C 2. Suppose that two players are playing the following game. Player 1 can choose either Top or Bottom, and Player 2 can choose either Left or Right. The payoffs are given in the following table: where the number on the left is the payoff to Player A, and the number on the right is the payoff to Player B. The Nash Equilibrium in pure strategies in this game is Player B Player A Left Right Top 4 2 2 3 Bottom 3 5 4 2 A) Bottom/Right B) Top/Left C) Top/Right D) Bottom/Left E) None of these Feedback: Definition of Nash Equilibrium. Table for Individual Question Feedback 1.0/1.0 E 3. Suppose that two players are playing the following game. Player 1 can choose either Top or Bottom, and Player 2 can choose either Left or Right. The payoffs are given in the following table: where the number on the left is the payoff to Player A, and the number on the right is the payoff to Player B. If each player plays their maximin strategy, the outcome of the game will be Player B Player A Left Right Top 8 4 0 5 Bottom 3 3 1 2 A) Bottom/Right B) Top/Left C) Top/Right D) Bottom/Left Feedback: Definition of maximin strategy. Table for Individual Question Feedback 1.0/1.0 D 4. Refer to the Game Tree above: If both players are trying to maximize their own payoffs, the likely outcome of this game is that A) Tracy gets 100 and Amy gets 175. B) Tracy gets 500 and Amy gets 150. C) Tracy gets 175 and Amy gets 130. D) Tracy gets 275 and Amy gets 140. Feedback: Use Backward Induction. Table for Individual Question Feedback 1.0/1.0 D 5. Which of the following industries is NOT an oligopoly? A) US Soft Drink Industry B) US Wheat Industry C) US Airline Industry D) US Automobile Industry Feedback: Definition of oligopoly. Table for Individual Question Feedback 1.0/1.0 B 6. Which of the following industries is NOT an oligopoly? A) US Soft Drink Industry B) US Corn Industry C) US Beer Industry D) US Fast Food Industry Feedback: Definition of oligopoly. Table for Individual Question Feedback 1.0/1.0 B 7. Mergers that substantially reduce competition are outlawed by the A) Sherman Act B) None of these C) Clayton Act D) Federal Trade Commission Act Feedback: The Clayton Act outlaws tying contracts, mergers, and price discrimination that substantially lessen competition. Table for Individual Question Feedback 1.0/1.0 C 8. Suppose an industry has 4 firms each with 15% of sales, and 8 firms each with 5% of sales. The HHI for this industry is A) 100 B) 900 C) None of these D) 800 E) 1100 Feedback: The HHI is calculated as the sum of the squares of the percentage of sales by each firm in the industry. Table for Individual Question Feedback 1.0/1.0 E 9. Suppose there are 6 firms in an industry and they each have total sales given in the table below. The 4-firm concentration ratio for this industry is Firm Total Sales 1 $20 million 2 $15 million 3 $15 million 4 $10 million 5 $8 million 6 $7 million A) .80 B) .75 C) None of these D) .20 E) .60 Feedback: The 4 firm concentration ratio is the sum of the total sales of the 4 largest firms divided by the total sales in the industry Table for Individual Question Feedback 1.0/1.0 A 10. In the Cournot Model of Oligopoly, A) price is higher than the monopoly price B) price is lower than the monopoly price, but higher than the perfectly competitive price C) price equals the perfectly competitive price D) price is lower than the perfectly competitive price Feedback: Price is between the monopoly price and the perfectly competitive price Table for Individual Question Feedback 1.0/1.0 B Submitted by ROBERTSON, KRISTI (KLR5625) on 4/20/2016 7:00:23 PM Points Awarded 10.00 Points Missed 0.00 Percentage 100% 1. When a paper manufacturer emits pollution levels above the socially efficient level, we can conclude that the manufacturer A) is not maximizing profit B) pays the entire cost of producing the paper. C) does not pay the entire cost of producing the paper. D) pays a tax equal to the negative externality that paper manufacturing produces Feedback: When a negative production externality exists, the firm does not bear the full social cost of production, the firm only pays the private cost of production. Table for Individual Question Feedback 1.0/1.0 C 2. A profit maximizing competitive firm in a market with NO externalities will produce the quantity of output where A) marginal benefit = marginal cost B) all of these are true C) price = marginal cost D) marginal revenue = marginal cost Feedback: All of the conditions listed describe competitive equilibrium. Table for Individual Question Feedback 1.0/1.0 B 3. Consider the graph above. If this market is currently producing an output level of Q2, total economic surplus would increase if A) production decreased to Q1 B) production increased to Q3 C) economic surplus is already maximized at Q2, so changing the output level would only decrease total economic surplus D) production decreased to Q0 Feedback: The optimal production point occurs where MSC=MB, this is where total economic surplus is maximized. Table for Individual Question Feedback 1.0/1.0 A 4. A positive externality can be internalized via A) subsidies B) taxes C) pollution permits D) all of these are true Feedback: Subsidies are often used to internalize positive externalities. Table for Individual Question Feedback 1.0/1.0 A 5. Which of the following is a solution to the problem of externalities? A) regulation B) sale of the right to impose externalities C) private bargaining D) all of these are potential solutions to externalities Feedback: Each choice listed can potentially be used to eliminate the effects of externalities. Table for Individual Question Feedback 1.0/1.0 D 6. The Coase theorem states that when externalities are present, under certain conditions A) private parties will hold out for a better deal, making achieving the efficient outcome impossible B) private parties can never achieve an efficient outcome C) private parties can achieve the efficient outcome without government intervention D) private parties can achieve the efficient outcome if there is government intervention Feedback: Under the Coase theorem, private parties may be able to achieve the efficient outcome without assistance from the government. Table for Individual Question Feedback 1.0/1.0 C 7. Private goods are A) exclusive B) non-rival C) non-rival and non-excludable D) rival and excludable Feedback: Private goods are both rival and excludable. Table for Individual Question Feedback 1.0/1.0 D 8. Quantity of the public good Willingness to pay of person 1 Willingness to pay of person 2 1 100 55 2 90 50 3 80 45 4 70 40 5 60 35 Consider the table above. If you use this information to construct the market demand curve for this public good, a point on the market demand would be A) 1, $100 B) 2, $140 C) 3, $80 D) 4, $40 Feedback: The market demand for a public good is the vertical summation of all of the individual demands for that good. Table for Individual Question Feedback 1.0/1.0 B 9. Quantity of the public good Willingness to pay of person 1 Willingness to pay of person 2 1 100 55 2 90 50 3 80 45 4 70 40 5 60 35 Consider the table above. How much is society willing to spend on a total of 3 units of this public good? A) $155 B) $420 C) $90 D) $530 Feedback: The total amount society is willing to pay for all 3 units of the public good is the market willingness to pay at Q= 1 plus the market willingness to pay at Q=2 plus the market willingness to pay at Q=3. Table for Individual Question Feedback 1.0/1.0 B 10. A person that has many health problems or a high risk of developing many health problems is likely to buy a lot of health insurance. This situation is an example of A) the impossibility theorem B) adverse selection C) the Tiebout hypothesis D) moral hazard Feedback: In this situation the person buying insurance has more information than the seller of the insurance. Table for Individual Question Feedback 1.0/1.0 B Submitted by ROBERTSON, KRISTI (KLR5625) on 4/29/2016 10:01:09 PM Points Awarded 5.00 Points Missed 5.00 Percentage 50.0% 1. Suppose the demand for a product is given by P = 100 – 2Q. Also, the supply is given by P = 20 + 6Q. If an $8 per-unit excise tax is levied on the buyers of a good, then after the tax buyers will pay _________ for each unit of the good. A) None of these B) $82 C) $9 D) $74 E) $80 Feedback: The demand curve will shift down by an amount exactly equal to the tax. This allows you to find the equation for the new demand curve. The buyers will pay a price equal to the new equilibrium price plus the tax. Table for Individual Question Feedback 0.0/1.0 B 2. Suppose the demand for a product is given by P = 100 – 2Q. Also, the supply is given by P = 20 + 6Q. If an $8 per-unit excise tax is levied on the buyers of a good, then after the tax the sellers will receive _________ for each unit of the good. A) None of these B) $74 C) $9 D) $80 E) $82 Feedback: The demand curve will shift down by an amount exactly equal to the tax. This allows you to find the equation for the new demand curve. The sellers will receive a price equal to the new equilibrium price. Table for Individual Question Feedback 0.0/1.0 B 3. Suppose the demand for a product is given by P = 30 – 3Q. Also, the supply is given by P = 10 + Q. If a $4 per-unit excise tax is levied on the buyers of a good, what proportion of the tax will be paid by the buyers? A) 40% B) None of these C) 20% D) 0% E) 25% Feedback: The proportion of the tax paid by buyers depends on the relative price elasticities of supply and demand. Table for Individual Question Feedback 0.0/1.0 B 4. Suppose the demand for a product is given by P = 30 – 2Q. Also, the supply is given by P = 5 + 3Q. If a $5 per-unit excise tax is levied on the buyers of a good, the deadweight loss created by this tax will be A) $5 B) $16 C) $2.50 D) $4 E) None of these Feedback: The deadweight loss is the difference between total surplus without the tax and total surplus with the tax. Table for Individual Question Feedback 1.0/1.0 C 5. Suppose the demand for a product is given by P = 40 – 4Q. Also, the supply is given by P = 10 + Q. If a $10 per-unit excise tax is levied on the buyers of a good, consumer surplus is equal to A) None of these B) $10 C) $64 D) $8 E) $32 Feedback: Consumer surplus is the area under the demand curve and above the price that the consumer pays. Table for Individual Question Feedback 1.0/1.0 E 6. Suppose the demand for a product is given by P = 30 – 2Q. Also, the supply is given by P = 5 + 3Q. If a $5 per-unit excise tax is levied on the buyers of a good, after the tax, producer surplus is equal to A) $25 B) None of these C) $64 D) $24 E) $20 Feedback: Producer surplus is the area under the price that producers receive, and above the supply curve. Table for Individual Question Feedback 1.0/1.0 D 7. Suppose the demand for a product is given by P = 40 – 4Q. Also, the supply is given by P = 10 + Q. If a $10 per-unit excise tax is levied on the buyers of a good, government revenue is equal to A) $32 B) None of these C) $64 D) $8 E) $10 Feedback: Government revenue equals the amount of the tax times the number of units sold after the tax. Table for Individual Question Feedback 0.0/1.0 B 8. Suppose the demand for a product is given by P = 60 –2Q. Also, the supply is given by P = 10 + 3Q. If a $10 per-unit excise tax is levied on the buyers of a good, after the tax, the total amount of tax paid by the consumers is A) $10 B) None of these C) $48 D) $32 E) $80 Feedback: The total tax paid by the consumer is equal to (Pt + t –P*. times Qt. Table for Individual Question Feedback 1.0/1.0 D 9. Suppose the demand for a product is given by P = 50 –Q. Also, the supply is given by P = 10 + 3Q. If a $12 per-unit excise tax is levied on the buyers of a good, after the tax, the total amount of tax paid by the producers is A) $21 B) $84 C) $18 D) $63 E) None of these Feedback: The total tax paid by the producer is equal to (P* - Pt. times Qt. Table for Individual Question Feedback 1.0/1.0 D 10. Suppose the demand for a product is given by P = 50 –Q. Also, the supply is given by P = 10 + 3Q. If a $12 per-unit excise tax is levied on the buyers of a good, after the tax, the total quantity of the good sold is A) 7 B) 31 C) 10 D) None of these E) 6 Feedback: Qt can be found by the intersection of the new demand curve and the original supply curve. Table for Individual Question Feedback 0.0/1.0 A HOMEWORK Submitted by ROBERTSON, KRISTI (KLR5625) on 4/16/2016 4:14:52 PM Points Awarded 99.00 Points Missed 1.00 Percentage 99.0% 1. Suppose that a monopolistically competitive firm must build a production facility in order to produce a product. The fixed cost of this facility is FC = $24. Also, the firm has constant marginal cost, MC = $3. Demand for the product that the firm produces is given by P = 27-3Q. Fill in the table below. Some numbers have been filled in for you. Hint: All answers that you fill in will be integers (no decimals). Be sure to just type the numbers and do not type in dollar signs. Another Hint: It may be best if you print out the table first and fill it in by hand and then type in your answers. Quantity of Output Price Total Cost Average Total Cost Total Revenue Profits 1 2 3 4 5 7.8 6 7 6.4 8 9 5.7 Table for Individual Question Feedback 20.0/21.0 Box 1: 24; Box 10: 27; Box 19: 27; Box 25: 24; Box 34: -3; Box 2: 21; Box 11: 30; Box 20: 15; Box 26: 42; Box 35: 12; Box 3: 18; Box 12: 33; Box 21: 11; Box 27: 54; Box 36: 21; Box 4: 15; Box 13: 36; Box 22: 9; Box 28: 60; Box 37: 24; Box 5: 12; Box 14: 39; Box 29: 60; Box 38: 21; Box 6: 9; Box 15: 42; Box 23: 7; Box 30: 54; Box 39: 12; Box 7: 6; Box 16: 45; Box 31: 42; Box 40: -3; Box 8: 3; Box 17: 48; Box 24: 6; Box 32: 24; Box 41: -24; Box 9: 0; Box 18: 51; Box 33: 0; Box 42: -51 2. Enter just a number to answer this problem. How many units of output will the firm produce if maximizes its profit? Table for Individual Question Feedback 2.0/2.0 4 3. Enter just a number to answer this problem. What price should this firm charge if it wants to maximize its profit? Table for Individual Question Feedback 2.0/2.0 15 4. Monopolistic competition differs from perfect competition primarily because in monopolistic competition, A) firms can differentiate their products. B) entry into the industry is blocked. C) there are relatively few barriers to entry. Table for Individual Question Feedback 2.0/2.0 A 5. The demand facing a monopolistically competitive firm is ________ a monopoly firm and ________ a perfectly competitive firm. A) as elastic as; less elastic than B) less elastic than; more elastic than C) more elastic than; less elastic than D) more elastic than; as elastic as Table for Individual Question Feedback 2.0/2.0 C 6. If firms in a monopolistically competitive industry are earning economic profits, then in the long run A) these firms can continue earning economic profits because entry into the industry is blocked. B) new firms producing close substitutes will enter the industry and this entry will continue until economic profits are eliminated. C) new firms producing the exact same product will enter the industry and this entry will continue until economic profits are eliminated. D) the government will most likely regulate firms in this industry to reduce these economic profits. Table for Individual Question Feedback 2.0/2.0 B 7. For a monopolistically competitive firm in long-run equilibrium, A) the demand curve must intersect the average total cost curve at the ATC curve minimum. B) the demand curve must be tangent to the average total cost curve at the ATC curve minimum. C) at the profit-maximizing quantity, the demand curve must intersect the average total cost curve. D) at the profit-maximizing quantity, the demand curve must be tangent to the average total cost curve. Table for Individual Question Feedback 2.0/2.0 D 8. We know that monopolistically competitive firms prevent the efficient use of resources because they produce where A) P > ATC. B) P > MC. C) MR > P. D) P = MC. Table for Individual Question Feedback 2.0/2.0 B 9. When monopolistically competitive firms earn ________ economic profits, other firms ________ an industry in the long run. A) positive; enter B) zero; enter C) negative; enter D) zero; exit Table for Individual Question Feedback 2.0/2.0 A 10. Firms will ________ a monopolistically competitive market until ________ are eliminated. A) enter; losses B) enter; profits C) exit; short run profits D) exit; long run profits Table for Individual Question Feedback 2.0/2.0 B 11. When MR = MC and P = ATC for a monopolistically competitive firm, the firm is in A) short‐run disequilibrium. B) long‐run disequilibrium. C) long‐run equilibrium. D) neither short‐run nor long‐run equilibrium. Table for Individual Question Feedback 2.0/2.0 C 12. Refer to the graph above, which represents the demand and cost curves for Neat and Trim Barber Shop, a monopolistically competitive firm. The profit-maximizing number of haircuts for the Barber Shop is A) 20 B) 23 C) 25 D) 30 E) some value less than 20 Table for Individual Question Feedback 2.0/2.0 A 13. Refer to the graph again. The profit-maximizing price of haircuts by Neat and Trim is A) $10 B) $12 C) $14 D) $16 E) some price less than $10 Table for Individual Question Feedback 2.0/2.0 D 14. If Neat and Trim maximizes profits, it ________ of $80. A) receives a total revenue B) earns a profit C) has a total cost D) suffers a loss Table for Individual Question Feedback 2.0/2.0 B 15. If Neat and Trim maximizes profits, its ________ equals $320. A) total cost B) total revenue C) profit D) variable cost E) average cost F) marginal cost G) marginal revenue Table for Individual Question Feedback 2.0/2.0 B 16. If Neat and Trim maximizes profits, its ________ is $240. A) total revenue B) total cost C) profit D) marginal revenue E) average cost F) marginal cost G) price Table for Individual Question Feedback 2.0/2.0 B 17. Refer to the graph. From society's point of view, the efficient output level is ______ haircuts. A) 20 B) 23 C) 25 D) 30 E) whatever amount of haircuts that occur at the horizontal intercept of the demand function Table for Individual Question Feedback 2.0/2.0 C 18. Refer to the graph again. Suppose that the profits or losses incurred by Neat and Trim are a reflection of the Barber Shop industry as a whole. In the Barber Shop industry, in the long run, A) firms will continue to earn economic profits. B) firms will enter until all firms earn zero economic profit. C) product demand will become perfectly inelastic D) the government will impose price controls to eliminate any economic profits. Table for Individual Question Feedback 2.0/2.0 B 19. Suppose that two players are playing the following game. Player A can choose either Top or Bottom, and Player B can choose either Left or Right. The two players choose their strategies simultaneously. The payoffs are given in the table, where the number on the left is the payoff to Player A, and the number on the right is the payoff to Player B. How many possible outcomes are there in this game? A) 2 B) 4 C) 8 D) 16 Table for Individual Question Feedback 2.0/2.0 B 20. Does Player A have a dominant strategy? If so, what is it? A) Top is a dominant strategy for Player A B) Bottom is a dominant strategy for Player A C) Left is a dominant strategy for Player A D) Right is a dominant strategy for Player A E) There is no dominant strategy for Player A Table for Individual Question Feedback 2.0/2.0 E 21. Does Player B have a dominant strategy? If so, what is it? A) Top is a dominant strategy for Player B B) Bottom is a dominant strategy for Player B C) Left is a dominant strategy for Player B D) Right is a dominant strategy for Player B E) There is no dominant strategy for Player B Table for Individual Question Feedback 2.0/2.0 E 22. The following four questions are True/False. The strategy combination of Player A choosing Top and Player B choosing Left is a Nash Equilibrium. A) True B) False Table for Individual Question Feedback 2.0/2.0 A 23. The strategy combination of Player A choosing Top and Player B choosing Right is a Nash Equilibrium. A) True B) False Table for Individual Question Feedback 2.0/2.0 B 24. The strategy combination of Player A choosing Bottom and Player B choosing Left is a Nash Equilibrium. A) True B) False Table for Individual Question Feedback 2.0/2.0 B 25. The strategy combination of Player A choosing Bottom and Player B choosing Right is a Nash Equilibrium. A) True B) False Table for Individual Question Feedback 2.0/2.0 A 26. What is the maximin strategy for Player A? A) Top B) Bottom C) Left D) Right E) There is no maximin strategy for Player A Table for Individual Question Feedback 2.0/2.0 A 27. What is the maximin strategy for Player B? A) Top B) Bottom C) Left D) Right E) There is no maximin strategy for Player B Table for Individual Question Feedback 2.0/2.0 D 28. Now suppose the same game is played with the exception that Player A moves first and Player B moves second. Using the backward induction method discussed in the online class notes, what will be the outcome of the game? Hint: Draw the game tree associated with this situation. A) Player A chooses Top and Player B chooses Left B) Player A chooses Top and Player B chooses Right C) Player A chooses Bottom and Player B chooses Left D) Player A chooses Bottom and Player B chooses Right Table for Individual Question Feedback 2.0/2.0 D 29. The table shows an industry with 12 firms and the market share (percentage) owned by each firm. Calculate the HHI for this industry. Table for Individual Question Feedback 3.0/3.0 1042 30. If firms F and G decide to merge, what would the new HHI be? Table for Individual Question Feedback 3.0/3.0 1138 31. If firms C and D decide to merge, what would the new HHI be? (don’t assume that firms F and G have merged from the previous question). The new HHI after firms C and D merge is Table for Individual Question Feedback 3.0/3.0 1330 32. If firms C and D decide to merge. This merger would be ________ by the FTC because _______. A) challenged, the post merger HHI > 1800 B) challenged, the merger would increase HHI by more than 100 C) unchallenged, the post merger HHI < 1000 D) unchallenged, there are still 11 other firms keeping the industry competitive Table for Individual Question Feedback 3.0/3.0 B 33. Which of the following is true about antitrust law? A) The “Rule of Reason” strengthened the Sherman Act B) Antitrust legislation is generally aimed at making markets more concentrated with a smaller number of firms C) Antitrust legislation doesn’t have as many important applications today, and this is emphasized by the fact that the Clayton Act was passed more than 100 years ago D) All actions that reduce competition are deemed illegal according to antitrust law E) The Clayton act makes specific rules about economic actions being illegal if they result in a greatly reduced amount of competition Table for Individual Question Feedback 3.0/3.0 E 34. The ________ is the share of industry output in sales or employment accounted for by the top firms in an industry. A) concentration ratio B) contestability ratio C) competitive index D) collusive level E) HHI Table for Individual Question Feedback 2.0/2.0 A 35. The major distinguishing characteristic of oligopoly is that A) firms produce differentiated products. B) firms can influence the price of their product. C) entry into the industry easy. D) firms are interdependent. Table for Individual Question Feedback 2.0/2.0 D 36. The four largest firms account for approximately 90% of U.S. beer sales. The U.S. beer industry would be best classified as a(n) A) perfectly competitive industry. B) monopolistically competitive industry. C) oligopoly. D) monopoly. Table for Individual Question Feedback 2.0/2.0 C 37. Of the following, ________ is the best example of an oligopolistic industry. A) grocery stores B) automobiles production C) electric power D) soybean farming Table for Individual Question Feedback 2.0/2.0 B 38. Oligopolists must ________ to their strategy in order to determine their optimal strategy. A) anticipate the reaction of their customers B) anticipate the reaction of their rivals C) both A and B are correct. D) none of the above Table for Individual Question Feedback 2.0/2.0 C Submitted by ROBERTSON, KRISTI (KLR5625) on 4/29/2016 10:02:47 PM Points Awarded 81.00 Points Missed 19.00 Percentage 81.0% 1. The Coase theorem states that A) the private sector will fail to produce the efficient amount of a public good because of the free-rider problem. B) under certain conditions, private parties can arrive at the efficient solution without government involvement. C) if there are external costs in production, the government must intervene in the market to assure that the efficient level of output is produced. D) public goods should be produced up to the point where the additional benefit received by society equals the additional cost of producing the good. Table for Individual Question Feedback 2.0/2.0 B 2. The Coase theorem will apply only if A) the courts can be used to determine the amount of compensation that must be made to the damaged party. B) the amount of compensation that must be made to the damaged party is small. C) the number of people involved is small. D) an individual who is not affected by the externality can negotiate a settlement between the parties imposing the externality and the parties that are harmed by the externality. Table for Individual Question Feedback 2.0/2.0 C 3. An efficient outcome can always be reached by requiring the individual who produces the externality to fully compensate individuals for any damage inflicted. A) TRUE B) FALSE Table for Individual Question Feedback 2.0/2.0 B 4. According to the Coase theorem, bargaining will bring the contending parties to the correct solution only if the rights are initially assigned to the party causing the externality. A) TRUE B) FALSE Table for Individual Question Feedback 2.0/2.0 B 5. A national campaign is asking for contributions of $1.00 per citizen to fund the building of the September 11th memorial in New York City. The total cost of the memorial is estimated to be $260 million. You decide not to contribute, because your contribution would be small relative to the total that it wonʹt make any difference whether you contribute or not. This is an example of the ________ problem. A) nonexcludable B) nonrival in consumption C) free-rider D) drop-in-the-bucket Table for Individual Question Feedback 2.0/2.0 D 6. A television signal sent by cable is ________ in consumption and viewers are ________. A) rival; excludable B) nonrival; excludable C) nonrival; nonexcludable D) rival; nonexcludable Table for Individual Question Feedback 0.0/2.0 B 7. Public goods are A) rival in consumption and their benefits are excludable. B) nonrival in consumption and their benefits are excludable. C) nonrival in consumption and their benefits are nonexcludable. D) rival in consumption and their benefits are nonexcludable. Table for Individual Question Feedback 2.0/2.0 C 8. If, at a low cost, you cannot prevent a person from benefiting from the consumption of a good you produced, the good is A) excludable. B) nonexcludable. C) rival in consumption. D) nonrival in consumption. Table for Individual Question Feedback 2.0/2.0 B 9. Refer to the figure above. Suppose the government assigns property rights to the airlines. No negotiations occur between the parties. The resulting level of air travel is ________. A) 0 units B) 100 units C) 120 units D) Indeterminate from the given information. Table for Individual Question Feedback 2.0/2.0 C 10. Refer to the figure above. Suppose the government assigns property rights to the airlines. No negotiations occur between the parties. The marginal damage cost associated with the resulting level of air travel is ________. A) $25 B) $120 C) $265 D) $385 Table for Individual Question Feedback 2.0/2.0 B 11. Refer to the figure above. Suppose the government assigns property rights to the airlines, then the airlines and the residents engage in negotiations. The resulting efficient level of air travel is ________. A) 0 units B) 100 units C) 120 units D) Indeterminate from the given information. Table for Individual Question Feedback 2.0/2.0 B 12. Refer to the figure above. The marginal damage cost associated with the efficient level of air travel is ________. A) $0 B) $100 C) $225 D) $265 Table for Individual Question Feedback 0.0/2.0 B 13. Refer to the figure above. The marginal damage cost ________ as the quantity of air travel increases. A) increases B) decreases C) remains constant D) becomes negative Table for Individual Question Feedback 2.0/2.0 A 14. Refer to the figure above. Suppose the government assigns property rights to the nearby residents affected by the airlines. No negotiations occur between the parties. The resulting level of air travel is ________. A) 0 units B) 100 units C) 120 units D) Indeterminate from the given information. Table for Individual Question Feedback 2.0/2.0 A 15. For the following question, you will need to fill in the blankswith the correct numbers. When filling in the blanks, enter the NUMBERS only. Do NOT enter commas, dollar signs, percent signs, or text. If your answer is a decimal, include your decimal point and round to the nearest tenth. Consider the fictitious good Derp. The demand for Derp is Q = 1200 – 2P. Suppose the supply of Derp is given by Q = –600 +2P. What is the equilibrium price of Derp? What is the equilibrium quantity of Derp? What is the price elasticity of demand at the equilibrium price and quantity? What is the price elasticity of supply at the equilibrium price and quantity? For the next seven questions, suppose a per-unit excise tax of $50 per Derp is levied on the consumers. What price will sellers receive after the tax is levied? What price will consumers pay after the tax is levied? What percent of the tax will be paid by the consumers of Derp? (give an answer between 0 and 100) What percent of the tax will be paid by the suppliers of Derp? (give an answer between 0 and 100) How many Derps will be sold after the tax is imposed? How much consumer surplus do consumers get after the tax? What is the deadweight loss created by this tax? Table for Individual Question Feedback 33.0/33.0 16. For the following question, you will need to fill in the blankswith the correct numbers. When filling in the blanks, enter the NUMBERS only. Do NOT enter commas, dollar signs, percent signs, or text. If your answer is a decimal, include your decimal point and round to the nearest tenth. Consider the market for laptop computers. The demand for laptops is Q = 1800 – 3P. Suppose the supply of laptops is given by Q = –200 +2P. What is the equilibrium price of laptops? What is the equilibrium quantity of laptops? What is the price elasticity of demand at the equilibrium price and quantity? What is the price elasticity of supply at the equilibrium price and quantity? For the next seven questions, suppose a per-unit excise tax of $80 per laptops is levied on the consumers. What price will sellers receive after the tax is levied? What price will consumers pay after the tax is levied? What percent of the tax will be paid by the consumers of laptops? (give an answer between 0 and 100) What percent of the tax will be paid by the suppliers of laptops? (give an answer between 0 and 100) How many laptops will be sold after the tax is imposed? How much consumer surplus do consumers get after the tax? What is the deadweight loss created by this tax? Table for Individual Question Feedback 18.0/33.0 17. Second hand cigarette smoke is an example of a(n) ________. A) economy of scale B) externality C) public good D) government failure Table for Individual Question Feedback 2.0/2.0 B 18. A well-maintained house and yard is an example of A) a positive externality. B) a negative externality. C) a public good. D) logrolling. Table for Individual Question Feedback 2.0/2.0 A 19. Assuming no externalities exist, if a goodʹs price is less than its marginal cost, then the benefits consumers derive are A) greater than the cost of resources needed to produce it and less should be produced. B) greater than the cost of resources needed to produce it and more should be produced. C) less than the cost of resources needed to produce it and less should be produced. D) less than the cost of resources needed to produce it and more should be produced. Table for Individual Question Feedback 2.0/2.0 C Monopolistic competition is an industry structure that blends elements of each of the forms of market structure that we have examined so far – perfect competition and monopoly. As with perfect competition, there are numerous firms and no barriers to entry. But as with monopoly, there is a downward-sloping demand curve faced by each firm. In addition, while perfect competition and pure monopoly are rare, monopolistic competition as well as the remaining industry structure, oligopoly, are common forms of industrial organization. Consider more specifically the distinguishing characteristics of monopolistic competition. There are three key characteristics of monopolistic competition: 1. many firms 2. no barriers to entry 3. product differentiation (heterogeneous products) The first two of these are key characteristics of perfect competition, but in that market model, products of different producers are identical to one another (homogeneous). Hence, product differentiation is what distinguishes monopolistic competition from perfect competition. There are numerous monopolistically Okay, and now suppose there's a marginal cost curve like this. Now what we do in the long run equilibrium is that the firm is going to produce this quantity of output, okay, just like in the short run, and they're going to charge this price as high as they can given what the demand is. Now remember this is this firm's residual demand curve, so this is the demand curve that the individual firm faces. But we [ ] [ ] this is one of the negative results of this market structure, not producing at minimum average total cost. But competition model in the long run, okay, so these are the results that you need to remember. Characteristics of Oligopoly Measures of Industry Concentration payoffs of the game are given in the following payoff matrix where the number on the left is the payoff to Firm A, and the number on the right is the payoff to firm B: If both firms choose a high price, then they each make a profit of 500. If they both choose a low price, then they each make a profit of 100. If firm A chooses a low price and firm B chooses a high price, then everyone buys from firm A and firm A makes a profit of 750 while firm B makes nothing. If firm B chooses a low price and firm A chooses a high price, then everyone buys from firm B and firm B makes a profit of 750 while firm A makes nothing. Both firms have a dominant strategy which is to choose a low price, so the likely outcome of the game is for both firms to choose a low price and they each make a profit of 100. If they could somehow agree to each choose a high price, they could each make a profit of 500 which is clearly better for both firms. The problem is that each firm has an incentive to cheat on such an agreement. They cannot make a legally binding contract because such a contract is illegal in the United States. This is where the guaranteed price matching scheme comes in. If firm A, for example, were to announce that if firm B chooses a low price then firm A will match it, then firm B no longer has an incentive to choose a low price! The guaranteed price matching scheme is actually a way for the firms to keep the price in the market high, which is good for the firms but not good for the consumers!! Note that it is not always the case that each player has a dominant strategy. Yet often it may be possible in such a situation for a game to have a predictable outcome. Suppose, for example, that in another situation firm C does not have a dominant strategy, but firm D does (and firm C recognizes that dominant strategy). Then firm C will choose its strategy based on its expectation of what firm D will do. This describes what is called a Nash equilibrium in game theory – a combination of strategies where no player can improve their payoff by changing strategies, given the strategies chosen by the other players. There are two additional aspects of game theory that we consider briefly here: maximin strategy and sequential games. A maximin strategy in game theory is a strategy designed to maximize the minimum gain that can be earned. Such a strategy may be desirable when a player confronts considerable uncertainty and a risk of a large potential loss. Consider the following payoff matrix where Player A can choose either the Top row or the Bottom row. Player B chooses either the Left column or the Right column. For each strategy combination, the number on the left is the payoff to Player A, and the number on the Right is the payoff to player B. So for example, if Player A plays Top and Player B plays Left, then Player A gets 2 and Player B gets 5. Player B Left Right Player A Top 2 5 1 6 Bottom -500 1 3 8 In this example, Player B has a dominant strategy to choose the Right column. Player A, knowing this, should choose Bottom to receive a payoff of 3. However, what if Player B actually chooses Left? This would result in a huge loss for Player A. In order to avoid the potential loss, Player A could choose her maximin strategy. To find a player’s maximin strategy, find the worst possible payoff that a player could receive for each strategy that they have. Then, choose the strategy that yields the highest payoff among all of the worst-case outcomes. In the example above, for Player A, the worst outcome from playing Top is to receive 1, whereas the worst outcome from playing Bottom is to receive -500. Since 1 > -500, Top is player A’s maximin strategy. For the following payoff matrices, you should be able to identify: 1. If either player has a dominant strategy, and if so what it is. 2. The Nash equilibrium of a game if it exists (note that it is possible for a game to have multiple Nash Equilibria. Also, games with no Nash equilibrium will typically have an Equilibrium in mixed strategies where assign a probability to each of their strategies, so in effect they play the game with a random element to it. This however is beyond the scope of this course.) 3. Each player’s maximin strategy. Click "Check your answer" to see if you answered correctly. >> Okay, on this video I'm going to introduce the idea of a dominant strategy. Okay so we kind of saw this in our previous video but a dominant strategy, a player has a dominant strategy if it always yields a higher payoff than any other strategy which that player has regardless of the strategy or strategies chosen by the other player or players depending on how many players he's playing with. Okay so I don't really want to get into strictly dominant versus weakly dominant. We could, the way I've described this is strictly dominant strategy because it means that, it always yields a higher payoff. There's another notion called weakly dominant which means that it never yields a lower payoff so it's really a difference between greater than versus greater than or equal to but I want to get the concept across in the most simple way so let's look at the game that we were playing before okay. So again we have two players and two strategies and the payoffs were as follows. Here's Player 1. Here's Player 2. Each player can either choose a high price or a low price. Okay so the payoffs were 100 for Player 1, 100 for Player 2. Again the number on the left is the payoff to Player 1 and the number on the right is the payoff to Player 2. It's 50 down here. Here we have 150 and 25 and here we had 25 and 150 okay. In this example each player has a dominant strategy. Okay, Player 1 has a dominant strategy to play low because regardless of what Player 2 does, look at the definition, low yields a higher payoff than high for Player 1 no matter what Player 2 does. Another way to put this is that low is a best response to each of the other players' strategies. Okay, so in this example Player 1 has a dominant strategy. [ ] And that dominant strategy is low. Now you can also notice that since the game is symmetric it turns out that Player 2 has a dominant strategy of low as well. [ ] So that's low because if Player 1 plays high, low yields a higher payoff than high for Player 2 and if Player 1 plays low again, low yields a payoff of 50 and high only 25. So low beats high no matter what Player 1 does. Now that's the idea of a dominant strategy. And the way that you'll be tested on this is that you'll be given a payoff matrix and you'll be asked to identify if a player has a dominant strategy and if so, what it is, what is it? So let's try a couple more examples and see if we can lock this idea in. Okay, so let's try another one. And now I'll make the strategies a little more generic so they could apply to a wide range of things. We're going to let Player 1 choose the row and Player 2 choose the column so Player 1 can either go top or bottom and Player 2 can either go left or right. Okay, so let's put some payoffs in here say 2, 3, 3, 6, 1, 2, 4, 3. Okay, take a minute and see if you can answer this question. Does Player 1 have a dominant strategy and if so what is it? Think about the best response to Player 2 playing left and the best response to Player 2 playing right and see if you come up with the same strategy each time. If Player 2 chooses left, Player 1 is better off playing top because top gives him a payoff of 2 where bottom only gives him a payoff of 1. So top is the best response to left. But if Player 2 plays right, Player 1 is better off choosing bottom because 4 is greater than 3. So bottom is the best response to right. So in this case Player 1 does not have a dominant strategy. We can't say that top always yields a higher payoff than bottom and we can't say that bottom always yields a higher payoff than top. In the one situation top is better and in another situation bottom is better so Player 1 has no dominant strategy. [ ] Alright what about Player 2? Do they have a dominant strategy? Again let's look at the best responses. If Player 1 chooses top, Player 2 is better off choosing right because 6 is better than 3. Again, now we're looking at the number on the right is the payoff to Player 2. And if Player 1 plays bottom again, right is the best response because 3 is better than 2. So in this situation right always yields a higher payoff than left regardless of whether Player 1 plays top or bottom. So in this case Player 2 does have a dominant strategy and that is to play right. [ ] Okay, so we see in this example that a player may or may not have a dominant strategy okay. It could be the case that one player does and the other doesn't and we'll see a little bit later that it's actually pretty easy to figure out what the solution to this game would be. You could think strategically. If you were Player 1 you would assume that Player 2 would probably go right and then you would pick what's best for you so I would predict that bottom right would be the outcome but we'll get to that in a little bit later when we talk about a concept called nash equilibrium. Alright, let's try one more, make sure you have this locked in. Okay, so let's try the following. [ ] The top, bottom, left and right, Player 2, Player 1, okay so let's try 3, 4, 2, 8, 6, 5, 7, 4. Okay, let's go through the drill. Does Player 1 have a dominant strategy? If Player 2 plays left the best response is bottom, 4 beats 3. If Player 2 plays right the best response again is bottom so they do have a dominant strategy. Player 1 has a dominant strategy which is to play bottom. [ ] What about Player 2? The best response to top is for Player 2 to play right because 8 is better than 4. The best response to playing bottom however is for Player 2 to play left because 7 is better than 5. So for Player 2, no, they do not have a dominant strategy, okay. So that's the idea of a dominant strategy. It's possible that neither player has one. It's possible that both players have one. It's possible that one player has one and the other does not. >> Okay in this video we are going to discuss the concept of Nash equilibrium. This was first introduced by John Nash, who won the Noble Prize for this concept. You may have seen the movie "A Beautiful Mind" that featured John Nash and so here is a Nash equilibrium. It's a combination of strategies where no player can improve their payoff by switching to another of their strategies given the strategy or strategies, as the case may be, chosen by the other player or players. Okay, so the idea is that if I'm playing a game against you, given the strategy you've chosen, I am doing the best response I can to that. Okay? So I can't improve my payoff by switching to something else given what you're doing. And given what I'm doing, you're best responding to me so that you can't improve by playing another one of your strategies. Okay? So once we get locked into this kind of equilibrium, there's no tendency for either player to want to change their strategy and of course that's what we mean by equilibrium, a situation where there's no tendency for change. Okay? So let's take an example, let's see if we can identify the Nash equilibrium or equilibria. All right, so let's go back to the first example we used, the pricing game. Okay, so player 1, each player could choose either high price or low price, okay and our payoffs were as follows. [ Writing On Board ] Okay and remember the payoff, the number on the left is the payoff to player 1 and the number on the right is the payoff to player 2, and each player wants to maximize their own payoff. Okay? And so there are four strategy combinations, okay, high/high, high/low, low/high, low/low; each of these four squares corresponds to a strategy combination. So let's check for Nash equilibrium. Now the way to do this is to check each outcome, each of these strategy combinations, one at a time, and see if you can find a player that could benefit, that could improve their payoff by switching their strategy given what the other player is doing. Okay? So let's look at top left, where each player chooses a high price. Given that player 2 is choosing a high price and so we're in the left column, player 1 could improve their payoff by switching from high to low. They could improve from 100 to 150. So I found a player that could improve their payoff by switching so I can immediately rule this out as a Nash equilibrium. All you need is to find one player that could improve their payoff by switching. Now in this case it turns out that given that player 1 is playing high and we're in the top row, player 2 could also benefit by switching to low, so in fact both players would want to switch given what the other player is doing. Okay, let's check. Player 1 chooses low and player 2 chooses high. Okay, in this case given that player 2 has chosen high price, player 1 would not want to switch from low to high because their payoff would decrease from 150 to 100. But now I also need to check the other player. Given that player 1 is choosing a low price, player 2 could benefit if they switched from a high price to a low price, their payoff would increase from 25 to 50, so I found a player that could benefit by switching so that's not a Nash equilibrium. Let's check high price/low price, top right. Can you find a player that would benefit by switching given what the other player is doing? Yeah, given that player 2 is choosing a low price and we're in the right column, player 1 could benefit by going from high to low. Their payoff would increase from 25 to 50, so this is not a Nash equilibrium. Low/low is a Nash equilibrium. So we'll put a star there. Given that player 2 is choosing a low price, player 1 would not want to switch from low to high. And given that player 1 is choosing a low price, player 2 would not want to switch from low to high. So neither player can improve their payoff by switching their strategy given what the other player is doing. Okay? Now don't make the following mistake. Some people tend to say why wouldn't player 1 want to switch from this to here, okay, well they can't do that, okay, because these are player 2's payoffs. And then you may also say, well what about player 1's payoff, what wouldn't they want to switch to here. Well player 1 can't control that. That would be the equivalent of telling player 2 what to do. Player 1 can only choose up and down and player 2 only gets to choose left and right. Okay, so keep that in mind. All right, let's try another example. Let's go back to the second example we did when we talked about dominant strategy. All right, we had this payoff matrix, okay so player 1 gets to choose the row, either top or bottom. Player 2 gets to choose the column, either left or right. Okay? And we had the following payoffs, 2,3; 3,6; 4,4; and 1,2. Okay, so let's look for Nash equilibrium. What about top left? Given that player 2 is playing left, player 1 would not want to switch from top to bottom because their payoff would decrease from 2 to 1; however, given that player 1 is playing top, player 2 would want to switch from left to right because their payoff would increase from 3 to 6, so here in this case player 2 would want to switch. So it's not a Nash equilibrium. What about top right? Okay, well given that player 2 is playing right, player 1 could improve their payoff by switching to bottom. It would go from 3 to 4. But player 2 would not want to switch in this case. They would not want to go from 6 to 3 by choosing left instead of right, but player 1 would and it's only necessary to find one player who wants to switch. Okay, bottom left, player 1 would benefit by switching and player 2 would benefit by switching, so that's definitely not a Nash equilibrium. Here's the Nash equilibrium. Given that player 1 is playing bottom, player 2 would not want to switch from right to left and given that player 2 is playing right, player 1 would not want to switch from bottom to top. Now when we identified a dominant strategy in the previous video, it always yields a higher payoff than any other strategy regardless of what the opponent, the other player does. If a player has a dominant strategy, they will play that strategy in the Nash equilibrium. So in this example we saw that player 2 has a dominant strategy to play right because 6 beats 3 and 4 beats 2. So actually we can quickly find the Nash equilibrium by eliminating the left column. There's no way either of these could be a Nash equilibrium because player 2 would always want to switch. So we look at player 2's dominant strategy and then of those outcomes, simply pick the one that's best for player 1 so that they wouldn't want to switch and you'd go straight to the Nash equilibrium. In the case where each player has a Nash equilibrium, it's very easy to find it. Okay, so-- Excuse me, when each player has a dominant strategy. In this situation, they both have a dominant strategy to play low and that leads us very quickly to the Nash equilibrium. Okay? Now just a couple more examples here. It's possible to have multiple Nash equilibria. A very simple game will demonstrate that. [ Writing on Board ] Suppose we had 1,2; 2,1; 0,0; 0,0 and this situation both top left and bottom right are Nash equilibria. Now this is not a good thing from the point of view of trying to predict what's going to happen because now we have actually less predictive power and we don't know whether we're going to end up in top left or bottom right. In fact, this could be a coordination game, as what this is sometimes called, where both players would either want to be at this point or this point but we definitely don't want to be in these two. And in this situation, player 2 would prefer top left over bottom right and player 1 would prefer bottom right over top left. We have two Nash equilibria, so we don't really know what's going to happen. We may have to use some other solution techniques to try to predict what'll happen in this game. Okay? So that's an example where there could be multiple Nash equilibria. It's also possible to have no Nash equilibria, at least in something we call pure strategies. We'll get to that a little bit later but look at this game and they're pretty easy to construct. [ Writing on Board ] Okay so we'll go 1,2; 2,3; 0,4; 5,1; and we kind of go around the horn. We look at top left, we see that player 1 would want to switch. Bottom left, player 2 would want to switch. Bottom right, player 1 would want to switch. And top right, player 2 would want to switch. So we really have no outcome here that is in equilibrium. Okay? So there's no Nash equilibrium in this game. Technically, there is a Nash equilibrium in what we call mixed strategies, where instead of choosing either top or bottom, player 1 assigns a probability to choosing top and, therefore, probability of choosing bottom [inaudible] choose top 2/3 and bottom 1/2, so their strategy set becomes not choosing top or bottom but to choose the value of that probability. And player 2 chooses left or right, they assign a probability to choosing left and a probability to choosing right and you can actually find a Nash equilibrium where you find a combination of probabilities where neither player wants to switch the probability that they've chosen, but that's a little beyond the scope of what we want to do here. So what we actually say is that there's no Nash equilibrium in pure strategies. A pure strategy just means that you either pick for example top or bottom for player 1 or you either pick left or right for player 2. Okay, so you'll be tested on this. You'll see a payoff matrix and you'll have to identify the Nash equilibria. Okay, so that's how you'll be [inaudible] to see if you understand this concept. >> Okay. In this video we are going to learn about a risk adverse strategy. It's called a maximin strategy. I will get to that definition in just a minute. Let me start out with an example. Let's use the example that we did before. Okay. Where we had following payoffs. So here's our payoff matrix. Okay. So player 1 could either go top or bottom. And player 2 can either go left or right. And the last game that we had, the payoffs where as follows, 2, 3, 3, 6, 4, 4, and 1, and 2. Now when we look at this game we saw that player 1 -- excuse me -- player 2 has a dominant strategy, which is to play right. Okay? So if player 1 plays top, the best response is right, because 6 is better than 3, and if player 1 chooses bottom again the best response is right, because 4 is better than 2. So right always yields a higher payoff for player 2 than left does regardless of what player 1 chooses. Now player 1 does not have a dominant strategy because top is better than bottom versus left, but bottom is better than top versus right. So again we can't say that top dominates bottom or that bottom dominates top. But what we found out was that the Nash equilibrium of this game was bottom right, and we were thinking that if our player won, I would anticipate that player 2 would choose right since right is a dominate strategy. Then given that they are going to choose right, I would choose bottom because it gives me a payoff of 4 rather than 3. Okay. But now suppose -- and to make this kind of dramatic -- let's say we replace this payoff of 1 with something very bad. If player 2 chooses left and player 1 chooses bottom, then player 1 dies. Okay? So we'll replace this payoff with death. That's a pretty bad outcome for player 1. Okay? So if you were player 1, in your heart of hearts, what would you do? When you could make the argument that, well, player 2 is going to go right so I don't really need to worry about that death payoff, which occurs at bottom left. So maybe I should still go right because I would get 4 instead of 3. But would you really want to risk this terrible payoff? Okay? Maybe player 2 doesn't understand how to read the payoff matrix. You don't know who that player is. Maybe they mean to go right, but they make a mistake. They hit the wrong button on the computer and accidently hit left. Do you want to risk that? Okay. Probably not. So you may play top because if you play top, the worst thing that could happen is you get 2. You might get 3. But if you play bottom, the worst thing that could happen is that you get death instead of possibly 4. And this type of strategy occurs in the real world when we talk about people buying insurance for their houses. They are going to pay an insurance premium, and the best case for them would to be not the buy the insurance and have nothing happen to the house. But if something does happen, a flood or fire, then their value of their house is wiped out if they have no insurance, and that's a very bad outcome. So a maximin strategy is designed to give you the best possible outcome of all of your worst-case outcomes. So let's get down to this definition a little better, at least the method of how to find it. Okay? So here we go. All right. So we can leave this up here for a minute so you can study it. To find a player's maximin strategy, you find the worst outcome, in other words the lowest payoff, for each of that player's strategies. Okay? So if I go top, what's the worst that could happen? If I go bottom, what's the worst depending on what strategy that player has? The maximin strategy gets this funny name because you're maximizing over your minimum payoffs, maximin. The maximin strategy is the strategy that yields the highest payoff from all of the worst-case outcomes. So let's try another example here. See if we can identify each player's maximin strategy. Okay. So suppose we have top and bottom, player 1 left and right, player 2, and let's try these payoffs. Okay. Now if you look at this game, you can verify that there is no Nash equilibrium in peer strategies. If we were in top left, player 1 would benefit by switching to bottom. If we were in bottom left, player 2 would benefit by switching from left to right. If we were in bottom right, then player 1 would benefit by switching from bottom to top. And if we were in top right, player 2 would prefer to choose left over right given that player 1 is playing top. So there is no Nash equilibrium in peer strategies here. So maybe we can turn to the maximin strategy as a solution concept. Okay. So what we are going to do is let's see if we can figure out the maximin strategy for player 1. Okay? So here is the idea. Let me scroll this up a little bit. If player 1 plays top, they are either going to get 3 or 6 depending on what player 2 chooses. So the worst-case outcome for player 1 by choosing top is a payoff of 3. If they choose bottom, they are either going to get 4 or 5 depending on what player 2 does. And the worst of those outcomes is 4. So since 4 is greater than 3, bottom is player 1's maximin strategy. Another way to look at this might be helpful is which strategy guarantees that player the most. If I play top, I am guaranteed to get at least 3, maybe 6, but guaranteed 3. If I play bottom, I am guaranteed to get 4. So bottom guarantees me more than top does. Okay. Let's try it for player 2. If player 2 chooses left, now they are either going to get 4 or 2 depending on what player 1 does. So 2 is the worst-case outcome. If they play right, then they are either going to get 1 or 7. So 1 is the worst case outcome. So in this situation, left is the maximin strategy for player 2. So if each player chose their maximin strategy, we would anticipate we would end up here. And player 1 would get a payoff of 4 and player 2 would get a payoff of 2. Okay? So that is how you find a maximin strategy. Sequential Games In many situations, it is appropriate to relax the assumption that the players move simultaneously. It may instead be the case that one player moves first, and the second player knows what strategy the first player has chosen before the second player chooses her strategy. We typically analyze these types of games by using a game tree. Consider the example at right: Tracy chooses her strategy first. She can either choose to move along the upper “branch” of the tree, or the lower branch. After she makes her choice, Amy gets to choose her strategy. What will be the outcome of this game? To find out, we use a method called “backward induction”. The idea is that Tracy must anticipate what Amy will do at each decision point that Amy has. Assuming that Amy cares only about how much profit she makes, if Tracy chooses the upper branch, Amy will choose her upper branch, resulting in a payoff of 250 for Tracy and 175 for Amy. If Tracy chooses the lower branch, then Amy will choose her lower branch, resulting in a payoff of 275 for Tracy and 175 for Amy. So in effect, Tracy is choosing between those two outcomes. Since she wants to get the highest payoff, Tracy should choose the lower branch, and we can predict that the game will result in a payoff of 275 for Tracy and 175 for Amy. In general, by using backward induction, it is possible to solve much more complicated games where each player may have many strategies at each decision point, and the game may have many moves for each player. Try using backward induction to solve the following games. Check your answers after each example. Example 1 300 for Tracy; 150 for Amy Example 2 75 for Tracy; 180 for Amy In other situations, it is appropriate to relax the assumption that the players only play the game one time. For example, airline companies set new air fares quite often. We model these types of situations using repeated games. There is an extensive literature on repeated games in economics, but much of it is beyond the scope of this class. In short, however, repeated games open up the possibility of strategic reactions that have the same effect as tacit collusion. Antitrust Law As noted above, firms often would be better off financially if they could collude and agree on strategies jointly. However, they are prohibited from engaging in such direct collusion by the antitrust laws that were implemented in the United States beginning in the late 19thcentury. The most important of these laws was the Sherman Act, which was passed in 1890. The Sherman Act outlawed “every contract… or conspiracy in restraint of trade or commerce” among states or nations, and it stipulated as well that monopoly and attempts to create a monopoly were illegal. Questions of interpretation of what constitutes “restraint of trade or commerce” were left to the interpretation of the courts. In 1911, in two major cases, the United States Supreme Court established the “rule of reason.” This was essentially a criterion that only “unreasonable” efforts to restrain trade would be illegal under the Sherman Act, and the existence per se of a monopoly market structure was not sufficient to indicate that the Sherman Act had been violated. Subsequent Supreme Court decisions in the second decade of the 20th century, in which several monopolistic firms were taken to court under the Sherman Act but found not to have engaged in “unreasonable conduct,” confirmed that the consequence of establishment of the rule of reason was a distinct weakening of the impact of the Sherman Act. In an effort to beef up the Sherman Act and to clarify the rule of reason, Congress passed the Clayton Act in 1914. This act made several specific actions illegal, including: • Tying contracts that significantly lessen competition • Mergers that significantly lessen competition • Price Discrimination that significantly lessens competition With regards to mergers, the Federal Trade Commission (FTC) uses the HHI discussed earlier to determine whether or not a merger should be challenged. When a merger is challenged by the FTC, an injunction is ordered to stop the merger until the case can be heard by a court. The FTC uses the following guidelines to challenge a merger: • If the post merger HHI < 1000, the merger will go unchallenged. • If the post merger HHI is between 1000 and 1800, then a merger that increases the HHI by 100 or more will be challenged • If the post merger HHI > 1800, then a merger that increases the HHI by 50 or more will be challenged. Example: Suppose there are 10 firms in an industry, each with 10% of the market share. The HHI = 1000. Now suppose two of the firms decide to merge into one larger firm which would have 20% of sales. The new HHI would equal 1200. Since the post-merger HHI lies between 1000 and 1800, and the change in the HHI is greater than 100 (in this case the HHI changes by 200), this merger would be challenged by the FTC. It is important to note that not all mergers that are challenged by the FTC result in the merger being disallowed. The firms can argue that economies of scale resulting from the merger can outweigh the anti-competitive effects of the merger, and that prices to consumers will go down. Typically, both the FTC and private companies hire economists and lawyers to make their case in front of a judge. You have reached the end of this lesson. Close this window to return to ANGEL to complete the lesson activities. >> Okay. In this video we are going to relax the assumption that the players move simultaneously. Instead we're going to see what happens when one player moves first and then the other player can observe that choice of strategies and then after they see what the first player has done, then they get to choose their strategy. More like a game of chess where players move one at a time. Okay. So let's start out with the following game sometimes called the social security game. Okay. So in this -- first, we'll do it simultaneously, okay, where the players move simultaneously. And then we'll see what happens when we relax that assumption. So this game is played between two generations, the old generation and the young generation. And the old people have two strategies. They can save for their retirement or they can squander their money. And the young people have two strategies. They can support the old people through some program like social security or they can elect to let them starve. So we'll put starve. Okay. Now in this situation the story goes, here are the payoffs. If the old people save and the young people support them, then the old people get 3 and the young people who have to pay the taxes to support them get negative 1. If the old people squander, they're still okay because the young people are supporting them here so they get 2 and negative 1. If the old people save and the young people elect not to support them, to let them starve, well, then they each get 1. And if the old people squander their money and the young people decide to let them starve, the old people are in trouble so they get negative 2. But in this story the young people feel so terrible about seeing their grandparents dying and realize what they've done is a terrible thing so they also get negative 2. Okay. So let's quickly go through our drill with this game. Does player -- do the old people have a dominant strategy? And if so what is it? And the answer is yes, to save, because 3 beats 2 and 1 beats negative 2. So regardless whether the young people support or starve, the old people will have a higher payoff by saving than they will by squandering. The young people do not have a dominant strategy. The best response to save is to let them starve but the best response to squander is to support them since negative 1 is greater than negative 2. We can quickly find the Nash equilibrium to the game right here. Since we know the old people will save, they play their dominant strategy. Then we figure out which is better for the young people and you can see that given that the old people have chosen to starve, the young people would not want to switch to squander and given that the old people have chosen to save, the young people would not want to switch from starve to support. So there's your Nash equilibrium. But it seems more likely in this situation that the young people will be able to tell what the old people have done. They'll be able to look and see whether they've saved or they've starved -- or squandered, excuse me. Okay. So the way we model a game like this, this is called a sequential game. So we're going to let the old people move first. Okay. So this is called a sequential game. [ Pause ] And we're going to use something called backward induction which I'm going to describe to you to solve this game. Okay. So we can model this by using what we call a game tree. Okay. So the game tree starts with what we call a decision node, n-o-d-e. Okay. So right here the old people get to choose. We'll write old there. And we're going to draw branches of this tree like this to indicate what the choice is; okay. So they can either save or they can squander. And at that point the young people have their decision node. They actually have two decision nodes depending on what the old people have done so we'll put the young people here. All right. So these round dots are called decision nodes. And now the young people can either choose to support them or let them starve and they can do so at either of their decision nodes. [ Pause ] Okay. So then you have the young people right here, that's their decision node. So make that clear. Okay. So we're not going to change the payoffs. We're going to use the same payoffs as before which we can get from the game tree. So if the old people save and the young people decide to support them, then the payoff is 3 and negative 1. So we're going to write that here. 3, negative 1. If the old people save and the young people choose to let them starve, then we end up right here so the payoff is 1 and 1 so let's write that in. If the old people squander and the young people decide to support them, let's find the payoff there. Squander and support is right here so 2 and negative 1. And finally if the old people squander and the young people decide to let them starve, we end up with a payoff of negative 2 and negative 2. So let's write that in. Okay. Now the way I've written these payoffs, the first number is the payoff to the player who moves first, in this case the old people. And the second number is the payoff to the player who moves second, in this case the young people. Okay. So to solve this game the trick is is that the old people need to anticipate what the young people are going to do at each of their decision nodes. So, for example, the old people would say if I save and the young people are here, if we assume the young people are going to do what's in their, the young people's best interest, they would choose starve because they would rather have a payoff of 1 than negative 1. So comparing the payoff for the young people and choosing the one that's higher. If the old people squander, what are the young people going to do? Well, they're going to choose this outcome because they would rather get negative 1 than this horrible negative 2 that results from watching their grandparents starving; okay? So then essentially the old people can reduce this game to the idea that if I save, we're going to end up with 1 and 1, and if I squander we're going to end up -- I get 2 and they get negative 1. So which of these is better for me, the old people? Now you compare the first payoffs. Turns out that the Nash equilibrium of this game, this is also sometimes called a game in extensive form. If you take our 402 strategy class, you'll learn about that. It just means a sequential game where we use a game tree. We can get it more and more complicated with different amounts of information but I don't want to get too deeply into that now, that's for another class. But the idea of backward induction is that we essentially reduced this game tree to the following. The old people choose either to save or to squander. [ Pause ] Okay. And if they save, the payoff's going to be 1, 1. And if they squander, the payoff's going to be 2 and negative 1. So it's really reduced this to kind of a trivial game. So this is what we mean by backward induction. You start at the end of the game tree anticipating what the choice will be, then you can replace these two branches, for example, by bringing the likely payoff to this point. Okay, just like we did here. And if the young -- if the old people save, then the anticipated outcome is 1 and 1. Let's take this payoff and replace these two branches of the tree and put it right there. And then it looks like it's a pretty obvious choice for the old people. They would rather have 2 than 1. So that's how you solve the game with backward induction and you'll find some practice problems in the workbook that will allow you to practice this. Just remember start at the end of the game and work your way back to the beginning of the game. Externalities occur when the action of one or more economic agents has an effect on another economic agent or agents who are not involved in the action. Externalities can be positive or negative. A Positive Externality occurs when the action of some economic agent bestows a benefit on someone who is not involved with the action. An example is home improvement. It is often the case that when a particular homeowner improves his or her house, that this will raise the property value of other houses in the neighborhood. The value to the other homeowners in the neighborhood is called an external benefit, or externality, since the benefit is not realized by the person who improved his/her house. A Negative Externality occurs when the action of some economic agent imposes a cost on someone who is not involved with the action. An example is a firm that emits pollution into the environment. The firm pays only its cost of production but does not pay for the problems created by the pollution that are suffered by others. The suffering by others is called an external cost, or is sometimes referred to as a damage cost. A positive externality will result in too little of a good being produced for social efficiency. To see why this is so, consider the following example. Suppose there are 6 houses in a neighborhood. One of the homeowners (Homeowner A) is considering a home improvement project that will result in a benefit of $10,000 to that homeowner. This benefit is due to the increased property value of their home, plus the value they place on living in a nicer house. Also, the home improvement project will provide an external benefit to the other 5 homeowners of $2,000 each, which is due to the fact that their houses have increased that much in value because they are now located in a nicer neighborhood. Now suppose that the cost of the home improvement project is $15,000. Will Homeowner A undertake this project? The answer is no. This is because he or she would not be willing to pay $15,000 to gain $10,000 in benefits. However Homeowner A is not taking into consideration the benefits bestowed on the other 5 homeowners. The total social benefit of the project is $20,000 ($10,000 to Homeowner A, and $2,000 to each of the other 5 homeowners). Clearly the social benefit of the project is greater than the cost of the project, so it should be undertaken. But it is not. This is the market failure. Let’s put this into the context of the idea of Pareto Efficiency that we learned in Lesson 8. Suppose each of the other homeowners got together and decided to give Homeowner A $1,500 each in order to convince her to undertake the project. Now Homeowner A would receive $17,500 in benefits at a cost of only $15,000, so she would be better off. Also, each of the other 5 homeowners would net $500 in benefits ($2,000 in improved property value minus the $1,500 that they gave to Homeowner A). So everybody would be better off. But in the absence of such a plan, the project is not undertaken. Failing to undertake the project is not Pareto Efficient since there is a way (as just illustrated) to make everyone better off without making anyone worse off. When there is a negative externality that is left uncorrected, too much of the good will be produced for social efficiency. This is because the agent (person or firm) undertaking the activity does not have to pay the true cost of its actions. Since its costs are artificially low, they will continue to produce beyond the socially efficient level. To better understand this, we distinguish between the Marginal Private Cost (MPC) and the Marginal Social Cost (MSC). The Marginal Private Cost refers to the part of the total cost of producing one extra unit of a good that is borne by the producer. When there is a negative externality present, there are costs which are borne by agents not involved with the process of production. These are called damage costs. The Marginal Damage Cost (MDC) is the part of the cost of producing one extra unit of a good that is not borne by the producer of the good. When we add the Marginal Private Cost to the Marginal Damage Cost, we get the Marginal Social Cost: MSC = MPC + MDC Consider the illustration to the right. This illustration represents production of a good with a negative externality present. If the externality is left uncorrected, the firm will produce Q1 units of the good. This is because that is the level where the Marginal Benefit (MB) is equal to the Marginal Private Cost. However, for each unit of the good produced after quantity Q0, the marginal benefit is less than the Marginal Social Cost. This tells us that from the viewpoint of society, these units of the good should not be produced since the cost of producing them exceeds the benefit from their production. So the socially optimal level of output is Q0. The above examples refer to production externalities. However there can be positive and negative externalities in consumption as well. Music provides a good example of both. Suppose you like to play music very loud. Your consumption of loud music could cause a negative externality if your neighbor is trying to study for an economics exam or trying to sleep. It might also generate a positive externality if your neighbor happens to really like the music you are playing. But whether the externalities are in production or consumption, the outcome is inefficient: • A negative externality, when left uncorrected, will result in too much of the activity for social efficiency. • A positive externality, when left uncorrected, will result in too little of the activity for social efficiency. There are different ways to correct for externalities, but they all involve the same principle—internalizing the externality. Internalizing an externality means that the agent creating the externality is made to realize the full cost (in the event that it is a negative externality) or the full benefit (in the event that it is a positive externality) of its action. To achieve this there are several possibilities: Tax or subsidize the activity: If an agent is creating a negative externality, the government could impose a tax on their activity equal to the marginal damage cost. This would cause the agent to pay the full marginal social cost, since it would pay the marginal private cost plus the marginal damage cost (in the form of a tax). Since the agent would now face the true cost of its action, it will have an incentive to produce the socially optimal level of output. Examples of this are the taxes levied on firms that produce harmful pollution. Similarly, the government could subsidize agents that generate positive externalities. The subsidy should be just enough so that the agent realizes the full benefit of their action. In this way, they will have an incentive to produce the socially optimal level of output. Examples of this are the subsidies given to people who develop housing in poor neighborhoods. While taxes and subsidies work well in principle, it is not always easy to assess the actual value of the external damages or benefits created by an activity. Consider a firm that pours pollution into the air. This pollution might have a small effect on millions of people. To accurately assess what these total damages are is a very difficult task! Some externalities are so serious that they are regulated directly. For example, if a person shoots another person, they have imposed a serious negative externality on the other person. This activity is simply made illegal, and a person can be prosecuted, sent to jail, and even executed for violating this law. In some situations, the parties involved can arrive at the socially efficient outcome without any government intervention. A famous article by Ronald Coase gave us the Coase Theorem which says that, under certain situations, the parties involved can arrive at the socially efficient outcome by themselves. The following example illustrates the Coase Theorem. Suppose a rock band owns a rehearsal room located right next to a nursery. The rock band needs to rehearse for an upcoming gig, and they value their rehearsal time at $500 per day. The nursery makes $600 a day in profit, but they cannot be open if the band is playing loud music next door so that the children are disturbed. What will the outcome of this situation be? It is important to realize that any externality involves at least two parties, and it is not necessarily clear which party is causing the externality. If the rock band practices, they are imposing an external cost on the nursery. However if the nursery can prevent the rock band from practicing, they are imposing an external cost on the rock band. The Coase Theorem states that the outcome will be the same regardless of whether the nursery has the right to silence or the rock band has the right to play music. Suppose the nursery has the right to silence. They would only relinquish this right if the rock band pays them at least $600 per day (the amount they would make if the rock band doesn’t practice). But since the rock band only values their rehearsal time at $500 per day, they would be unwilling to pay the nursery $600, so the result would be that the nursery remains open, and the rock band does not practice. Now consider the situation if the rock band has the right to practice. They would only give up this right if the nursery pays them at least $500 per day. The nursery would be willing to do this since they make $600 per day, and their alternative is to close and make nothing. So the nursery would pay the rock band some amount between $500 and $600 per day to not practice. So again the outcome is that the nursery stays open and the rock band does not practice! Obviously, it matters greatly to the rock band and the nursery which one has the right to either have silence or to make music. But the socially efficient outcome is obtained either way. The outcome is socially efficient because the party that can eliminate the externality at the least cost is the one that does so. In this case, the rock band only loses $500 per day in value, and the nursery would lose $600 per day. The outcome would be different if the rock band valued their rehearsal time more than the nursery valued silence. In order for the Coase Theorem to work, three conditions must be present: • There must be only a few parties involved • The cost of negotiation must be low • The property rights must be clearly defined As a final note to this material on externalities, it should be pointed out that it is not the case that all activity that generates negative externalities should be banned entirely. Consider pollution. It is a mistake to think that the socially efficient level of pollution is zero. This would mean that a great deal of economic activity would have to stop. The optimal level of pollution is the level where the marginal cost of abatement exactly equals the marginal benefit of abatement. >> Okay. In this video we're going to explore the idea of an externality. So an externality occurs when the action of one economic agent -- it could be a consumer or a firm -- either imposes a cost -- we call that a negative externality -- or bestows a benefit -- which we call a positive externality -- on some other economic agent who is not involved in the action taken by the first economic agent. Okay. So for example, if someone smokes a cigarette and blows the smoke into the face of another person, the first -- the smoker is causing an externality, a negative externality presumably, on the person who is not smoking but they have the smoke blown in their face. Okay. There are a number of examples. Pollution is a great example. When a firm produces a product and emits pollution into the air and that causes damage or cost to other people, that firm is opposing a negative externality on the other economic agents. Externalities can be positive as well. So for example, if I fix up my house, get it landscaped and painted and make it look real nice, that may very well improve the property value of other houses in my neighborhood. So the other homeowners had nothing to do with my decision to fix up my house but by me fixing up the house it bestows a benefit upon them by increasing their property value. So we can have both negative and positive externalities. And as we're going to see, as we go through the economics, both of these types of externalities actually cause market failures. So for starters, we're going to explore the idea of a negative externality. Okay. So let's start with a negative externality and we'll look at a positive externality a bit later. Okay. So with a negative externality we have to define a couple of ideas here. So first, we talk about the marginal private cost. Okay. When we are -- let's think of this in terms of production. Suppose a firm produces an extra unit of output. Okay. It has to hire the labor and the capital and the other resources. And the marginal private cost of producing an extra unit of output is how much the total output or excuse me the total cost changes. And this is referring to the cost that is incurred by the firm that produces it. So we're familiar with marginal cost from previous videos. And now we're just making a distinction between the marginal private cost, which is what the firm actually has to pay. And there's also, with an externality involve, something called marginal damage cost. So this is the cost of producing an extra unit of output that is paid by someone other than the producer of the product. So maybe you could think about a paper mill and the paper mill produces paper and in so doing they use trees. They need wood and water and chemicals and machines and laborers. And to produce an extra unit of paper will cost them an extra amount of money. That's the marginal cost, and that's the part incurred by the firm. So that's the marginal private cost. But suppose this paper mill dumps pollution into a river and the pollution kills the fish and that harms a fishery, which is downstream. The cost incurred by the fishery, the other party, is the marginal damage cost, as the name implies. The marginal social cost is the sum of the marginal private cost and the marginal damage cost. Okay. So the firm only incurs the marginal private cost. Other people or other economic agency incur the marginal damage cost and together we get the marginal social cost, which is the true cost of producing an extra unit of output. So here's how the economics works. Kind of a simplified model but let's try this. Okay. So let's suppose we have a demand for a product. Okay. So we have a demand curve. We'll draw a graph here. And we have -- [ Demonstration ] -- the quality of the product on this axis. And we'll measure the dollars. We're going to measure the cost and benefits. So let's suppose there's some demand curve for this product. Maybe it's linear. Maybe not. But let's just say it's downward sloping. We'll draw a straight line for this example. Okay. So here's the demand curve, and what this demand curve tells us is how much society is willing to pay for an extra unit of the good. So depending on how much quantity we produce. All right. The price tells us how much we would be willing to pay for an extra unit. Of course, the more we produce the less we're willing to pay for an extra unit. So the demand tells us the marginal benefit to society. Okay. [ Demonstration ] Okay. All right. So now here's a firm, and let's say that this firm has a marginal private cost of production. Maybe if we're in the short run, their marginal cost curve might look like this. There's the marginal private cost. Okay. All right. If this market is competitive, then the firm is going to produce, where the marginal cost equals the price. And then this would be the quantity that the firm would produce right here. And I'm going to label this QE, for E being for externality. So the firm is not considering the damage that they're doing. But suppose that they are creating a negative externality and imposing a damage on someone else. Then the marginal social cost is going to be higher. So we can draw a graph above this. Maybe like this. Here's the marginal social cost. And then the difference between these two, that's the marginal damage cost. So for any unit of output produced the firm incurs a particular, you know, marginal private cost but they're also imposing a cost on others. So to get the marginal social cost we need to add the marginal damage cost to the marginal private cost. Okay. So from society's point of view, what the economist would like to see, this is the optimal amount of output. We'll call this Q star. This is the socially optimal amount of output. As you can see very clearly, because the firm does not take into consideration the marginal damage cost, they produce too much output for social efficiency. Okay. And the idea is pretty clear if you look at the graph. From the firm's point of view, if I look at these quantities between Q star and QE, okay, if I look at the price, if this is a competitive market, the firm will set. The price will equal the marginal revenue. We discussed that imperfect competition. So here, the marginal revenue is going to be greater than the marginal private cost. So it pays for the firm to continue to produce. They increase their profit by going all the way to here. But for each of these units of output the marginal social cost right here is above what society is willing to pay. So we're producing all these extra units where it's actually costing more in terms of resources and including the damage sustained by the externality, the pollution or whatever it might be. We're producing units of output where the marginal cost, the marginal social cost, is greater than the benefit. Okay. So what we can conclude from this is that if a negative externality is not corrected, then too much output will be produced for social efficiency -- [ Demonstration ] -- or too much of the activity. [ Demonstration ] Okay. Too much of the activity will occur for social efficiency. When, like I mentioned, this can occur in consumption too. If I smoke cigarettes, if I'm not taking into consideration the damage I'm doing by blowing the smoke out, then from society's point of view too much of that activity will occur. So it can occur in either production or consumption. All right. So that's an introduction to externalities and negative externalities. We'll stop the video there. >> OK. In this video I'm going to illustrate with a simple example how positive externalities also lead to a market failure. In fact, we end up with too little of the activity happening for social efficiency. And you might say, "Well, that's weird. You know, a positive externality, isn't that a good thing?" And actually it turns out no. It's not if it's not corrected. So let me just show you a simple example. OK. Suppose, and you'll forgive my artwork here, but suppose there's a neighborhood, OK, and there are some houses in the neighborhood. All right. So here's a house. And here's a house. And maybe here's a house. OK. So we've got some houses in this neighborhood. All right. So maybe there's six houses. OK. All right. So let's say this is your house right here. All right. And you are considering a home improvement project. OK. So you are going to fix up your yard and paint your house, you know, landscape the yard. Do some nice things. Make it look nicer. So you consider a home improvement project. OK. [ Writing on board ] And so you call up your landscaper and your painter and you say these are the things I want done. How much is it going to cost? And you find out that the cost of this project is going to be to you, let's say $10,000. OK. Now you call up your realtor and you say, "Hey, you know, how much do you think this will improve the value of my house?" So you're trying to get a feel for the benefits. And they give you an answer and maybe you also get some benefit because you live in a nicer place. And let's say that you-- the private benefit just to you of this project turns out to be, let's say $8,000. OK. Private benefit. [ Writing on board ] All right. So just on the basis of this information you say, "Well, OK. This is not a good idea. I'm not going to pay $10,000 to fix up my house if I'm only going to get, you know, including the increase in my property value and the extra benefit I get from living in a nice place, if it's only going to benefit me by $8,000." So you wouldn't undertake this project. But now suppose that there's an external benefit. OK. So the external benefit-- suppose that if you do this it increases the value of each of your neighbor's houses by $1,000. $1,000 for each neighbor's house. [ Writing on board ] OK. Now if you just look at the math here. Now realize we had six houses in this neighborhood just to keep the example simple-- to get the idea across. All right. So if you spent $10,000, your house goes up. Your benefit, your private benefit is 8,000. But there's 1, 2, 3, 4, $5,000 in external benefit. OK. Now if you add-- so with five houses that equals a total of $5,000. [ Writing on board ] All right. So the total benefit here is 5,000 plus 8,000 which is $13,000. And when this situation-- clearly the total benefit of the private plus the external benefit is greater than the cost. So this project should be undertaken. But if the homeowner who's thinking about doing this home improvement project does not consider the external benefit, they're not going to do it. OK. And you can see how this is not pareto efficient. There's a way to make everybody better off. If you start from the situation where the home improvement project is not undertaken, OK, no cost, no benefit. Now, suppose each of the neighbors subsidized your house. OK. And said, "Hey, we'll give you $500 each if you will go ahead and fix up your house." Well, if that happened-- if each neighbor gave you $500. One, two, three, four, five. That's $2,500. You get $8,000 of private benefit plus the $2,500 that your neighbors give you. Now you've got $10,500 of benefit which is enough to cover this $10,000 in cost. So you'd be $500 ahead and each of your neighbors-- they paid $500 but their house goes up by $1,000 in value. So they're each $500 ahead. So by doing this subsidy plan, everybody's better off. OK. But in the absence of correcting for that positive externality, if the person who's thinking about fixing up their house only looks at their private benefit then they will not undertake a project which would be good for everybody if they did. And there's a way to redistribute this benefit to make everybody better off. OK. So the conclusion here is that if a positive externality is not corrected then too little of the activity occurs for social efficiency. [ Writing on board ] OK. If a positive externality-- too little. OK. And this example shows where a project that should be undertaken is not. When we talk about correcting externalities, we're going to talk about subsidizing a positive externality or actions that have-- that create positive externalities. And we see this when we see housing subsidies in urban renewal projects where someone will buy a house and the government will say, "Look, if you buy this house and fix it up, we'll subsidize that to make it worth your while because you're creating positive externalities to the other areas, the businesses and the other houses in the neighborhood." All right. So that's the result of a positive externality. That's the economics of that. OK. So you can see why it also leads to a market failure. It's too little of the activity occurring. up their house we would like for them to receive not only the private benefit but also the external benefit and by doing this we give an incentive for in both cases for the socially efficient amount of the activity to take place. All right so one way we can do this is by taxes and subsidies so with a tax we can use a tax to correct for a negative externality and the amount of the tax should be equal to the marginal damage cost or interchangeably the marginal external cost so the idea again is that if I'm producing paper I it up, okay they improve the property, and to do that they need--, they're actually creating a positive >> Okay, in this video, I'm going to use a simply example to explain Coase theorem, and the Coase basically says that if the following assumptions hold, there are only a few parties involved, and there is a low cost of negotiation, and that the property rights are clearly defined, then a negative externality can be solved in the most efficient manner, which means in the sense this whoever can solve the problem more cheaply is the one that ends up solving it. So let me see if I can explain this. Okay, so if there's just a couple of people involved, and I'm going to give an example where there's two. There's a rock band Practice Problem 1 What does “internalizing an externality” refer to? How might a positive externality be internalized? How might a negative externality be internalized? Answer Practice Problem 2 What are the three conditions that are required for the Coase Theorem to work? Briefly explain each condition. Answer Practice Problem 3 Draw a graph showing a market that has a negative production externality. Label the market quantity, the efficient quantity, the curves and the axes. How might the government intervene to internalize this externality? Answer The government could internalize this externality by placing a tax equal to the value of the externality on producers. Practice Problem 4 Explain why a negative production externality leads to overproduction of the good? Show your conclusions graphically. Answer Practice Problem 5 Bob and Dexter share a dorm room. Bob is a smoker but Dexter does not smoke. There are no laws that prohibit smoking in the dorm rooms. The benefit of smoking is worth $250 to Bob, but the smoke imposes a $500 cost on Dexter. How might the Coase theorem be used to achieve an efficient outcome in this situation? In your answer, be sure to define the Coase theorem, and the conditions under which the Coase theorem may work. Answer Some goods will not be efficiently provided by the private sector because of the nature of the good itself. To discuss this we introduce the terms, rival, non-rival, excludable, and non-excludable. A good is rival in consumption if the fact that one person is consuming the good means that someone else A good is non-rival in consumption if the fact that one person is consuming the good does not prevent A good is excludable if it is possible to prevent some people from consuming the good if they don’t pay for it.. A good is non-excludable if it is difficult or impossible to prevent someone from consuming it once it is Up to this point in this course, we have been considering private goods. Private goods are both rival and excludable. Public goods, on the other hand, are non-rival and non-excludable. Examples are a fireworks Why does the private system fail to provide the efficient amount of public goods? There are two reasons: Free-rider problem: if a good is non-excludable, then anyone can use it once it is produced. Therefore, any particular person does not have an incentive to help pay for the good Drop-in-the-bucket-problem: If a public good is consumed by a large number of people, then everyone’s contribution to the good is very small relative to its total value. Optimal Provision of Public Goods In order to determine how much value society places on different quantities of a public good, we start with the individuals’ demand curves for the good. An individual’s demand curve for a public good is just the same as his/her demand curve for any other good. It relates the amount of the public good that the individual would like are willing to pay the average value of a car in the market for a car of unknown quality. Since half of the cars are valued at $2000 and half the cars are valued at $4000, the average value of car in the market is $3000. If buyers are willing to pay only $3000 for a car, it is unlikely that anyone would be willing to sell a "plum" (since it is worth $4000). In this case, only "lemons" would be sold. This result is called Adverse Selection. Adverse selection refers to a situation where the less informed side of the market must choose from a selection of The adverse selection problem can be corrected in several ways: Increasing information: Websites like carfax.com attempt to provide buyers with more information about the knows that any costs that are incurred because of lax maintenance will be paid by the issuer of the warranty. Public Goods - Practice Question 1 What are the differences between public and private goods? Give an example of each type of good. Answer Public Goods - Practice Question 2 What is the free-rider problem? Answer Public Goods - Practice Question 3 Answer Asymmetric Information - Practice Question 1 What are the two types of asymmetric information discussed in your textbook? Define and give an example of each. Answer >> OK. In this video we're going to explore another source of a market failure. OK? And this involves what we call public goods. So to understand what public goods are we need to understand two different characteristics of public goods. OK. The first is called non-rival. OK? And what this means is that a good is non-rival in consumption if the fact that one person is consuming the good does not prevent another person from consuming it also. OK? So to give you a counterexample. Suppose I eat a cheeseburger. Well if I consume that cheeseburger you can't consume it also. OK? We would say that a cheeseburger is rival in consumption. But suppose I'm watching a television show. You can be sitting in the same room with me and watching the same show. So the fact that I'm consuming the good does not prevent you from consuming it. You can think like lots of things like this. For example, a fireworks show is a great example. And when the fireworks are going off I can watch it. But the fact that I'm watching it doesn't prevent you from And let's come up with some examples here. Like I said a good that's rival and excludable would be a cheeseburger. [ Writing ] OK. We already discussed that it's rival. If I eat it you can't eat it. OK? So that's what the rival means. The excludable part is that you have to pay for it. You cannot go to Wendy's and get a cheeseburger without [ Writing ] OK. So I can't park in the same place that you park. So it's rival. But if there are open spaces anybody can OK. So two cows can't graze at the same place but if one moves then the other one can graze there. They're non-excludable but you can't do it at that same time. Just like I can't fish in your fishing hole at the same time. But if you leave then I can. OK? Because if it's free, I don't need a license or anything like that, that would fall into the idea of rival and non-excludable. Non-rival and non-excludable are what we call pure public goods. And these include things like a fireworks show- And under this my band goes to play in the Outer Banks every summer. We have a great time doing that at the Outer Banks in North Carolina and there are lots of lighthouses there. And the purpose of a lighthouse is to prevent ships from wrecking so they know where the coastline is. In fact, there are a number of shipwrecks, thousands of them actually, at the Outer Banks, but the lighthouses that are there probably prevented many more. So think about it. If one ship is seeing the lighthouse and it's helping them know where the shore is that doesn't prevent another ship from doing it. And when the light is turned on you can't prevent a shi or a "plum." And by a plum we mean high quality-- so it's a good car, runs well. Okay? So let's suppose a typical buyer would be willing to pay $2,000 for a lemon-- so if it's a lemon and they knew it, a low quality car, they'd be willing to pay $2,000. But if it were a plum and they knew it, then they would be willing to pay $4,000. Okay? So let's suppose that's a typical buyer. And let's also suppose that the buyers believe that there's a 50-50 chance that it's a lemon or a plum. Okay? So buyers think [typing] that there is a 50% chance of each type of car. Okay? Now you may need to know a little about probability and expected value to really do this carefully but basically if you are a risk-neutral buyer, and this is your willingness to pay and you believe there's a 50-50 chance, then on average a typical buyer like that would be willing to pay $3,000 for a car. Okay? They think there's a 50% chance that they would be will to-- that would get a lemon. And a 50% chance alright. Suppose it turns out that a price of $3,000, let's say there's 20 cars that are sold. Fifteen of the car turn out to be lemons. Okay? Now this is not unreasonable. So I'm going to put this point here. You've got to figure people that most people that knew they had a plum would kind of unwilling to sell it for [ Silence ] and I'll label this in a minute. And now the buyers are going, "Wait a minute. It's not a 50-50 chance, there's not a 50-50 chance that I get a lemon or a plum. If 5 are plums and 15 are lemons, well that means that ¼ of them are plums and ¾ are lemons." So the buyer is going to reassess how much they're going to offer. Okay? So they're going to recalculate their probabilities. So now they believe that there's a 75% chance Okay? Now I can start to draw supply curves here. This would be the supply of lemons. Okay? That different price is in the amount that are sold. And here's the supply of plums Whoops, that should be a P. Okay, now here's the upshot of this. Now 3 and 12, that's only a 20% chance. Now I think there's an 80% chance that I get a lemon [calculating] and only a 20% chance that I get a plum. So I'm only going to offer $800 plus $1600 is $2,000 let's see $800 plus $600, $2,400. So now the price I offer is $2,400, okay? As, now here's the upshot of what's happening. Okay, so now listen carefully to what I'm going to explain. As the buyers begin to realize that fewer and fewer cars in percentage terms are of high quality, they start offering less and less. As they start offering less and less, even more good cars come off the market. So when the price goes down, that the buyers are offering, fewer and fewer of the cars are actually good cars. The people who own the good cars and know it are less and less likely to sell it as the price the buyers offer goes down. And leads to something that we call an " In this lesson, we will explore the effects of a per-unit excise tax. An excise tax is a tax on a particular product such as gasoline or tobacco. A per-unit excise tax is a tax of a certain amount, t, on each unit of the product sold. So for example, the government might set a tax of $.50 per gallon of gasoline, or $2.00 per pack of cigarettes. Legal incidence of a tax: The legal incidence of a tax refers to who pays the tax according to the law. If the law states tha Economic incidence of a tax: The economic incidence of a tax refers to who actually ends up paying the tax. As we shall see, this can be very Figure 1 A per-unit excise tax equal to t which is levied on the consumers of a good will shift the demand curve down (decrease in demand) by an amount exactly equal to t. To understand this, recall that a demand curve can be interpreted as telling us the maximum amount a consumer is willing to pay per unit of a good to buy a certain quantity of the good. For example, if the demand for a good is given by the equation P = 20 – Q, then the maximum price that a consumer would be willing to pay for, say 4 units of the good is $16 per unit. >> Okay, in this section we are going to study an excise tax. Okay and how that plays out between the consumers and the producers. So first of all, let's define what we mean by an excise tax. So an excise tax is just a tax on a particular product. For example, we have excise taxes on gasoline and on tobacco. So it's not an income tax, we're not taxing the income. And it's not even like a sales tax that depends on how much you spend on all goods. This is a tax on a particular product. And we're going to study the simplest type of an excise tax, which is a per-unit excise tax. Okay. So this is a quantity tax. It's a tax based on the quantity of the goods sold. A per-unit excise tax is a tax of a particular amount. And we'll call it t, little t, per unit of the good that is sold. Like, for example. Maybe we'll tax gasoline $0.50 per gallon or tobacco $0.75 per pack of cigarettes. So it depends on the quantity of the good that you buy, will determine how much you actually pay in t Okay. So -- [ ] All right. So we have the price and the quantity. Okay. So let's say we have a demand curve for a product. It looks something like this maybe. [ ] Okay? Now it'll be helpful as we go through this analysis if you think of the money that the consumer actually pays as being in two parts. One part is the price, and that's the part that goes to the suppliers, to the oil company or to the tobacco company. The other part of what they pay is the tax. Okay? Remember, in this example, we're levying, putting the legal incidences on the consumers. Okay. So. If the most I'm willing to take out of my bank account, swipe off of my debit card, to take out of my wallet is P1 per unit to buy Q1 units. Now if I have to pay a tax equal to t, then the most I'm going to be willing to pay would be -- let's say the tax is this amount. [ ] P1 minus t. See if this makes sense to you. Now the price I'm willing to pay is P1 minus t because I have to pay that, quantity of Q2. At this quantity, the most that I'm willing to pay. I take out of my bank account, take out of my wallet is P2 -- Okay? So we'll call this D prime and this amount right here, the vertical distance between the two demand curves is exactly equal to t. Okay? So. The tax levied on the consumers shifts the demand curve down by an amount exactly equal to t. All right. So this is going to be very helpful in our analysis. Because if we know the equation for the original demand curve, we will be able to find the equation for the new demand curve, simply by subtracting t from the vertical intercept. It's a parallel shift, so the slope stays the same. So if we know the original demand curve equation, and we know the amount of t, we can quickly find the equation for the new demand curve. And that's how we're going to begin our analysis of this per-unit excise tax. Before the tax, we can find the equilibrium quantity by setting 20-Q = 4 +3Q. Solving for Q, we get Q*= 4. Substituting this back into either the demand or the supply equation and solving for P, we get P*= 16. After the tax, we can find the new quantity sold by setting 16 – Q = 4 +3Q. Solving for Q, we get Q* = 3. Substituting this into either the original supply equation or the new demand equation, we get Pt = $13, where Pt is the price that the sellers receive. How much will the buyers pay? Buyers will pay the price Pt+ t, where t = $4 is the amount of the per-unit excise tax. So buyers will pay $13 + $4 = $17. Note that both the buyers and the sellers are worse off. In this case, buyers are paying $1.00 more and getting 1 less unit of the good than they did before the tax, and sellers are receiving $3 less and selling one unit less than before. Now we are in a position to discuss the economic incidence of the tax. Of the $4 taxed on each unit of the good, sellers are paying $3, and buyers are paying $1. So buyers are paying 25% of the tax, and sellers are paying 75% of the tax. The government receives $12 in tax revenue. Since the government collects $4 on each unit of the good sold, and since 3 units are sold, the government collects $4 X 3 = $12 . The outcome after the tax is shown in Figure 2 at the right. In order to evaluate the welfare effects of the tax, we have to determine consumer and producer surplus. These concepts were covered in Lesson 8. The consumer surplus before the tax is the area under the original demand curve (D0) and above the equilibrium price (P*). This area is given by [(20-16) X 4]/2 = $8. Producer surplus before the tax is given by the area under the equilibrium price (P*) and above the supply curve. This area is given by [(16 – 4) X 4)]/2 = $24. So total surplus before the tax is equal to CS + PS = $8 + $24 = $32. [ ] So $10 per unit. [ ] Okay. So we're going to levy a $10 per-unit excise tax on the consumers. Now remember what we found out in the last video. This is going to shift the demand curve down by an amount exactly equal to the tax. [ ] -- would be P is equal to 50 minus one-half Q. Okay? All I did was subtract $10 from the vertical intercept. Okay? Now the next thing we want to do here is find out what the economic incidence of the tax is. What proportion of the tax is paid by sellers and what proportion is paid by buyers? Okay. To figure that out, we're going to compare what the sellers receive after the tax to what they received before the tax. Okay? So that was $30. Now they only get $26. So for each $10 that's being paid, the sellers are paying $4. They're $4 worse off. They used to get $30; now they only get $26. The buyers, on the other hand, used to pay $30, and now they pay $36. So they're paying $6 out of every $10. So we can get the economic incidence of the tax. The portion would be, in this example, sellers pay four-tenths of the tax, $4 out of every $10 or 40 percent. And the buyers pay, they used to pay $30; now they pay $36. So that's $6 out of every $10 or 60 percent. Okay. So in this example sellers pay 40 percent; the buyers pay 60 percent. Okay. So we're going to graph this in the next video and then later, we will figure out what determines these [inaudible]. Okay? So that's going to be an important part of our analysis. Practice Problem 1: Results of a Per-Unit Excise Tax Suppose the market supply and demand for guitars in Happy Valley are given by: Demand: Q= 4,000 - 4P Supply: Q = -200 + P A) Calculate the equilibrium price and quantity of guitars. B) What is the price elasticity of demand at the equilibrium price and quantity? C) What is the price elasticity of supply at the equilibrium price and quantity? For the remaining questions, suppose a tax of $10 per guitar is levied on the consumers. D) What proportion of the tax will be paid by consumers? E) How much will consumers pay for guitars after the tax? F) How much will producers receive after the tax? Set quantity supplied equal to quantity demanded and solve for Q: -200 + P = 4000 - 4P, so 5P = 4200 and P = 840. Substitute P = 840 into either equation to get Q: Q = -200 + 840 = 640. B) - 5.25 Price elasticity of demand: Use the point formula for the elasticity of demand -- e = (1/slope of demand curve)(P/Q). To get slope of demand curve solve for P. e = (1/(-1/4))(840/640) = (-4)(840/640) = -5.25. C) 1.3125 Price elasticity of supply: Use the point formula for the elasticity of supply -- e = (1/slope of supply curve)(P/Q). To get slope of supply curve solve for P. D) The consumers will pay 1/5 (.2) of the tax Subtract the tax from the demand equation P = 1000 -(1/4)Q to get P = 990 - (1/4)Q. Now set quantity demanded equal to quantity supplied to find the equilibrium quantity: E) The consumers will pay the equilibrium price($840), plus 1/5 of the $10 tax($2), so consumers will pay $842 per guitar F) Sellers will receive the equilibrium price($840), minus 4/5 of the tax($8), so sellers will receive $832 per guitar Alternative Method for Completing Parts D), E), and F) D) The formula (given in the video above) for the fraction of the excise tax paid by the buyers is: fraction of tax paid by buyers = (elasticity of supply)/(absolute value of elasticity of demand + elasticity of supply). The elasticity of demand is -5.25 and the elasticity of supply is 1.3135, so the fraction of the tax paid by the buyers is 1.3125/(5.25 + 1.325) = .2 The tax is 10 so the amount of the tax paid by the buyers is (.2)(10) = 2. The rest of the tax must be paid by the sellers, so they pay the other 1 - .2 = .8 of the tax. The amount of tax that the sellers pay is (.8)(10) = 8. E) The after-tax price paid by the buyers is the original (before-tax) price plus the amount of the tax paid by the buyers, so it is 840 + 2 = 842. F) The after-tax price received by the sellers is the original (before-tax) price minus the amount of the tax paid by the sellers, so it is 840 - 8 = 832. >> Okay, in this video, we are going to evaluate a per unit excise tax. An excise tax is a tax on a particular commodity, such as alcohol or tobacco or gasoline. A per unit excise tax is a certain amount that we'll call T that is levied on each unit of the good that is bought. For example, 40 cents per gallon of gasoline [Show More]
Last updated: 1 year ago
Preview 1 out of 99 pages
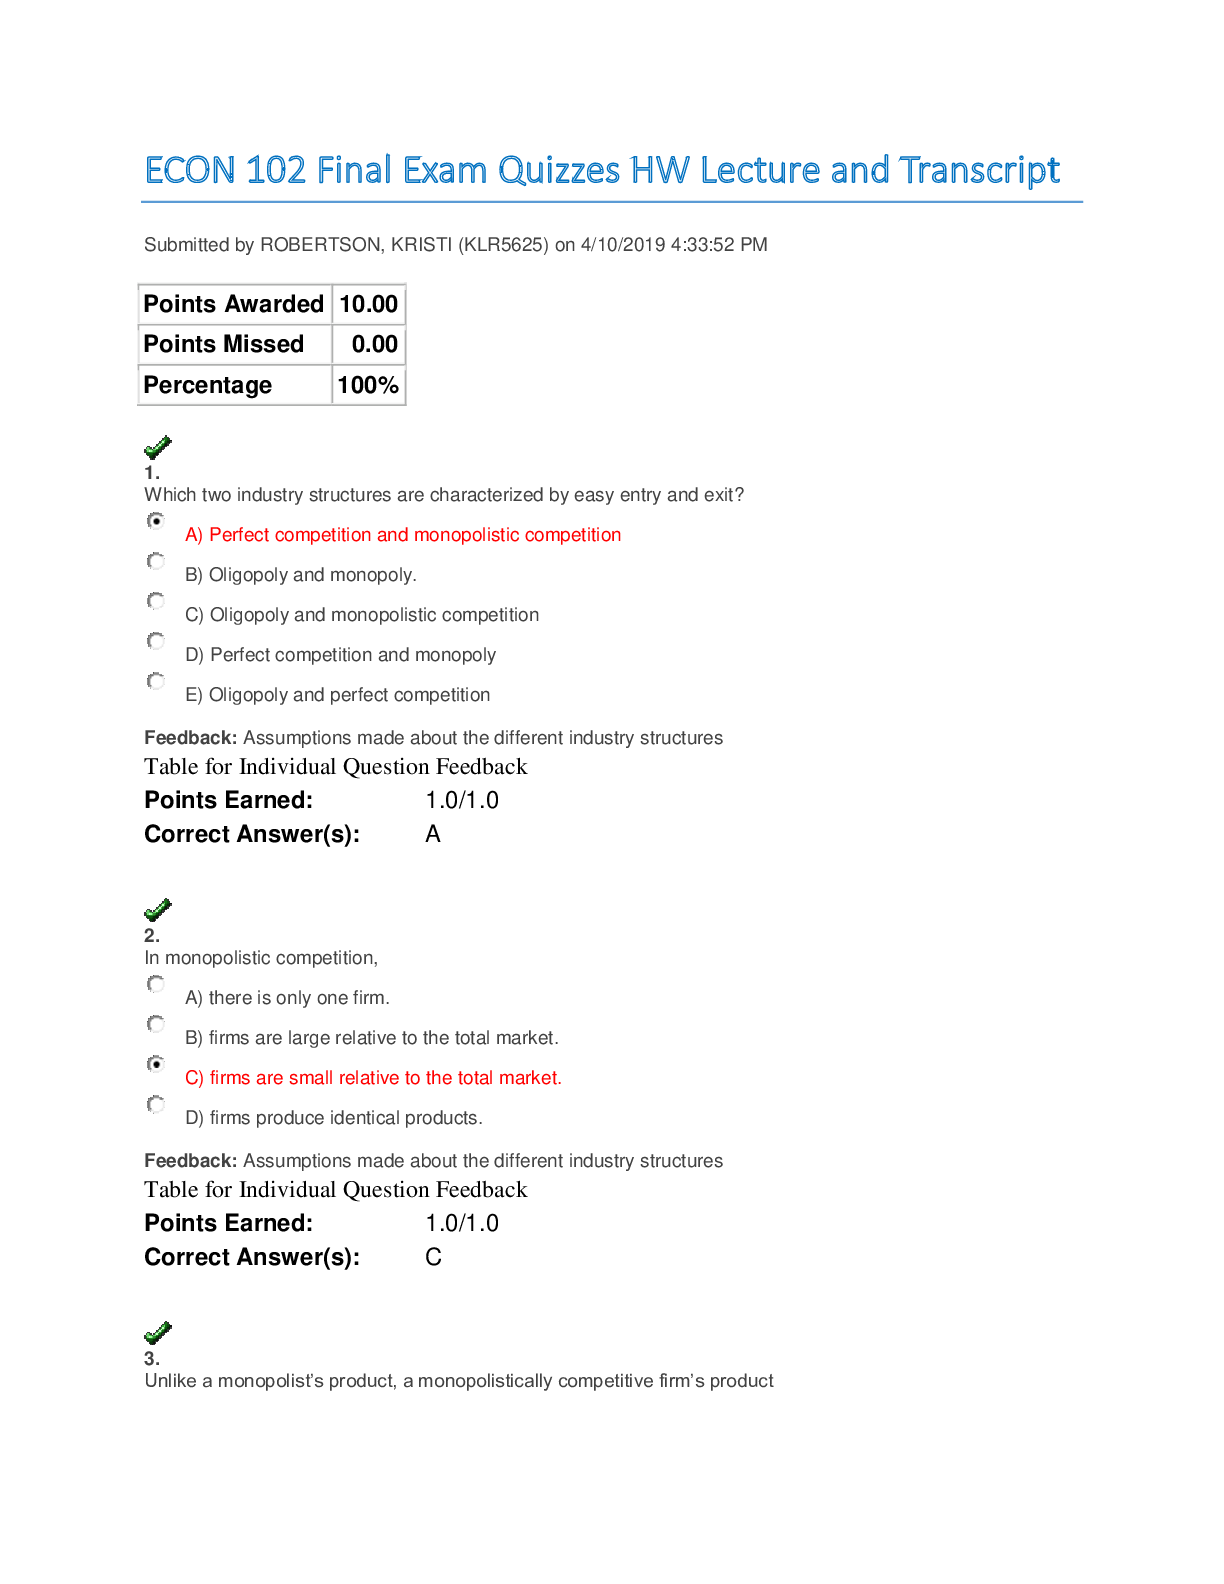
Reviews( 0 )
Recommended For You
Business Research> Dissertation > Analysis of the economic impact of domestic tourism development for Yunnan (All)

Analysis of the economic impact of domestic tourism development for Yunnan
This paper tackles the research methodology section of the research topic above
By Augustine , Uploaded: Oct 29, 2020
$6
Medical Studies> Dissertation > Pharmacotherapy Principles and Practice, 6th Edition, By Marie Chisholm-Burns, Terry Schwinghammer, Patrick Malone, Jill Kolesar, Kelly Lee, Brandon Bookstaver (eBook PDF) (All)

Pharmacotherapy Principles and Practice, 6th Edition, By Marie Chisholm-Burns, Terry Schwinghammer, Patrick Malone, Jill Kolesar, Kelly Lee, Brandon Bookstaver (eBook PDF)
All the main concepts from the landmark Pharmacotherapy: A Pathophysiologic Approach—distilled down to a concise, clinically focused, full-color resource Providing a solid evidence-based approach,...
By eBookSmTb , Uploaded: Dec 06, 2022
$25
Business> Dissertation > One Belt One Road (OBOR): From the Eyes of the General Public of China. Graded A (All)
One Belt One Road (OBOR): From the Eyes of the General Public of China. Graded A
Abstract China is among one of the world fastest growing economy. Over the last few years China has made some great milestones towards expanding economically by shifting from a low-production economy...
By QuizMaster , Uploaded: Jul 09, 2020
$21
Mathematics> Dissertation > MATH 221 Week 1 Discussion: Posts | Download To Score An A (All)

MATH 221 Week 1 Discussion: Posts | Download To Score An A
Describe the difference between bar charts, histograms, Pareto charts, including how they are … and in what situations are each most effectively … ? Given the following data points, describe the step...
By A+ Solutions , Uploaded: Jul 18, 2022
$8.5
Sociology> Dissertation > MULTI-AGENCY WORKING (All)
MULTI-AGENCY WORKING
Introduction I work as a drug and alcohol counsellor for Cora and Sammy. I am a member of multi-agency expert service. The collaboration across agencies or the multi-agency working (MAW), provides su...
By AdmissionLlabs , Uploaded: Apr 15, 2022
$5
Art> Dissertation > Internally cooled membrane air conditioning system performance simulation (All)
Internally cooled membrane air conditioning system performance simulation
The purpose of this project is to carry out a theoretical study about the internal cooling effect on the membrane air conditioning system performance by developing mathematic model and simulation prog...
By Tutor Kraft , Uploaded: Apr 04, 2022
$14.5
Mathematics> Dissertation > Pearson Edexcel GCE Question Booklet + Mark Scheme (Results) November 2021 In Mathematics (9MA0) Paper 02 Pure Mathematics 2 (All)
.png)
Pearson Edexcel GCE Question Booklet + Mark Scheme (Results) November 2021 In Mathematics (9MA0) Paper 02 Pure Mathematics 2
Pearson Edexcel GCE Question Booklet + Mark Scheme (Results) November 2021 In Mathematics (9MA0) Paper 02 Pure Mathematics 2
By Muchiri , Uploaded: Mar 12, 2022
$10
Business> Dissertation > BSB41515 Certificate IV in Project Management LATEST 2021/2022 (All)

BSB41515 Certificate IV in Project Management LATEST 2021/2022
BSB41515 Certificate IV in Project Management LATEST 2021/2022
By A+ Grades , Uploaded: Aug 11, 2021
$15
Business> Dissertation > Google Inc Internal Environment Marketing Essay LATEST 2021/2022 (All)

Google Inc Internal Environment Marketing Essay LATEST 2021/2022
Google Inc Internal Environment Marketing Essay LATEST 2021/2022
By A+ Grades , Uploaded: Aug 11, 2021
$12
Business> Dissertation > Does Social Media influencer affect consumer purchasing decisions? A study on YouTube endorsement in beauty? LATEST 2021/2022 (All)
.png)
Does Social Media influencer affect consumer purchasing decisions? A study on YouTube endorsement in beauty? LATEST 2021/2022
Social media is now on the frontline in the marketing of goods and services in the business industry. This has mainly been promoted by the advancement of technology which has now made the world a gl o...
By A+ Grades , Uploaded: Aug 11, 2021
$15
Document information
Connected school, study & course
About the document
Uploaded On
Oct 02, 2020
Number of pages
99
Written in

Additional information
This document has been written for:
Uploaded
Oct 02, 2020
Downloads
0
Views
132