Mathematics > EXAM > MATH 110 Module 1 Statistics Portage Learning Quiz,100% CORRECT (All)
MATH 110 Module 1 Statistics Portage Learning Quiz,100% CORRECT
Document Content and Description Below
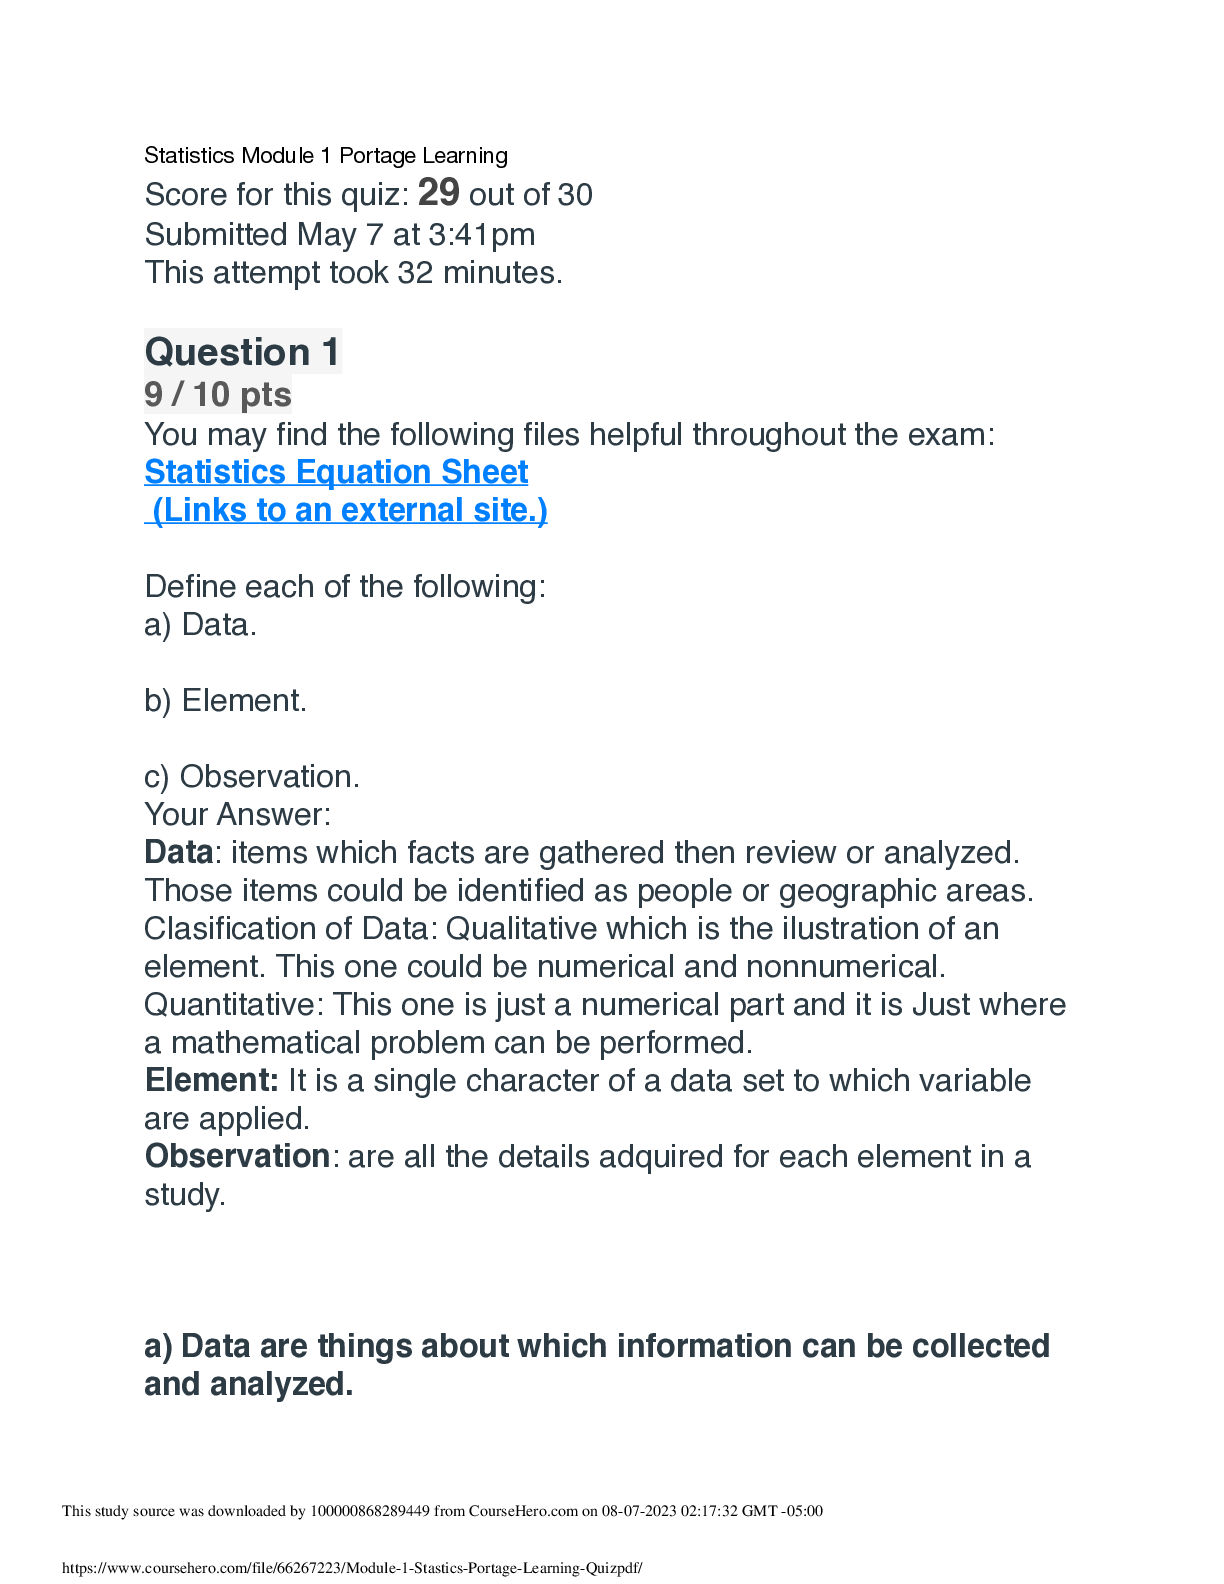
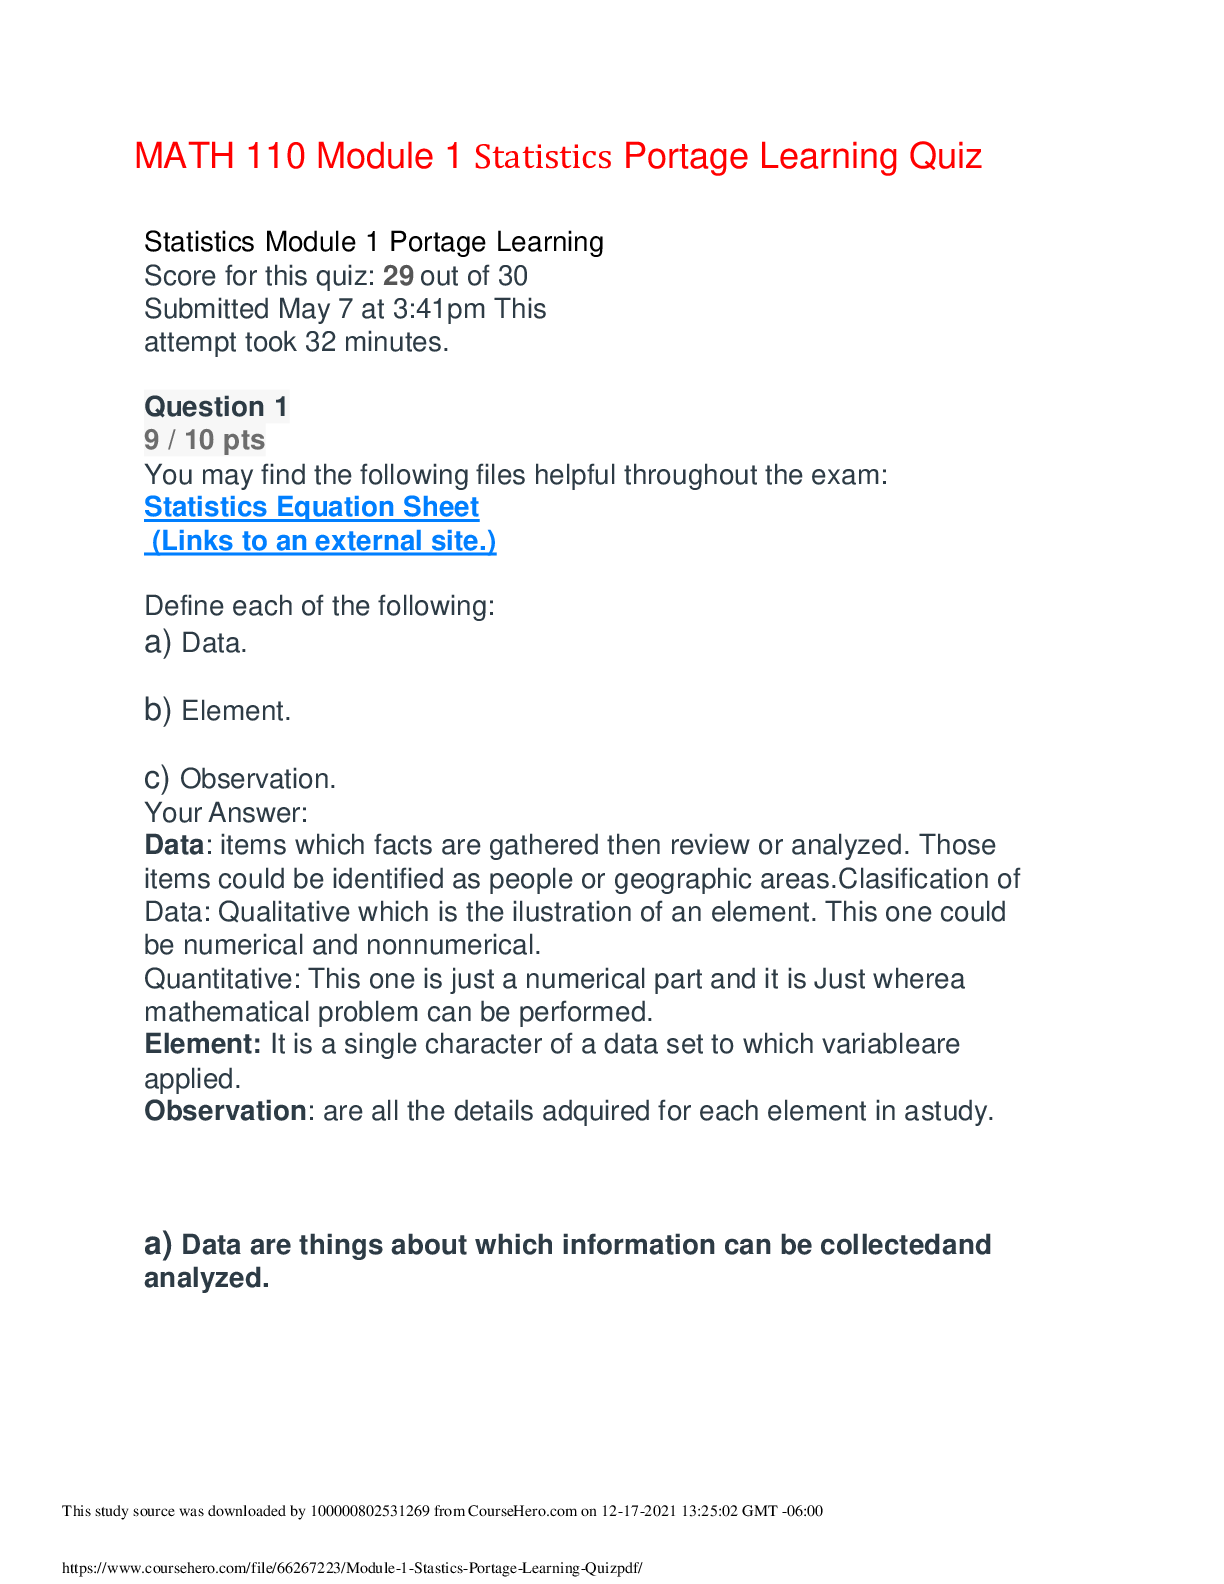
MATH 110 Module 1 Statistics Portage Learning Quiz Statistics Module 1 Portage Learning Score for this quiz: 29 out of 30 Submitted May 7 at 3:41pm This attempt took 32 minutes. Question 1 9 /... 10 pts You may find the following files helpful throughout the exam: Statistics Equation Sheet (Links to an external site.) Define each of the following: a) Data. b) Element. c) Observation. Your Answer: Data: items which facts are gathered then review or analyzed. Those items could be identified as people or geographic areas. Clasification of Data: Qualitative which is the ilustration of an element. This one could be numerical and nonnumerical. Quantitative: This one is just a numerical part and it is Just where a mathematical problem can be performed. Element: It is a single character of a data set to which variable are applied. Observation: are all the details adquired for each element in a study. a) Data are things about which information can be collected and analyzed. b) The element of a data set is simply the individual and unique entry in a data set about which data has been collected, analyzed and presented in the same manner. c) An observation is all the information collected for each element in a study. Question 2 5 / 5 pts You may find the following files helpful throughout the exam: Statistics Equation Sheet (Links to an external site.) Explain outliers. Your Answer: Outliers are scientific skills that help us to identify when data is out of line either because it is too big or to small in a range of numbers. Example: is when in a graphical or tabular or even in a 3D pie chart numbers were switched or numbers were misplaced. Also if a questionarie: questions has been errouneously answered. Scientifc or reseacher need to be able to identify those data error in the case study. An outlier is a value which is out of place compared to the other values (for example, it may be too large or too small compared to the other values). Question 3 5 / 5 pts You may find the following files helpful throughout the exam: Statistics_Equation_Sheet (Links to an external site.) Look at the following data and see if you can identify any outliers: 7 8 2 4 5 65 9 10 3 11 71 15 16 19 17 Your Answer: 2, 3, 4, 5, 7, 8, 9, 10, 11, 15, 16, 19, 17, 65, 71 The outliers here are: 65 & & 71 The outliers are: 65 71 Question 4 10 / 10 pts You may find the following files helpful throughout the exam: Statistics_Equation_Sheet (Links to an external site.) The following pie chart shows the percentages of total items sold in a month in a certain fast food restaurant. A total of 2900 fast food items were sold during the month. a.) How many were burgers? b.) How many were fish? Your Answer: Problem a: 2900 (0.12) =348 were burgers Problem b: 2900(0.28) = 812 were fish a.) Burgers : 2900(.12) = 348 b.) Fish : 2900(.28) = 812 [Show More]
Last updated: 1 year ago
Preview 1 out of 5 pages
Instant download
Buy this document to get the full access instantly
Instant Download Access after purchase
Add to cartInstant download
Reviews( 0 )
Document information
Connected school, study & course
About the document
Uploaded On
Jan 04, 2022
Number of pages
5
Written in

Additional information
This document has been written for:
Uploaded
Jan 04, 2022
Downloads
0
Views
49