Mathematics > DISCUSSION POST > MATH 225N Week 2 Discussion Already Scored A (All)
MATH 225N Week 2 Discussion Already Scored A
Document Content and Description Below
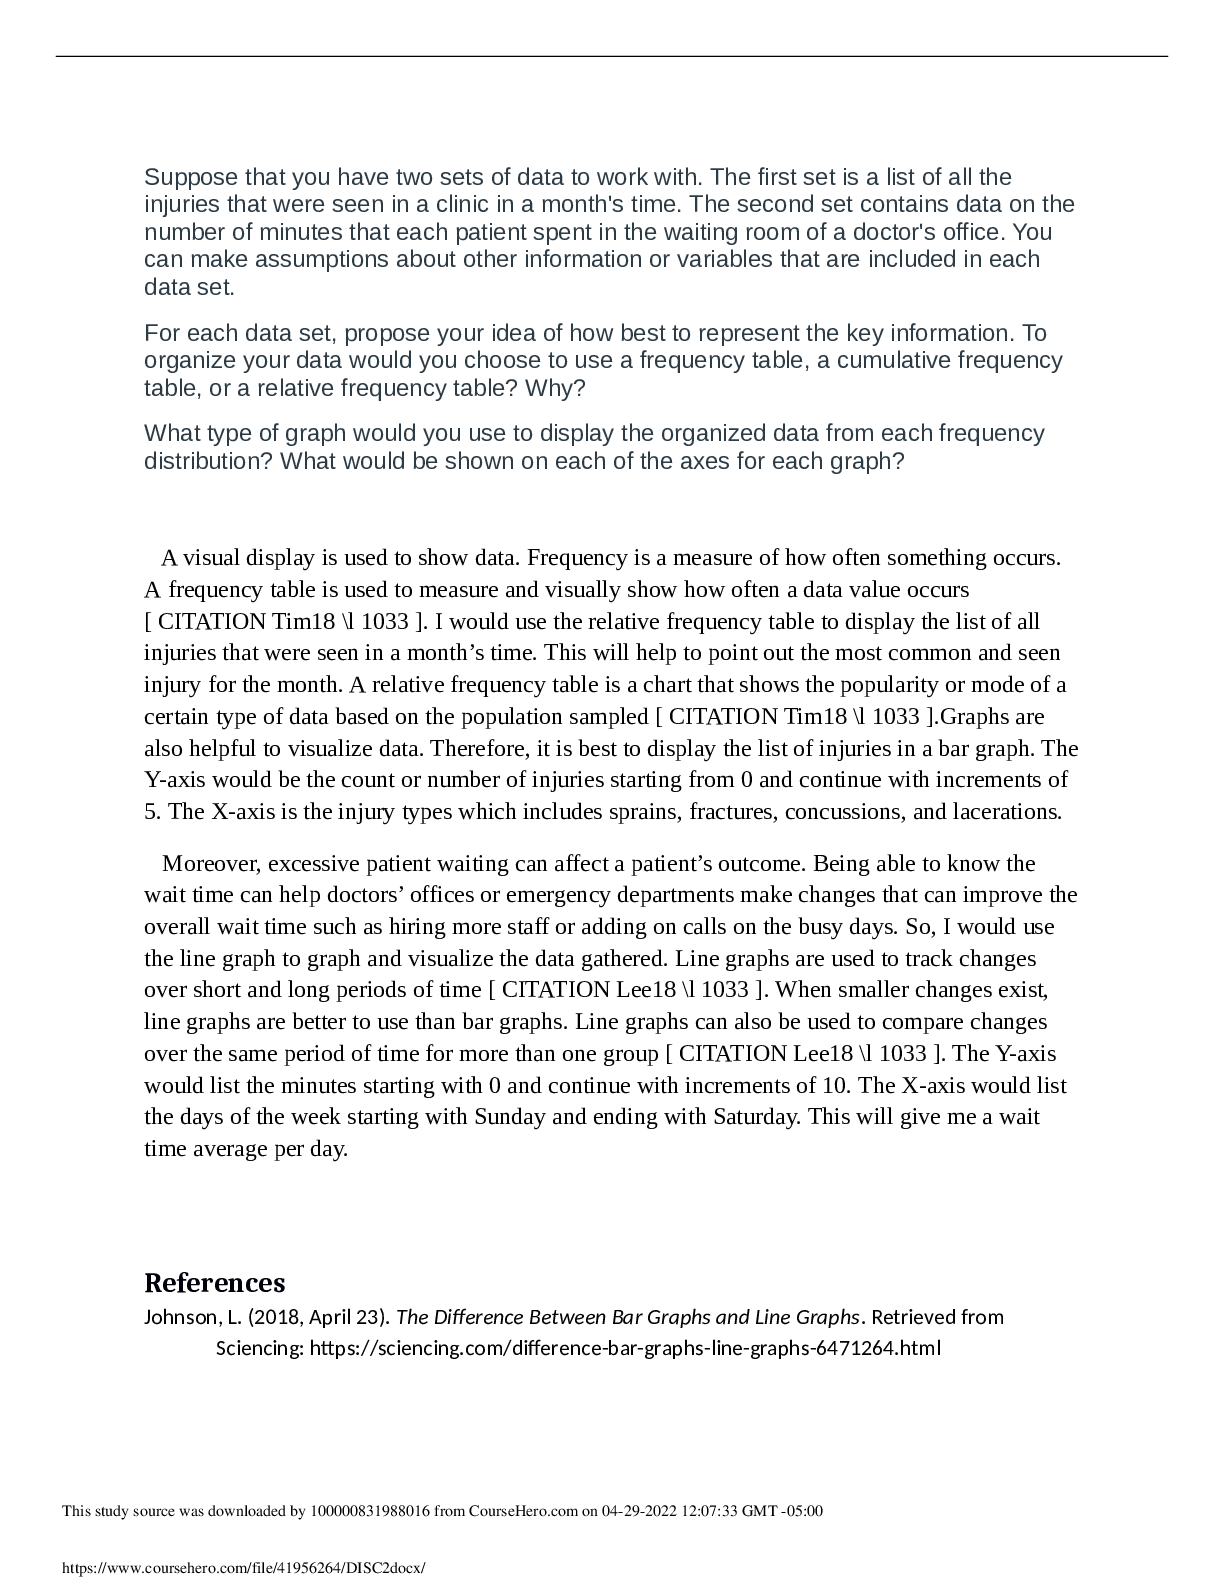
Suppose that you have two sets of data to work with. The first set is a list of all the injuries that were seen in a clinic in a month's time. The second set contains data on the number of minutes t... hat each patient spent in the waiting room of a doctor's office. You can make assumptions about other information or variables that are included in each data set. For each data set, propose your idea of how best to represent the key information. To organize your data would you choose to use a frequency table, a cumulative frequency table, or a relative frequency table? Why? What type of graph would you use to display the organized data from each frequency distribution? What would be shown on each of the axes for each graph? A visual display is used to show data. Frequency is a measure of how often something occurs. A frequency table is used to measure and visually show how often a data value occurs [ CITATION Tim18 \l 1033 ]. I would use the relative frequency table to display the list of all injuries that were seen in a month’s time. This will help to point out the most common and seen injury for the month. A relative frequency table is a chart that shows the popularity or mode of a certain type of data based on the population sampled [ CITATION Tim18 \l 1033 ].Graphs are also helpful to visualize data. Therefore, it is best to display the list of injuries in a bar graph. The Y-axis would be the count or number of injuries starting from 0 and continue with increments of 5. The X-axis is the injury types which includes sprains, fractures, concussions, and lacerations. Moreover, excessive patient waiting can affect a patient’s outcome. Being able to know the wait time can help doctors’ offices or emergency departments make changes that can improve the overall wait time such as hiring more staff or adding on calls on the busy days. So, I would use the line graph to graph and visualize the data gathered. Line graphs are used to track changes over short and long periods of time [ CITATION Lee18 \l 1033 ]. When smaller changes exist, line graphs are better to use than bar graphs. Line graphs can also be used to compare changes over the same period of time for more than one group [ CITATION Lee18 \l 1033 ]. The Y-axis would list the minutes starting with 0 and continue with increments of 10. The X-axis would list the days of the week starting with Sunday and ending with Saturday. This will give me a wait time average per day. References Johnson, L. (2018, April 23). The Difference Between Bar Graphs and Line Graphs. Retrieved from Sciencing: https://sciencing.com/difference-bar-graphs-line-graphs-6471264.html This study source was downloaded by 100000831988016 from CourseHero.com on 04-29-2022 12:07:33 GMT -05:00 https://www.coursehero.com/file/41956264/DISC2docx/ Lewis, T. (2018, October 12). Frequency Tables and Histograms. Retrieved from ck-12: https://www.ck12.org/statistics/frequency-tables-and-histograms/lesson/Frequency-Tables-andHistograms-MSM8/ [Show More]
Last updated: 1 year ago
Preview 1 out of 2 pages
Buy this document to get the full access instantly
Instant Download Access after purchase
Add to cartInstant download
We Accept:

Reviews( 0 )
$8.50
Document information
Connected school, study & course
About the document
Uploaded On
Apr 29, 2022
Number of pages
2
Written in

Additional information
This document has been written for:
Uploaded
Apr 29, 2022
Downloads
0
Views
88


.png)

.png)


.png)
 – South Carolina State University.png)