Chemistry > Lab Experiment > University of Washington Chem 152 Thermodynamics 2 Lab 5 - The Temperature Dependence of the Solubil (All)
University of Washington Chem 152 Thermodynamics 2 Lab 5 - The Temperature Dependence of the Solubility Product (Ksp) - ALL ANSWERS ARE CORRECT
Document Content and Description Below
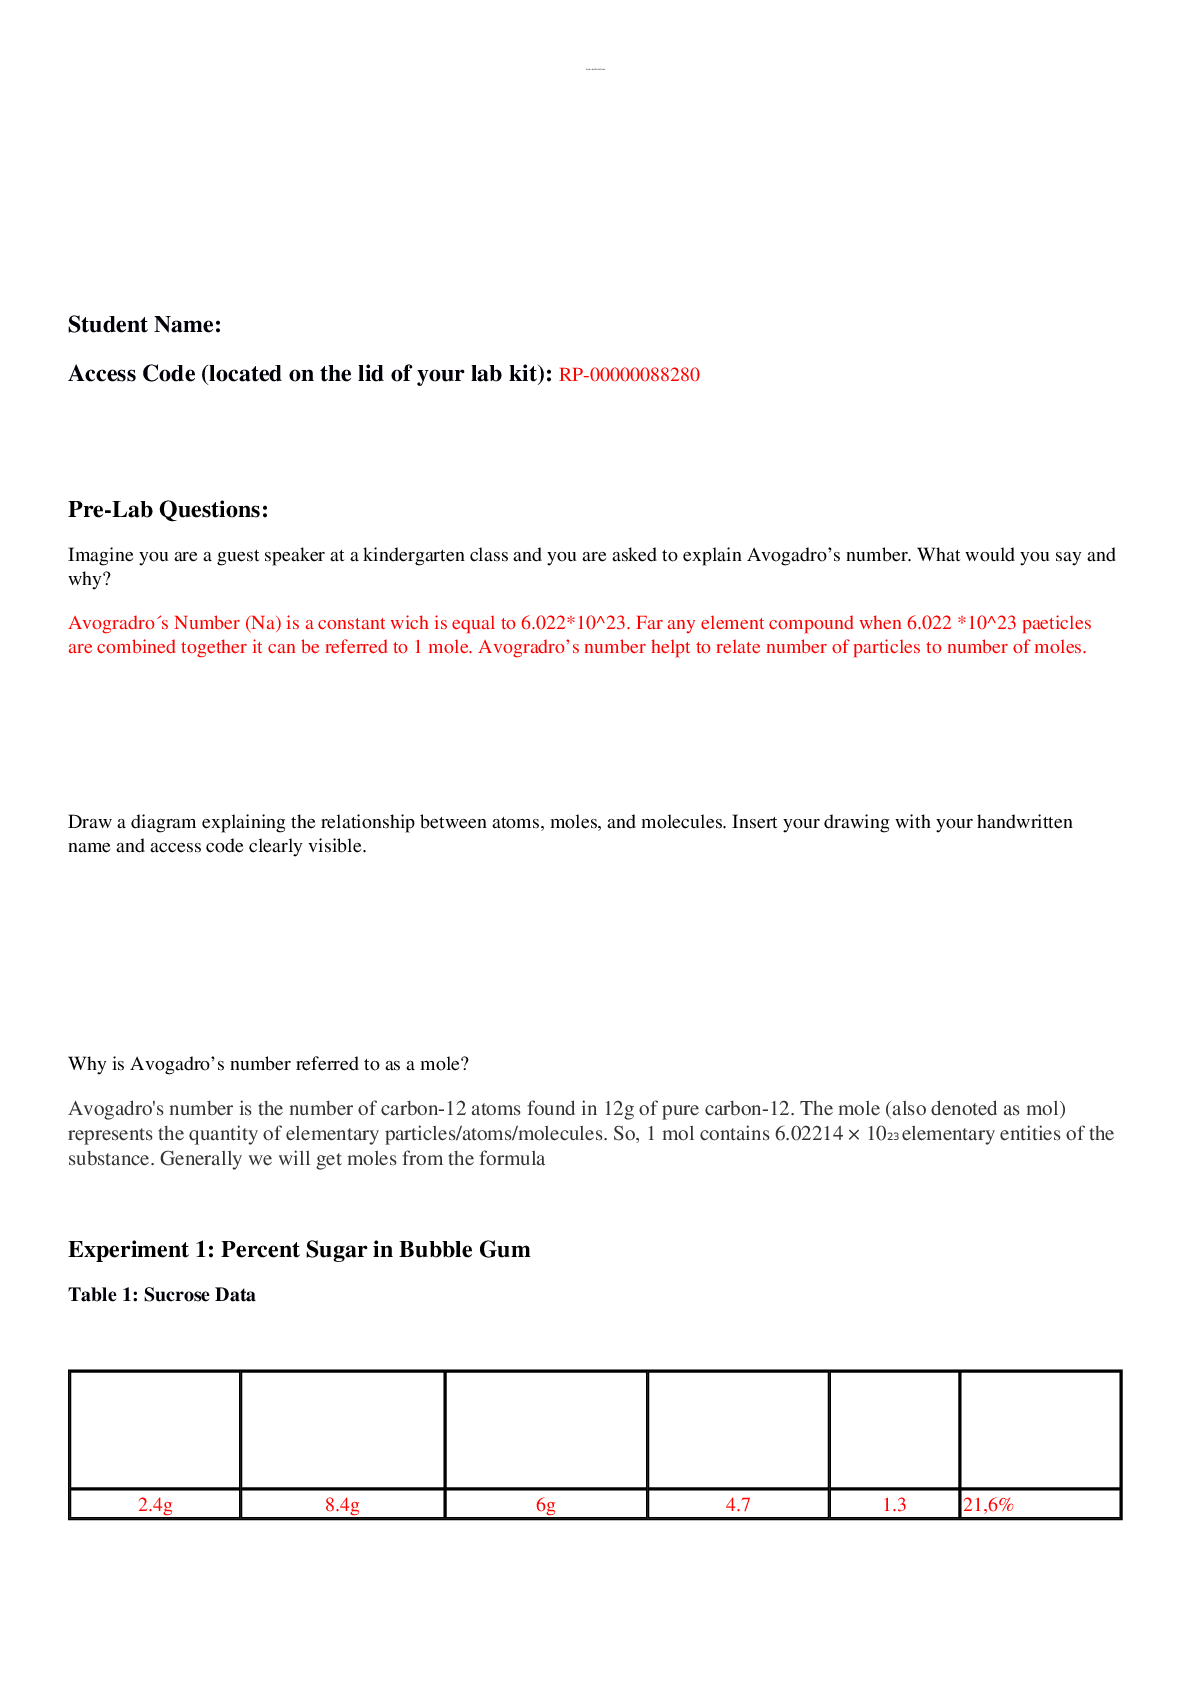
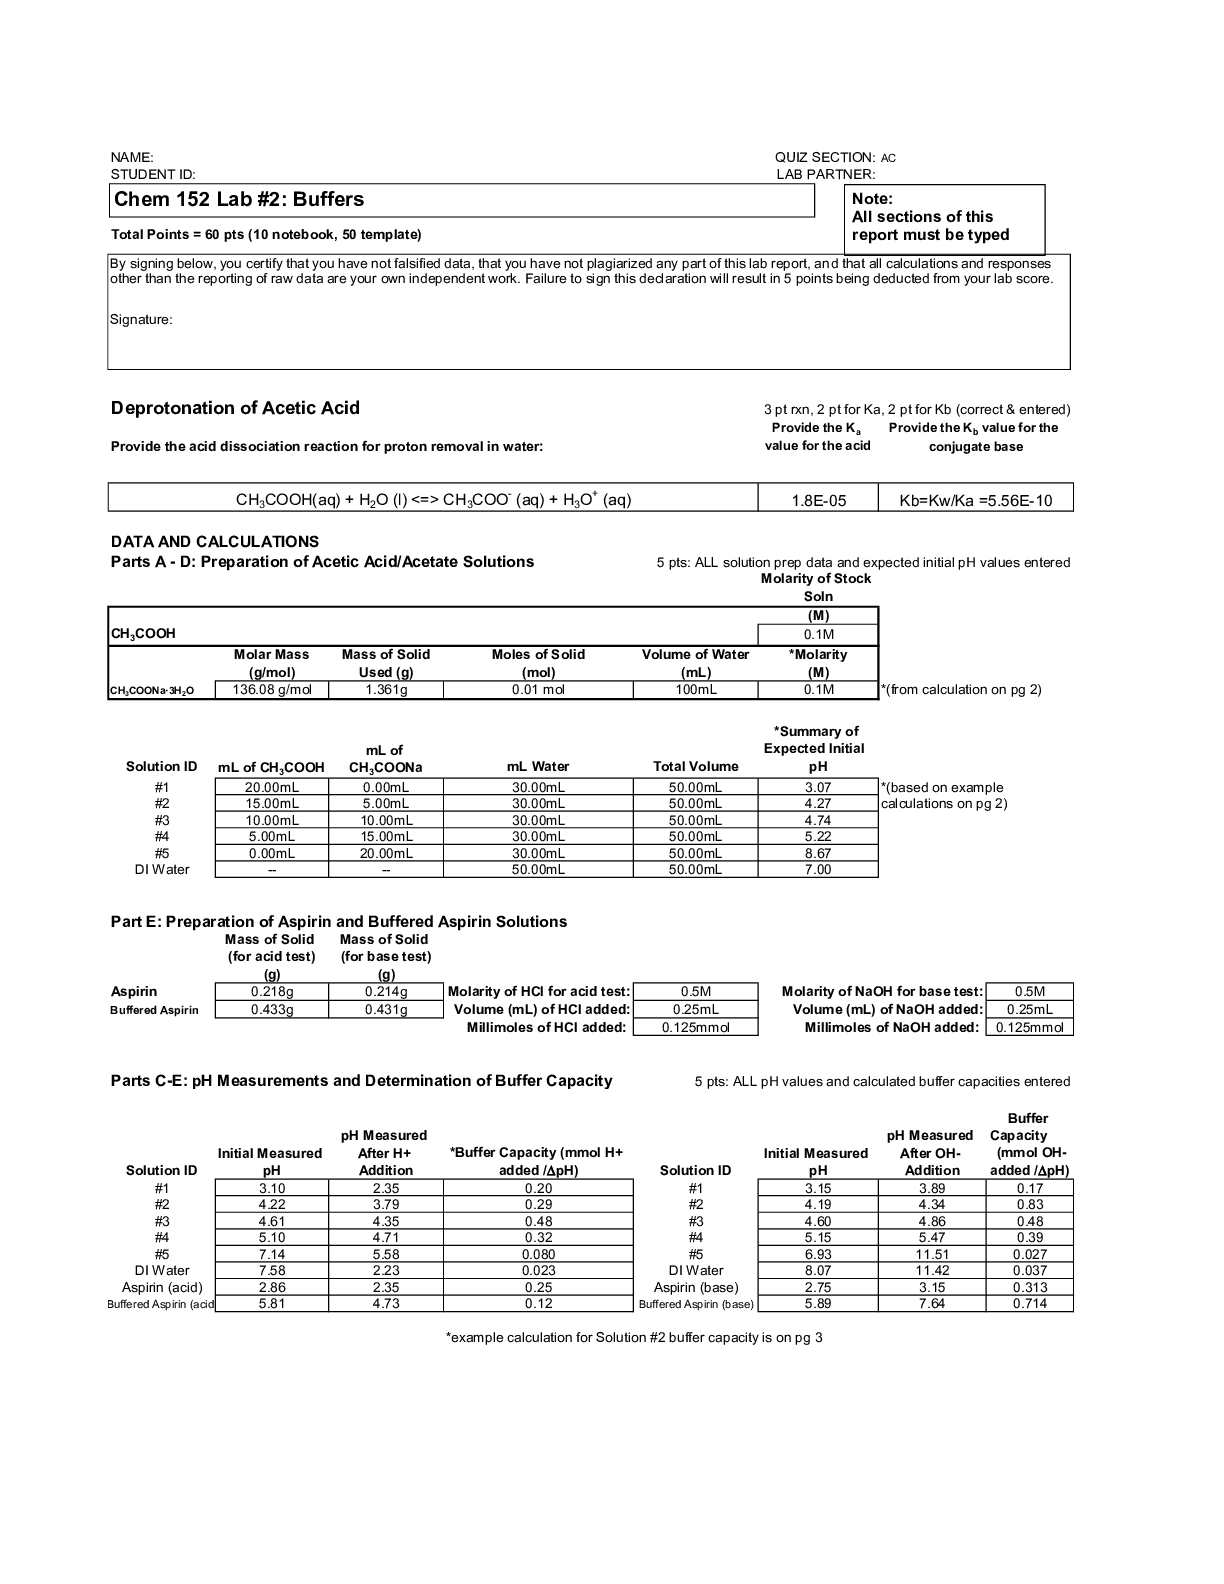
Chem 152 Experiment #5: Thermodynamics II The Temperature Dependence of the Solubility Product (Ksp) By signing below, you certify that you have not falsified data, that you have not plagiarized any... part of this lab report, and that all calculations and responses other than the reporting of raw data are your own independent work. Failure to sign this declaration will result in 5 points being deducted from your report score. Note: All sections of this report must be typed Type the calculation you used to determine [K+] in the measured and original solutions above. Intensity= (984000 M-1 )[K+ ] + 7.8 290 = (984000 M-1 )[K+ ] + 7.8 ଶ.଼ாିସ ெ ௫ = ଵ ଶହ [K+ ] = 290 -7.8 x = (2.87E-04 M)(2500) 984000 M-1 x = 0.718 M Place your calibration plot (intensity vs. concentration of K+) here. Make your plot big enough to cover this instruction box so that it is large enought for someone else to read. Add a Trendline and Trendline Eqn and on your plot and be sure to include titles for the plot and each axis. y = 984000x + 7.8 R² = 0.9998 70 120 170 220 270 320 370 6.50E-05 1.15E-04 1.65E-04 2.15E-04 2.65E-04 3.15E-04 3.65E-04 Intensity Concentration of K+ (M) Calibration Plot of Intensity vs. Concentration of K+ (M) Page 1 of 4 3 pts B. Titrations of KHP Samples With and Without KCl 1.00 mL Table 5: Titration Data and Calculations for Solutions #1-6 Solution # Temperature ( oC) Temperature (K) Initial buret reading (mL) Final buret reading (mL) mL NaOH added mmoles HP- [HP- ] (M) Ksp 1/T (K-1) ln Ksp 1 4.0 277.2 0.00 2.60 2.60 0.263 0.263 0.0692 0.00361 -2.671 2 22.6 295.8 0.00 3.25 3.25 0.328 0.328 0.108 0.00338 -2.226 3 35.4 308.6 0.00 5.20 5.20 0.525 0.525 0.276 0.00324 -1.287 4 41.6 314.8 0.00 7.10 7.10 0.717 0.717 0.514 0.00318 -0.666 5 47.6 320.8 0.00 7.35 7.35 0.742 0.742 0.551 0.00312 -0.596 6 59.4 332.6 0.00 10.00 10.00 1.010 1.010 1.020 0.00301 0.020 2 pts 2 pts 2 pts 4 pts slope -4734 K R 8.314 J/mol*K y-intercept 14.171 H o Soln 39.4 kJ/mol S o Soln 117.8 J/mol*K 2 pts 2 pts mL of KHP(aq) used in titrations of Solutions #1-6 Place your plot of ln(Ksp) vs 1/T(K) here. Make your plot big enough to cover this instruction box so that it is large enought for someone else to read. Add a Trendline and Trendline Eqn and on your plot and be sure to include a titles for the plot and each axis. Type the calculation for determining [NaOH] for Run #1. moles/liters=M [NaOH] (0.000641moles/0.00635liters)= 0.101M [NaOH] Calculate the % difference between Runs #1 and #2. (6.40-6.35)/((6.4 [Show More]
Last updated: 1 year ago
Preview 1 out of 4 pages
.png)
Reviews( 0 )
Document information
Connected school, study & course
About the document
Uploaded On
May 28, 2022
Number of pages
4
Written in

Additional information
This document has been written for:
Uploaded
May 28, 2022
Downloads
0
Views
134
.png)
.png)
.png)
.png)