Mathematics > QUESTIONS & ANSWERS > CW4 Answer Sheet (Final) - University of Massachusetts, Amherst OIM 320 (All)
CW4 Answer Sheet (Final) - University of Massachusetts, Amherst OIM 320
Document Content and Description Below
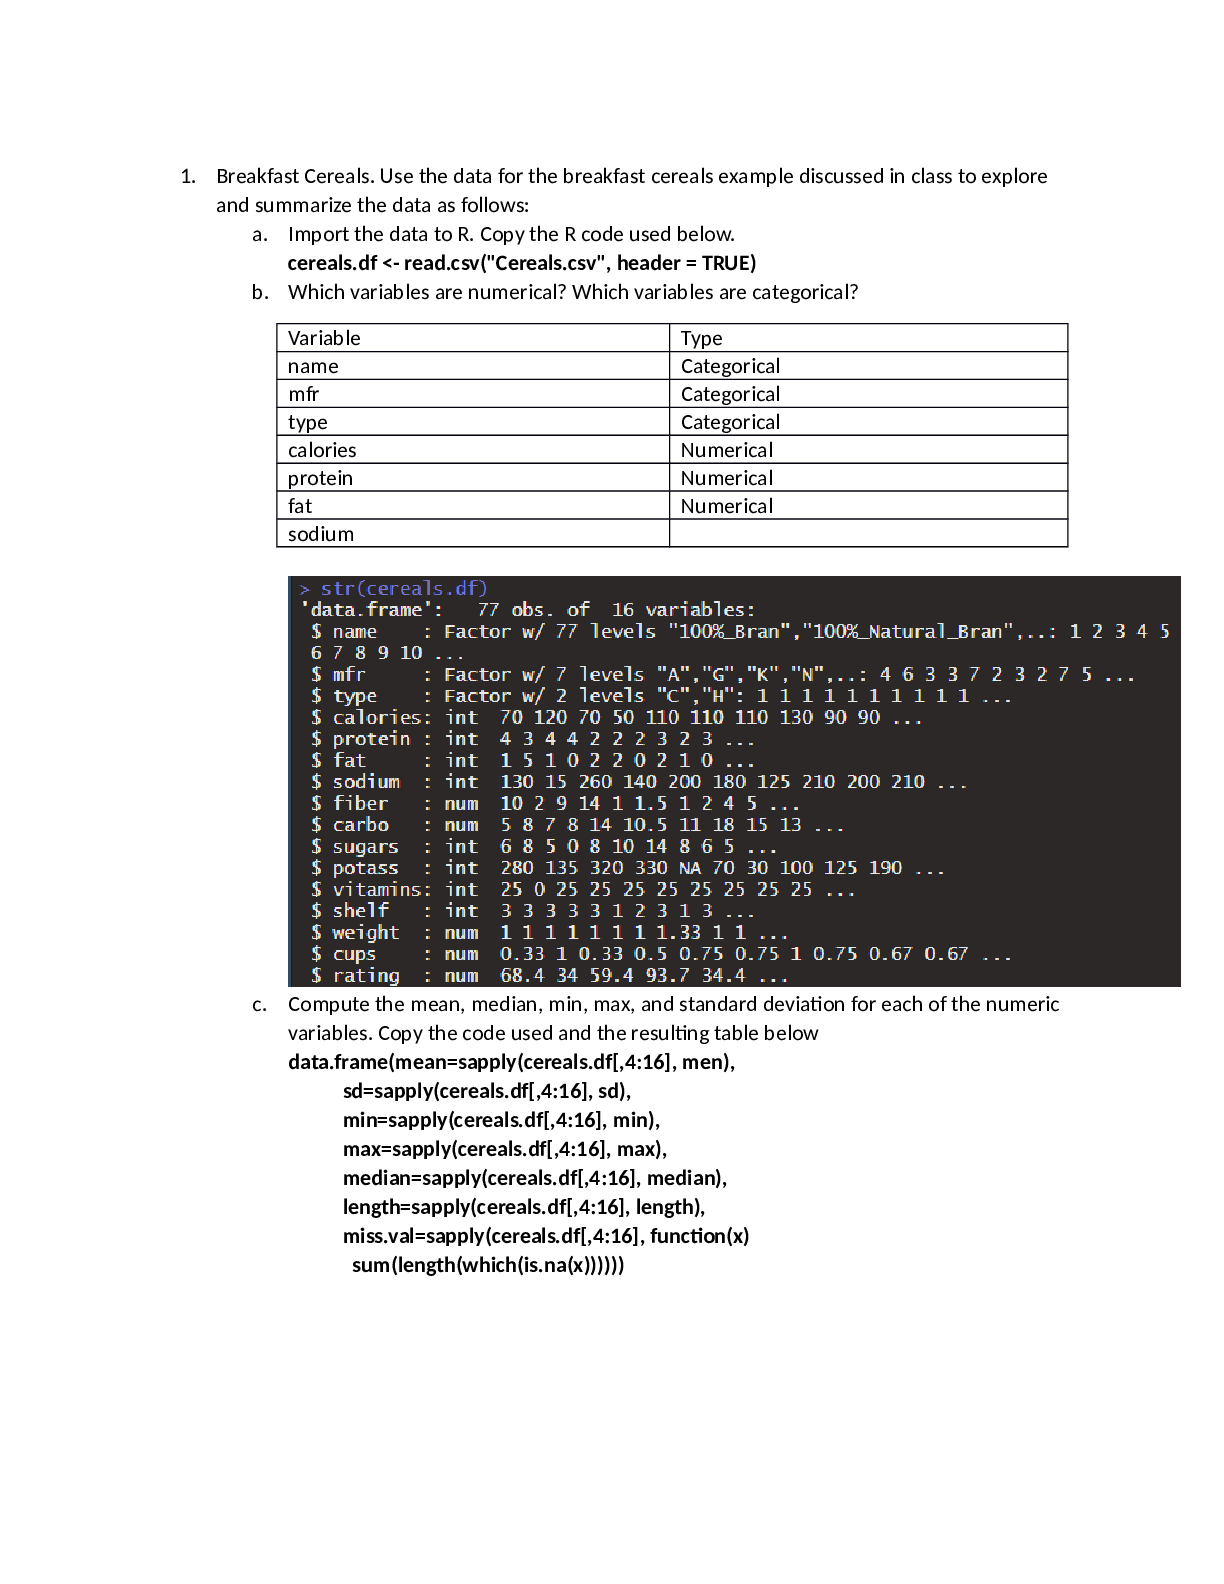
CW-04 – Answer Sheet OIM320 Part I - Task A 1. Plot a histogram determine the mean and the standard deviation (use: Analyze > Distribution). Process K - M = 9.996 St. D = 0.008 2. Calculate CP.... What does this value tell you about the ability of the process to meet specifications? 0 3. Calculate CPL, CPU and CPK. What do these values tell you about the ability of the process to meet specifications? They are all 0 as well which means that the process has the ability to meet specifications. 4. What is the probability that the dimension of a product will be lower than 9.98mm? hint: use Distribution Calculator in JMP (Help > Sample Data > Teaching Scripts>Interactive Teaching Modules > Distribution Calculator) or use norm.dist in Excel or look up Z values in z-tables. 0.0228 5. What is the probability that the dimension of a product will be larger than 10.02mm? 0.0013 6. What is the probability that a product will be out of specification? 0.0241 7. If you produce 1 million products. How many will be out of spec? 24,100 8. Check the actual values to determine how many products had a dimension smaller than 9.98? How many had dimension larger than 10.02mm? What percentage of products has a dimension lower than LSL? What percentage has dimension higher than USL? Note: You can count these ‘defects’ manually or use the ‘countif’ function in Excel…. None None 0 – 0% 0 – 0% Part I - Task B Page 1 CW-04 – Answer Sheet OIM320 Task B – Process K Capability Analysis of Process K in JMP Use your calculations in Task A to explain the values you see in the above output. Note that due to round off errors, the numbers you calculated in Task A might be close but not necessarily exactly the same as the ones showing in the JMP output. 1. What do the Capability Indices ‘tell you’? a. What is Cp? b. What is CPL? What is CPU Cpl measures how close the process I running to the LSL while CPU compares it to the USL. c. What is CPk? This measure shows close a process is running to its specifications limits, also the lesser of cpu/cpl d. Is the process Capable? Why? Yes. The values are under 1. e. Is the process centered? How do you know? Page 2 CW-04 – Answer Sheet OIM320 Yes since cpk, cpu and cpl are equal. 2. What does the % Actual showing on the right most column of the Capability Analysis tell you It tells you the eprcetange of values within the data that fall below of above the spec limit. 3. What do the Percent and PPM values (showing at the bottom of the output) tell you? The number of defects per millions. a. What is PPM? Parts per millions b. What is the difference between % Actual (question 2) and Percent showing in (3)? Examine the histogram and the chart at the bottom of the out and comment on whether the difference between the % Actual and Percent in (3) makes sense. For your convenience the two chart are shown below 4. What action do you recommend the company take? Explain. Calibrating the machine in order to get it centered around the mean. [Show More]
Last updated: 1 year ago
Preview 1 out of 10 pages
.png)
Reviews( 0 )
Document information
Connected school, study & course
About the document
Uploaded On
Nov 26, 2022
Number of pages
10
Written in

Additional information
This document has been written for:
Uploaded
Nov 26, 2022
Downloads
0
Views
40


.png)