Mathematics > QUESTIONS & ANSWERS > Questions and Answers > Unit 6 portfolio_ MATH MISC. Linear Functions Unit Portfolio. All Answers. (All)
Questions and Answers > Unit 6 portfolio_ MATH MISC. Linear Functions Unit Portfolio. All Answers.
Document Content and Description Below
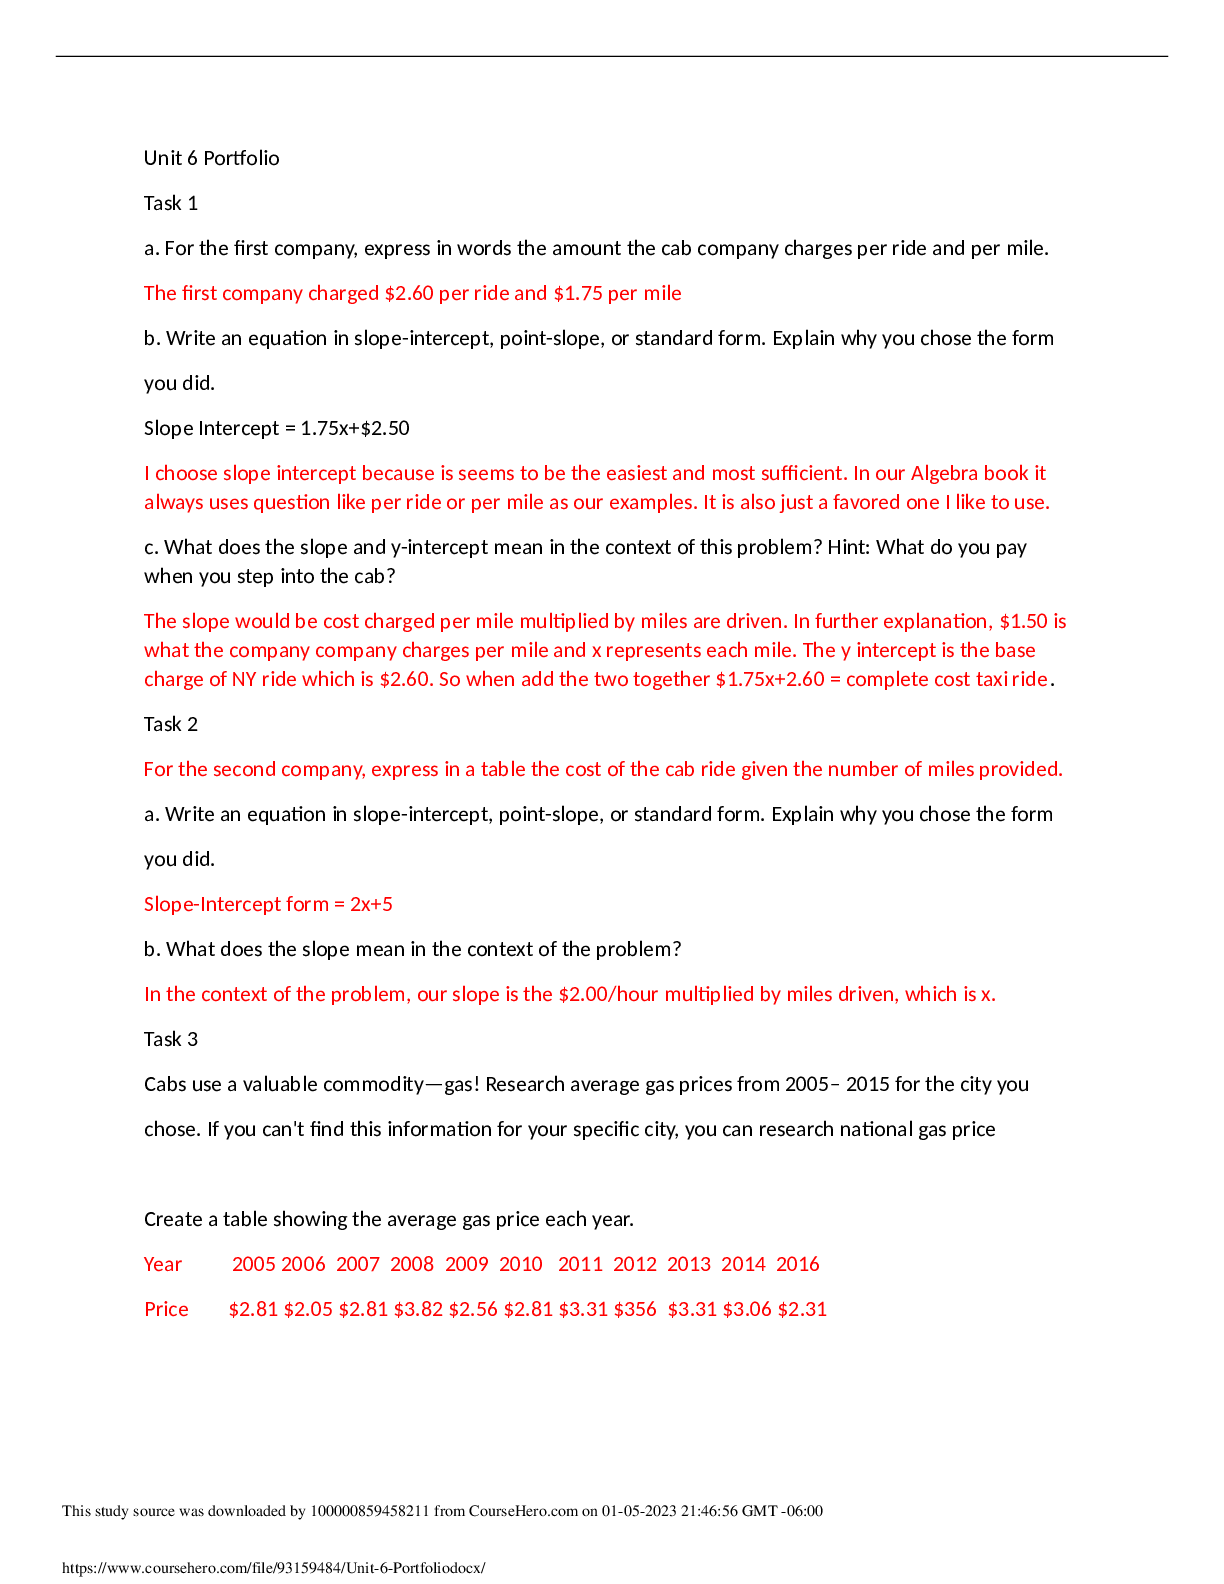
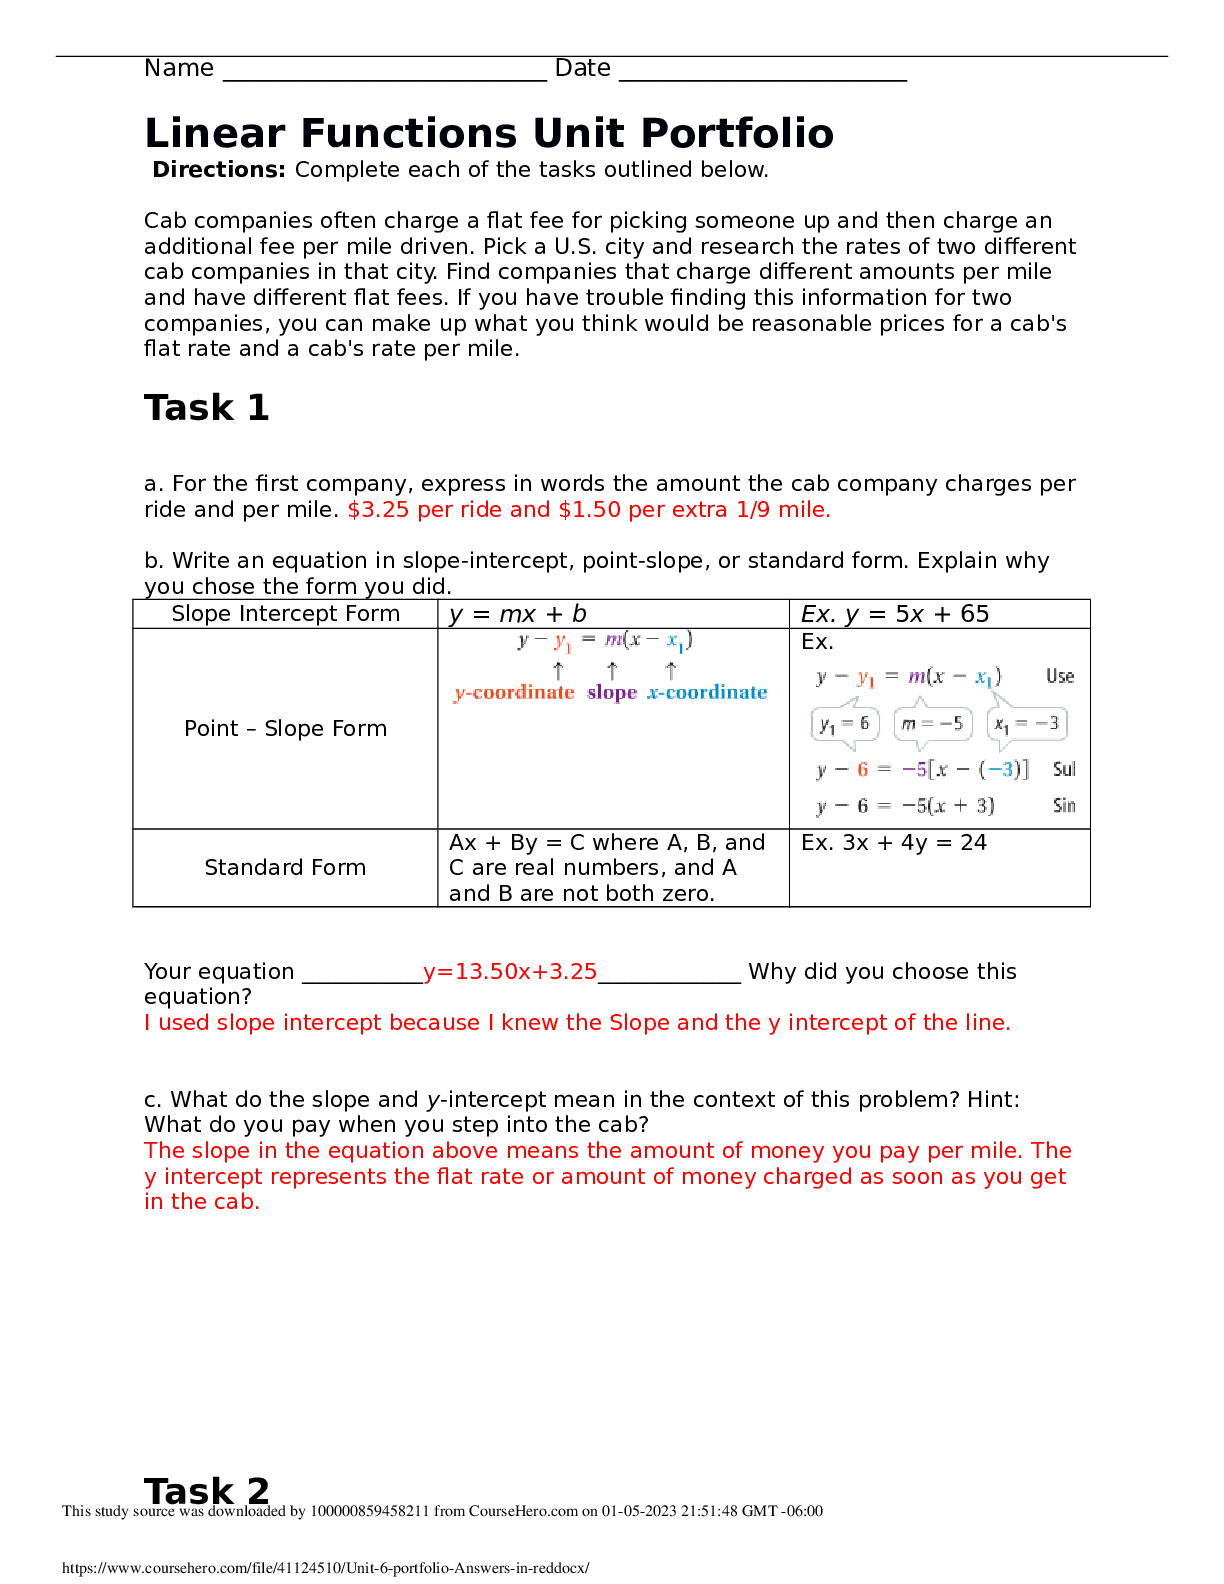
Linear Functions Unit Portfolio Directions: Complete each of the tasks outlined below. Cab companies often charge a flat fee for picking someone up and then charge an additional fee per mile driven... . Pick a U.S. city and research the rates of two different cab companies in that city. Find companies that charge different amounts per mile and have different flat fees. If you have trouble finding this information for two companies, you can make up what you think would be reasonable prices for a cab's flat rate and a cab's rate per mile. Task 1 a. For the first company, express in words the amount the cab company charges per ride and per mile. b. Write an equation in slope-intercept, point-slope, or standard form. Explain why you chose the form you did. Slope Intercept Form y = mx + b Ex. y = 5x + 65 Point – Slope Form Ex. Standard Form Ax + By = C where A, B, and C are real numbers, and A and B are not both zero. Ex. 3x + 4y = 24 Your equation ___________ Why did you choose this equation? c. What do the slope and y-intercept mean in the context of this problem? Hint: What do you pay when you step into the cab? Task 2 For the second company, express in a table the cost of the cab ride given the number of miles provided. Number of Miles 0 1 2 3 4 5 Total Cost (dollars) a. Write an equation in slope-intercept, point-slope, or standard form. Explain why you chose the form you did. Slope Intercept Form y = mx + b Ex. y = 5x + 65 Point – Slope Form Ex. Standard Form Ax + By = C where A, B, and C are real numbers, and A and B are not both zero. Ex. 3x + 4y = 24 Your equation Why did you choose this equation? b. What does the slope mean in the context of the problem? Task 3 Cabs use a valuable commodity—gas! Research average gas prices from 2005– 2015 for the city you chose. If you can't find this information for your specific city, you can research national gas price averages instead. If you use this data you will need to calculate the average. You can do this using a formula in Excel. a. Create a table showing the average gas price each year. City: __________America town________ Year Average Gas Price b. Create a scatter plot of the data in your table. Don’t forget to label your x and y access with the names of the variables. c. What equation models the data? What are the domain and range of the equation? Domain (range of x values) Range (range of y values) Do you think your equation is a good fit for the data? Explain how you determined your answers. d. Is there a trend in the data? Does there seem to be a positive correlation, a negative correlation, or neither? How much do you expect gas to cost in 2020? Explain. [Show More]
Last updated: 1 year ago
Preview 1 out of 4 pages
Instant download
Buy this document to get the full access instantly
Instant Download Access after purchase
Add to cartInstant download
Reviews( 0 )
Document information
Connected school, study & course
About the document
Uploaded On
Jan 15, 2023
Number of pages
4
Written in

Additional information
This document has been written for:
Uploaded
Jan 15, 2023
Downloads
0
Views
38