BUSI 411 Exam 3 with Answer Operations Management GradeAplus
Document Content and Description Below
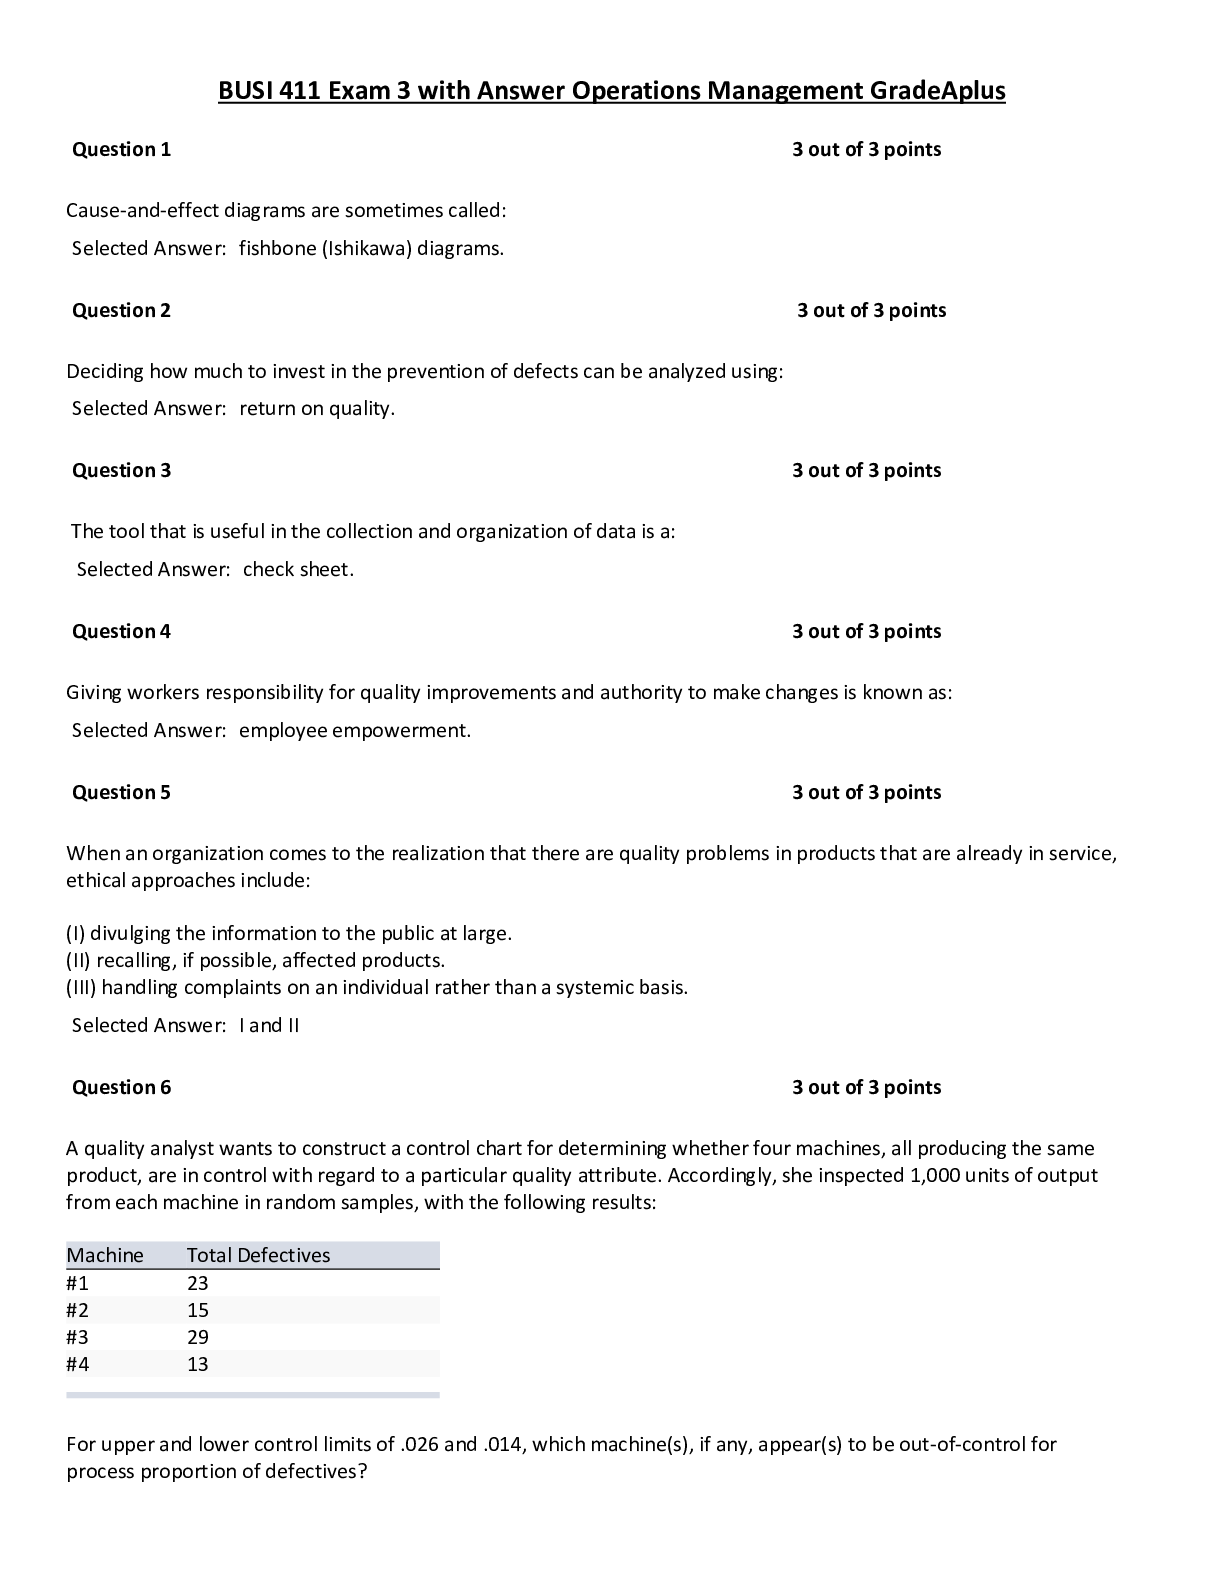
· Question 1 3 out of 3 points Cause-and-effect diagrams are sometimes called: · Question 2 3 out of 3 points Deciding how much to invest in the prevention of defects can be analyzed ... using: · Question 3 3 out of 3 points The tool that is useful in the collection and organization of data is a: · Question 4 3 out of 3 points Giving workers responsibility for quality improvements and authority to make changes is known as: · Question 5 3 out of 3 points When an organization comes to the realization that there are quality problems in products that are already in service, ethical approaches include: 1. (I) divulging the information to the public at large. 2. (II) recalling, if possible, affected products. 3. (III) handling complaints on an individual rather than a systemic basis. · Question 6 3 out of 3 points A quality analyst wants to construct a control chart for determining whether four machines, all producing the same product, are in control with regard to a particular quality attribute. Accordingly, she inspected 1,000 units of output from each machine in random samples, with the following results: Machine Total Defectives #1 23 #2 15 #3 29 #4 13 For upper and lower control limits of .026 and .014, which machine(s), if any, appear(s) to be out-of-control for process proportion of defectives? · Question 9 3 out of 3 points The greater the volume of the process being targeted for inspection, the more attractive __________ inspection is. · Question 10 3 out of 3 points A quality analyst wants to construct a control chart for determining whether four machines, all producing the same product, are in control with regard to a particular quality attribute. Accordingly, she inspected 1,000 units of output from each machine in random samples, with the following results: Machine Total Defectives #1 23 #2 15 #3 29 #4 13 What is the sample proportion of defectives for machine #1? · Question 12 3 out of 3 points One option for altering the availability of manufacturing capacity is: · Question 13 3 out of 3 points Which of the following are typically in play in a circumstance in which yield management is worthwhile? 1. (I) Perishable capacity 2. (II) Ample finished goods storage 3. (III) Demand variability 4. (IV) Low holding costs · Question 19 3 out of 3 points In MRP, the gross requirements of a given component part are calculated directly from: · Question 20 3 out of 3 points An MRP system that is updated periodically to account for all changes which have occurred within a given time interval is called a(n) ________ system. · Question 21 3 out of 3 points ISO standards aid in transferring technology to developing countries. · Question 22 3 out of 3 points Range charts and p-charts are both used for variable data. · Question 25 3 out of 3 points Load reports show capacity requirements for departments or work centers which may be more or less than the capacity available in that work center. [Show More]
Last updated: 1 year ago
Preview 1 out of 5 pages
Instant download
Buy this document to get the full access instantly
Instant Download Access after purchase
Add to cartInstant download
Reviews( 0 )
Document information
Connected school, study & course
About the document
Uploaded On
Feb 17, 2020
Number of pages
5
Written in

Additional information
This document has been written for:
Uploaded
Feb 17, 2020
Downloads
0
Views
61