Statistics > QUESTIONS & ANSWERS > North Carolina State University ST 350 ST 350 Homework #2 This Excel file Flight Performan (All)
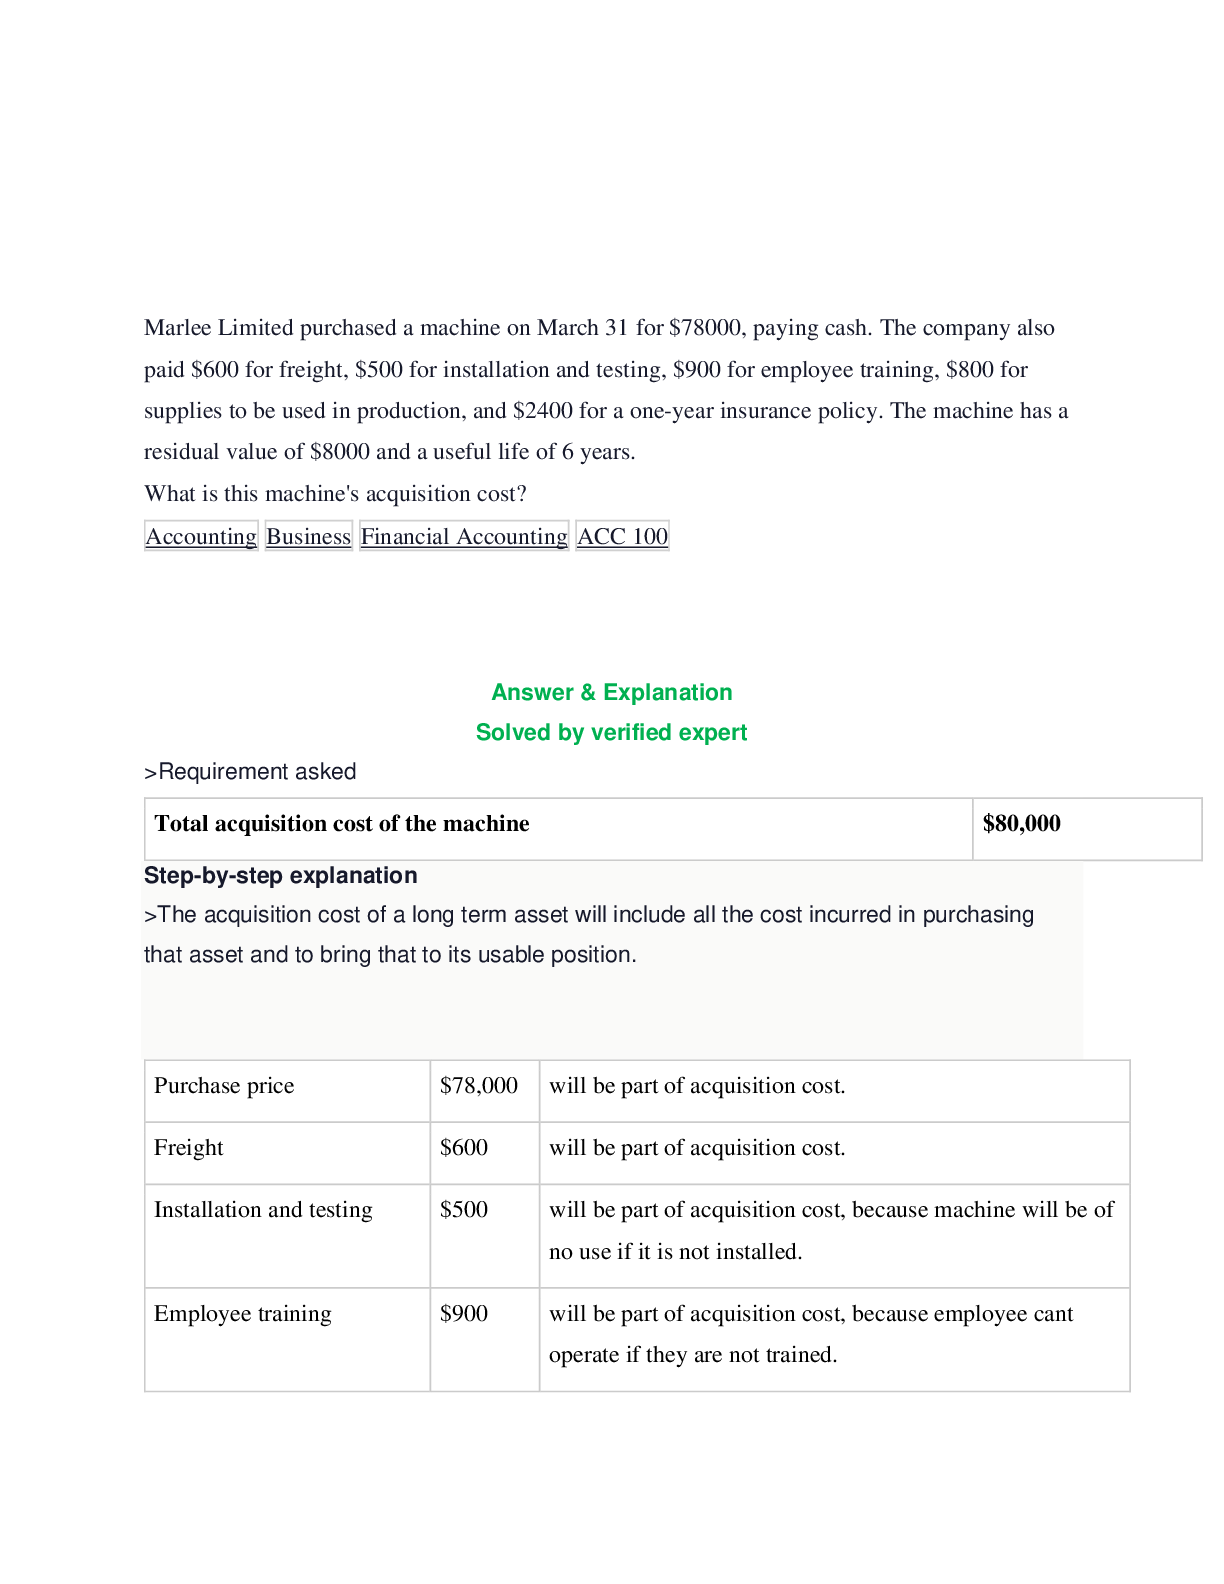
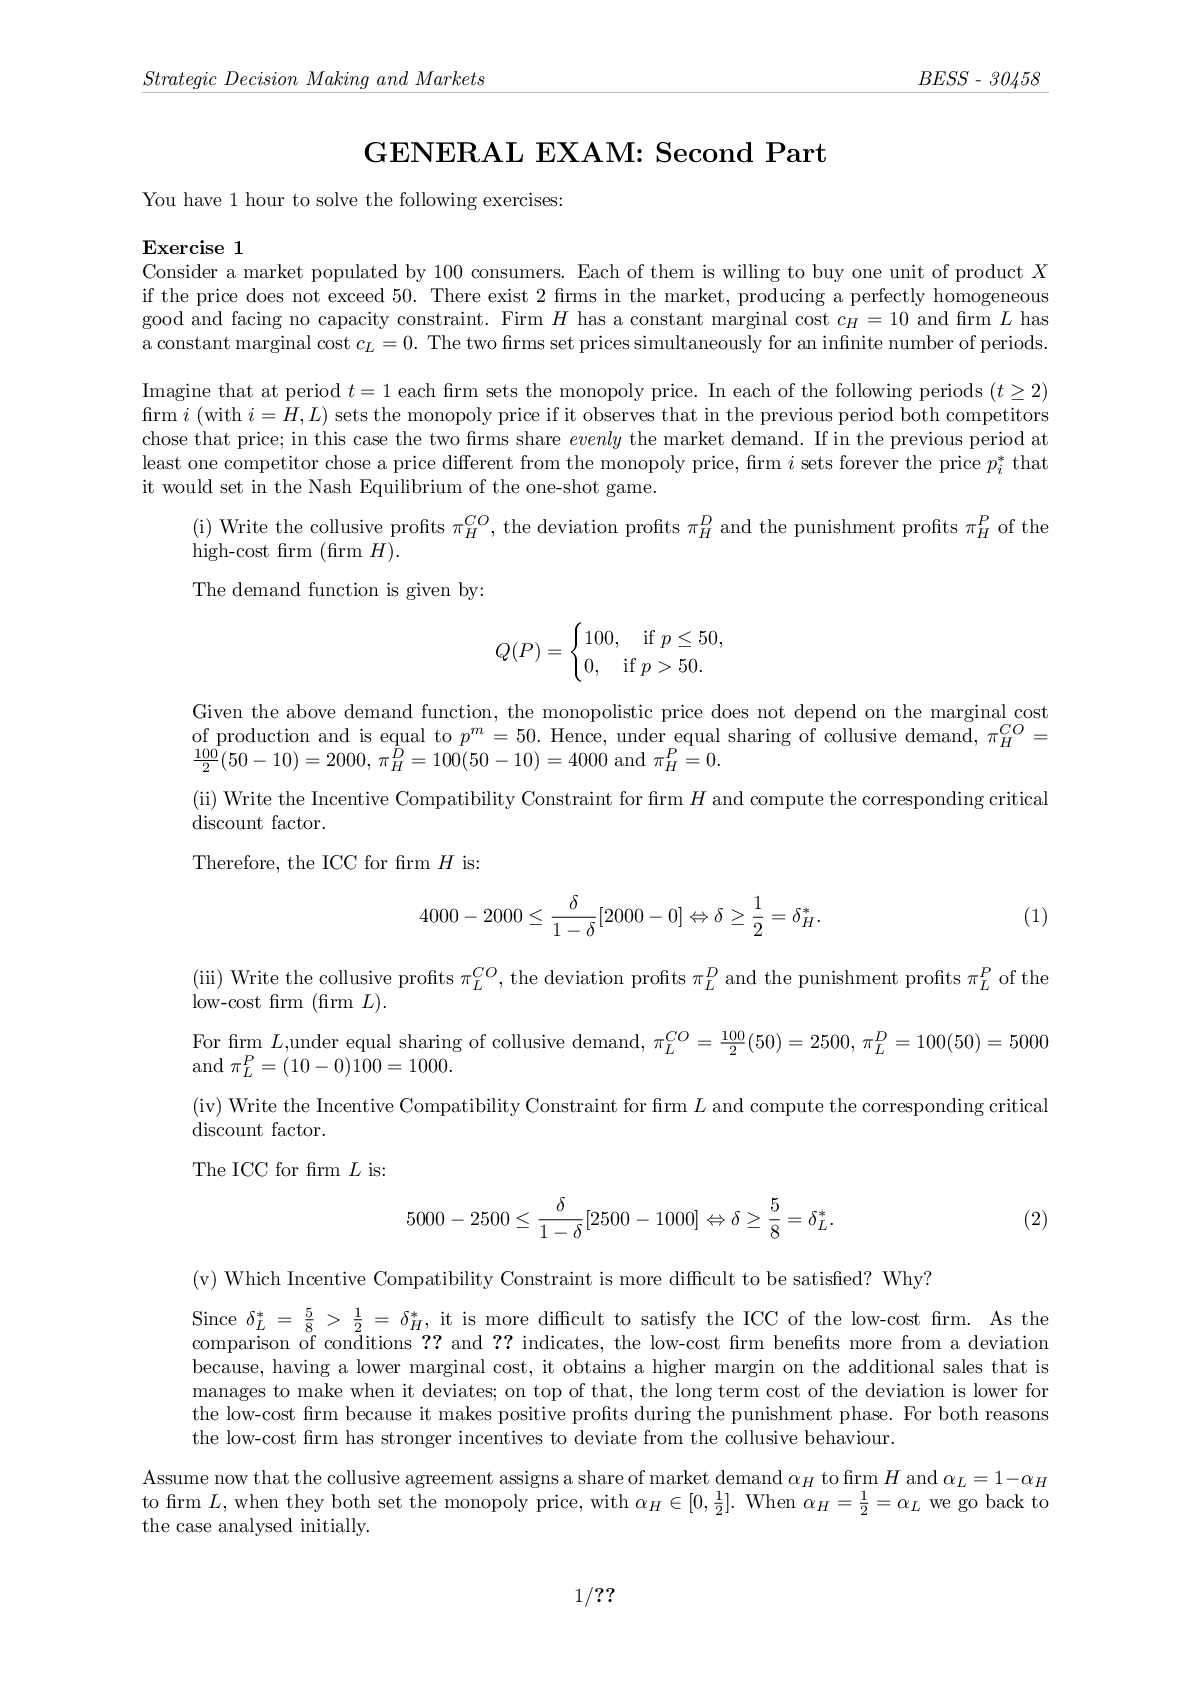
North Carolina State University ST 350 ST 350 Homework #2 This Excel file Flight Performance US Airports shows the flight data for a recent month at most US airports. Variables included are City, State, AirportCode, Airport, Flights, Delayed, Cancelled, Diverted, Ontime, and Ontime Percentage. Use Excel to make a histogram of the variable Ontime Percentage. Read the comments below for assistance.
Document Content and Description Below
North Carolina State University ST 350 ST 350 Homework #2 This Excel file Flight Performance US Airports shows the flight data for a recent month at most US airports. Variables includ... ed are City, State, AirportCode, Airport, Flights, Delayed, Cancelled, Diverted, Ontime, and Ontime Percentage. Use Excel to make a histogram of the variable Ontime Percentage. Read the comments below for assistance. NOTE: if after clicking the Data tab the "Analysis" section is not in the menu ribbon or if "Data Analysis" is not listed in the "Analysis" section, click on "Computers/Calculators: Excel and Statcrunch" in the left panel of our class webpage for instructions and information. After clicking Data Analysis in the Analysis section, in the resulting dialogue window click Histogram, then click OK. In the resulting Histogram dialogue window: 1. enter the input range (i.e. the cell range in the spreadsheet that contains the data.) 2. IMPORTANT: In the Bin Range field input the cell range N3:N16 3. click the Labels check box 4. Click the "Chart Output" check box at the bottom of the window. 5. Click OK Question 1. After constructing the histogram and "tweaking" its appearance as shown in class, select the choice below that describes the data. The histogram is rightskewed with most of the Ontime Percentages less than about 90 and just a few Ontime Percentages greater than 90. The histogram is somewhat leftskewed, with most of the Ontime Percentages greater than about 65, but with a few Ontime Percentages around 60 and below. The histogram is symmetric and moundshaped, with most Ontime Percentages clustered around 75 and fewer Ontime Percentages more than 85 and less than 65. The histogram is bimodal, with many Ontime Percentages in the 80 to 90 range and 60 to 70 range but few Ontime Percentages values between these ranges. The histogram indicates that the interquartile range (IQR) is NOT appropriate to use as a measure of spread for this data. The histogram clearly shows that the median of Ontime Percentages should NOT be used as a measure of center. 3/23/2018 ST 350 Homework #2 Spring 2018 http://www.webassign.net/web/Student/Assignment-Responses/last?dep=18115409 3/18 Question 2. What is the median of the Ontime Percentages? 75.4 median Question 3. The value of the first quartile Q1 is 68.2, using the method for calculating quartiles discussed in class (verify this value to check if you understand how to use the method discussed in class.) Use the same method for calculating quartiles to calculate the third quartile Q3. 83.3 Q3 Question 4. Calculate the interquartile range (IQR) of the Ontime Percentages to measure the spread of the data. 15.1 IQR 2. 2/2 points | Previous Answers The mean age and median age of 6 people in a room is 40 years. A person whose age is 20 years leaves the room. Question 1. If possible, determine the mean age of the remaining 5 people in the room. If it is not possible to find the mean age of the remaining 5 people, write "not possible" (without the quotes) as your answer. 42 Question 2. If possible, determine the median age of the remaining 5 people in the room. If it is not possible to find the median age of the remaining 5 people, write "not possible" (without the quotes) as your answer. not possible 3/23/2018 ST 350 Homework #2 Spring 2018 http://www.webassign.net/web/Student/Assignment-Responses/last?dep=18115409 4/18 3. 3/3 points | Previous Answers A survey of a large college class asked the following questions: 1. Are you female or male? (In the data, male=0, female=1) 2. Are you righthanded or lefthanded? (In the data, right=0, left=1) 3. What is your height in inches? 4. How many minutes do you study on a typical weeknight? The histograms above show the student responses, in scrambled order and without scale markings. In the questions below choose the histogram that goes with the variable mentioned in the question. Question 1. Which histogram depicts the responses to the question "Are you female or male"? Question 2. Which histogram depicts the responses to the question "How many minutes do you study on a typical weeknight"? upper right histogram upper left histogram lower left histogram lower right histogram 3/23/2018 ST 350 Homework #2 Spring 2018 http://www.webassign.net/web/Student/Assignment-Responses/last?dep=18115409 5/18 Question 3. Which histogram depicts the responses to the question "Are you righthanded or lefthanded"? lower left histogram lower right histogram upper left histogram upper right histogram lower left histogram lower right histogram upper right histogram upper left histogram 3/23/2018 ST 350 Homework #2 Spring 2018 http://www.webassign.net/web/Student/Assignment-Responses/last?dep=18115409 6/18 4. 2/2 points | Previous Answers Each student in a statistics class was asked to randomly select a number from 1 to 10. The graph below summarizes their choices. The height of the bar above a number indicates the percentage of students in the class that chose that number (the actual percentage is shown above each bar). Question 1. What is the median of all the numbers selected by the students? 7 median Question 2. What is the first quartile Q1 of all the numbers selected by the students? What is the third quartile Q3 of all the numbers selected by the students? 4 8 Q1 Q3 3/23/2018 ST 350 Homework #2 Spring 2018 http://www.webassign.net/web/Student/Assignment-Responses/last?dep=18115409 7/18 5. 3.5/3.5 points | Previous Answers This Excel file, Distance from Home, shows 13 values of the variable "distance from hometown to campus" that were provided by the students in a recent statistics class. Question 1. Find the mean and the median. 342.4 120 mean (round to 1 decimal place in your answer) median Question 2. Suppose the family of the student with data value 3000 moves to Tel Aviv, Israel; this changes the data value for this student from 3000 to 6000. Calculate the new mean and new median when 3000 is replaced by 6000. 573.2 120 new mean (round to 1 decimal place in your answer) new median Question 3. Now suppose that the families of the other 5 students whose values are greater than the median also move to new locations so that each student's data value is twice as large as the original data value. (The data values of the students less than the median do not change and the 6000 data value remains at 6000). Calculate the new mean and the new median. 657.2 120 new mean (round to 1 decimal place in your answer) new median Question 4. Suppose now that the 6 students whose data values are less than the median also move to new locations so that each student's data value is half as large as the original data value. (Note that half of 0 is 0; all the data values greater than the median keep the same new values from question 3). Calculate the new mean and the new median. 648.1 120 new mean (round to 1 decimal place in your answer) new median 3/23/2018 ST 350 Homework #2 Spring 2018 http://www.webassign.net/web/Student/Assignment-Responses/last?dep=18115409 8/18 6. 4/4 points | Previous Answers Here is a stem and leaf plot of the percents of residents aged 25 to 34 in each of the 50 states. The stems are whole percents and the leaves are tenths of a percent. The "*" stem rows have leaves 0 through 4; the stem rows without a "*" have leaves 5 through 9. 10* | 10 | 5 11* | 0 11 | 12* | 1 3 4 4 12 | 6 7 7 8 8 9 13* | 0 0 1 2 4 13 | 5 5 5 6 6 7 8 9 9 9 9 14* | 1 1 2 2 2 3 4 4 4 4 14 | 5 7 8 9 15* | 2 4 4 15 | 7 8 9 9 9 Question 1. Montana has the smallest percent of young adults, perhaps because it lacks job opportunities. What is the percent for Montana? 10.5 Question 2. What is the median of the data? 13.9 (Use 2 decimal places in your answer). Question 3. What is the first quartile of the data? (Use the method shown in class to calculate Q1). 13 first quartile Question 4. What is the third quartile of the data? (Use the method shown in class to calculate Q3) 14.4 third quartile 3/23/2018 ST 350 Homework #2 Spring 2018 http://www.webassign.net/web/Student/Assignment-Responses/last?dep=18115409 9/18 7. 4/4 points | Previous Answers Shown below is a backtoback stem and leaf display of the number of turnovers committed in each game of a recent season by the men's basketball teams at NCSU (36 games) and UNC (37 games). The stems listed down the center of the display are the 10's units. Use the display to calculate the 5number summary of each team's number of turnovers. TURNOVERS NCSU UNC 9999876 0 899 11111000 1 000111 3332222 1t 223 555444 1f 444555 66 1s 6666777777 98 1* 8899999 5200 2 66 NCSU Minimum 6 8 Minimum UNC NCSU Q1 10 12 Q1 UNC NCSU Median 12 16 Median UNC NCSU Q3 15 17 25 Q3 UNC NCSU Maximum 26 Maximum UNC 3/23/2018 ST 350 Homework #2 Spring 2018 http://www.webassign.net/web/Student/Assignment-Responses/last?dep=18115409 10/18 8. 3.5/3.5 points | Previous Answers The graduation rate of college students is a subject of considerable interest and is a frequent topic in the news. College/university administrators use the graduation rate as a barometer of student success at their respective institution. State legislators are interested in the graduation rate since most states subsidize the cost of educating each instate student at public universities and colleges. Graduation rates are also used to evaluate university athletic programs. Athletic directors do not relish the negative publicity that results when the graduation rate of athletes is significantly lower than that of the general student body. This Excel file graduation rates shows recent 6year graduation rates for athletes and the general student body at 26 universities. The institutions included are all ACC schools, NCSU peerdesignated institutions, and two of the larger schools in the UNC system ECU and UNCCharlotte. Question. Use the data in the Excel file to find the quartiles and the median of the general student body graduation rates and the athlete graduation rates (use the Tukey Method for calculating quartiles discussed in the ebook/text on p.58 and on p. 20 in Lecture Unit 2 of the coursepack). 72 59 % Q1, first quartile for general student body graduation rate % Q1, first quartile for athlete graduation rate 79 66 % median, general student body graduation rate % median, athlete graduation rate 82 73 % Q3, third quartile for general student body graduation rate % Q3, third quartile for athlete graduation rate 3/23/2018 ST 350 Homework #2 Spring 2018 http://www.webassign.net/web/Student/Assignment-Responses/last?dep=18115409 11/18 9. 3/3 points | Previous Answers The company for which you currently work would like to build a manufacturing facility in the Southeast. One criterion the CEO will use when choosing the state in which to locate the facility is the high school graduation rate. The company Research Department obtains this data NC HS graduation rates showing the high school graduation rates of various student groups for every school district in North Carolina for the years 2006 2013. Since the data set is so large the CEO would like you to summarize the data for the board of directors which meets in 2 hours. As part of your summary you want to show the board of directors boxplots of the district graduation rates for each of the years 20062013. Since Excel does not make boxplots you need to use statcrunch. To paste the data into statcrunch, do the following: 1. Open the above file in Excel 2. Highlight cells A1 to G9009 and press Ctrl+C (Command+C on a mac) to copy the cells 3. Open Statcrunch by clicking here (unity login required) 4. In the upper left corner of the statcrunch spreadsheet click on cell "var1" 5. Press Ctrl+V (Command+V on a mac) to paste the data into the statcrunch spreadsheet. If a Paste Preview window appears, choose Tab as the delimiter. 6. The data should appear in statcrunch with the variable names in the top row and the data in rows 1 through 9008. NOTE: Step 4 above is important. Not clicking on the "var1" cell before pasting the data into statcrunch will result in the following incorrect configuration of the data in the statcrunch spreadsheet: Clicking the "var1" cell before pasting the data into statcrunch, as instructed in step 4, results in the correct placement of the variable names School District, reporting year etc. in the top row of the statcrunch spreadsheet. The data values are in row 1 through row 9008. To make statcrunch boxplots of each year's district graduation rates do the following: Click the "Graph" button; in the dropdown menu click "Boxplot". In the resulting window under "Select Columns" click pct to move it to the right column. In the "Where:" window type the following EXACTLY AS SHOWN: subgroup=TOT In the "Group by:" window select "reporting year" Under "Other options" click the check box next to "Use fences to identify outliers" Click the "Compute!" button in the lower right corner. 3/23/2018 ST 350 Homework #2 Spring 2018 http://www.webassign.net/web/Student/Assignment-Responses/last?dep=18115409 12/18 A window should appear showing boxplots of the district graduation rates for each of the years 20062013. Use the boxplots to answer the following questions. Question 1. In what year did the lowest graduation rate occur? Question 2. What two years had the highest IQR's? (This is a multipleselect question; select all the correct answers and only the correct answers). Question 3. What two years had the smallest ranges? Note that the definition of range is: range = maximum data value smallest data value. (This is a multipleselect question; select all the correct answers and only the correct answers). 3/23/2018 ST 350 Homework #2 Spring 2018 http://www.webassign.net/web/Student/Assignment-Responses/last?dep=18115409 13/18 3/23/2018 ST 350 Homework #2 Spring 2018 http://www.webassign.net/web/Student/Assignment-Responses/last?dep=18115409 14/18 10.3/3 points | Previous Answers Shown below are boxplots comparing the distributions of income for people aged 25 to 65 years with six different levels of education. The lines in each boxplot extend to the maximum and minimum incomes. Question 1. What level of education has the greatest spread among the middle 50% of incomes? higher degree Question 2. The median income of what level of education is closest in value to the 75th percentile of "Some HS" incomes? hs grad Question 3. What level of education has 25th percentile closest in value to the 75th percentile of "No HS" but does not exceed the 75th percentile of "No HS"? some college 3/23/2018 ST 350 Homework #2 Spring 2018 http://www.webassign.net/web/Student/Assignment-Responses/last?dep=18115409 15/18 11.2/2 points | Previous Answers Data about the facebook friends of students in a recent intro stats class were collected using the Statcrunch Facebook Friend App. Click on this Excel file to open the data in Excel. The variables in the data in which we are interested are: Gender (the gender of the intro stats student), num.friends (the number of facebook friends the intro stats student has), Femalefriends (the number of female facebook friends the intro stats student has), Malefriends (the number of male facebook friends the intro stats student has). We will use boxplots to compare and contrast the number of male and female facebook friends that male and female intro stats students have. Since Excel does not make boxplots, we will use statcrunch to make the boxplots. To paste the data into statcrunch, do the following: 1. In the Excel file highlight cells A1 to H115 2. Press Ctrl+C (Command+C on a Mac) to copy the highlighted data 3. Open Statcrunch (unity log in required) 4. In the upper left corner of the statcrunch spreadsheet click on cell var1 5. Press Ctrl+V (Command+V on a Mac)to paste the data into the statcrunch spreadsheet. 6. The data should appear in statcrunch with the variable names Gender, num.friends, Femalefriends, etc. in the top row and the data in rows 1 through 114. Make a boxplot for the number of facebook friends that Male intro stats students have and a boxplot for the number of facebook friends that Female intro stats students have as follows: 1. Click on Graph at the top of the statcrunch worksheet 2. In the dropdown menu click on Boxplot; the boxplot dialogue window will open 3. In the Boxplot dialogue window, Under Select Columns(s) click num.friends so that num.friends appears in the right column 4. In the "Group by" area choose Gender 5. Under "Other options:" click the check boxes next to "Use fences to identify outliers" and "Draw boxes horizontally" 6. At the lower right of the Boxplot dialogue window click the "Compute!" button 7. 2 boxplots for num.friends will be created, one for male intro stats students and one for female intro stats students Question 1. Select the pair of boxplots below that match the pair of boxplots made according to the above instructions. 3/23/2018 ST 350 Homework #2 Spring 2018 http://www.webassign.net/web/Student/Assignment-Responses/last?dep=18115409 16/18 3/23/2018 ST 350 Homework #2 Spring 2018 http://www.webassign.net/web/Student/Assignment-Responses/last?dep=18115409 17/18 Question 2. True/False. For male intro stats students the value of Q3 for the number of friends is less than the median number of friends for female intro stats students. (1 submission only) True False 3/23/2018 ST 350 Homework #2 Spring 2018 http://www.webassign.net/web/Student/Assignment-Responses/last?dep=18115409 18/18 [Show More]
Last updated: 1 year ago
Preview 1 out of 17 pages

Buy this document to get the full access instantly
Instant Download Access after purchase
Add to cartInstant download
We Accept:

Reviews( 0 )
$6.00
Document information
Connected school, study & course
About the document
Uploaded On
Jan 25, 2023
Number of pages
17
Written in

Additional information
This document has been written for:
Uploaded
Jan 25, 2023
Downloads
0
Views
115