DATA ANALYSIS > Quiz > Exploratory Data Analysis and Data Visualization Exploratory (All)
Exploratory Data Analysis and Data Visualization Exploratory
Document Content and Description Below
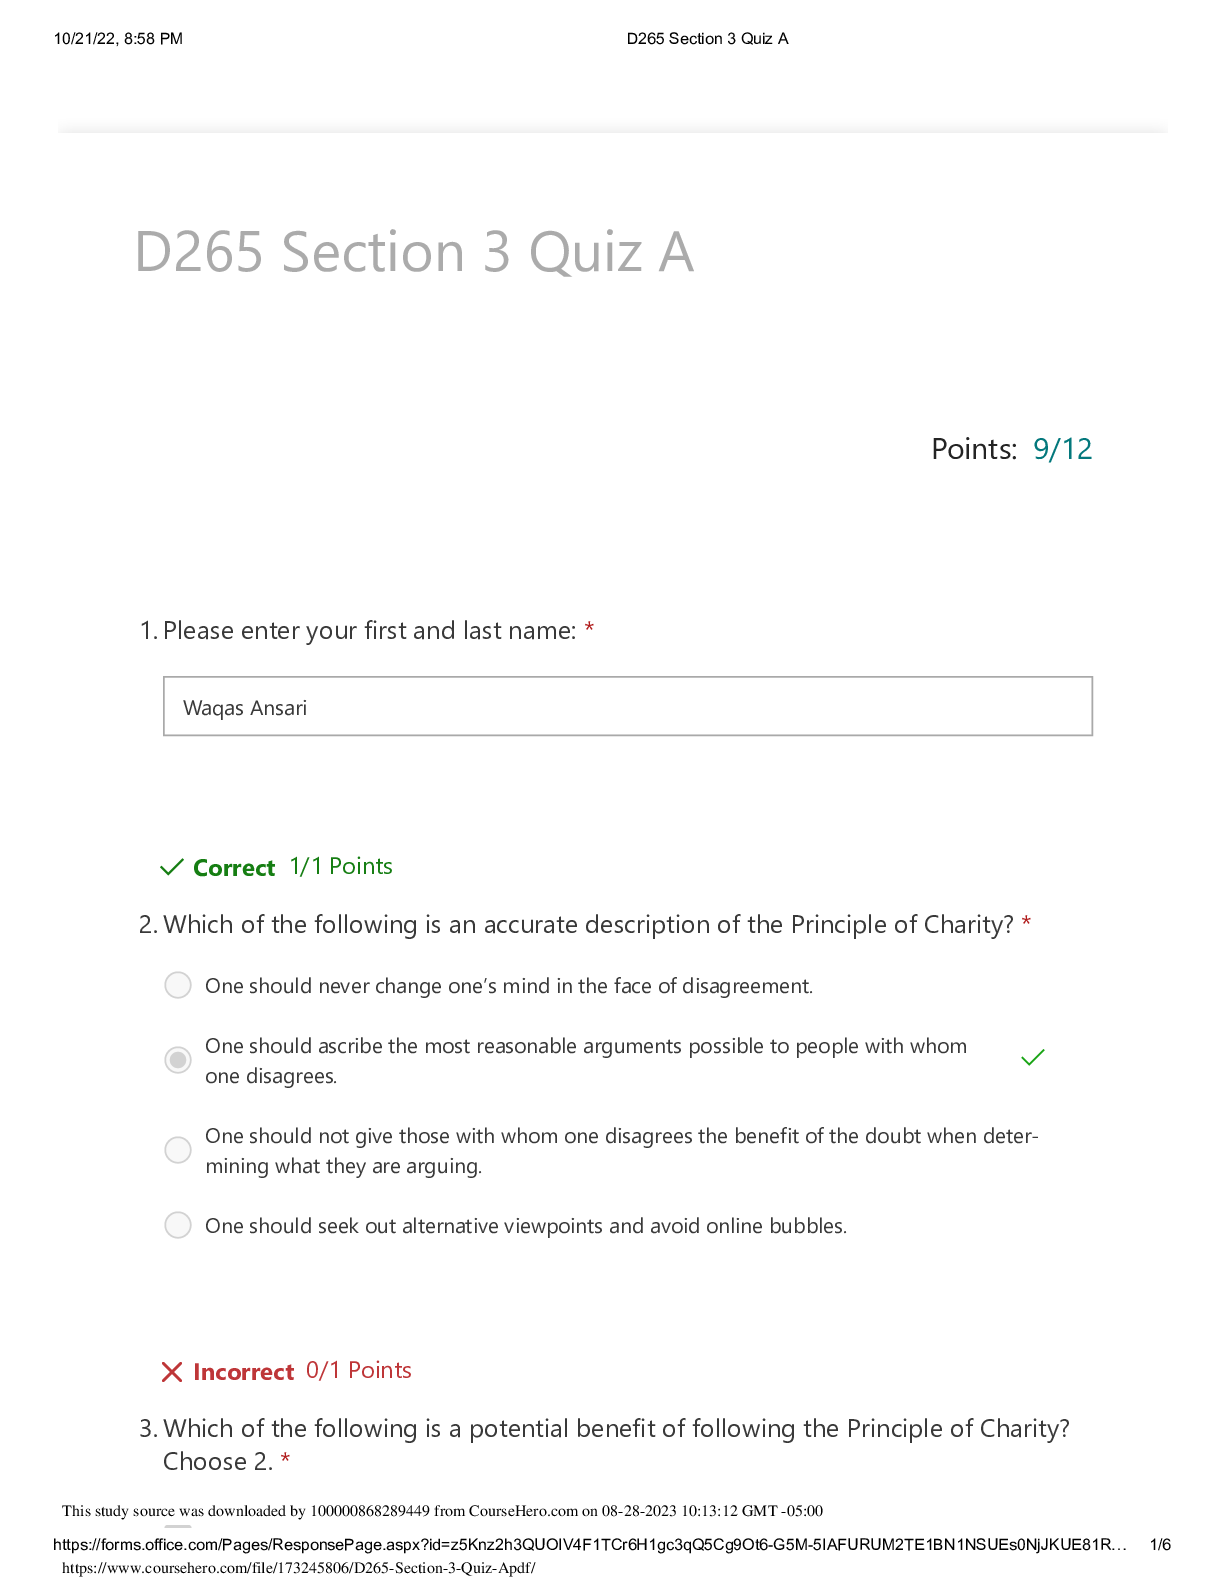
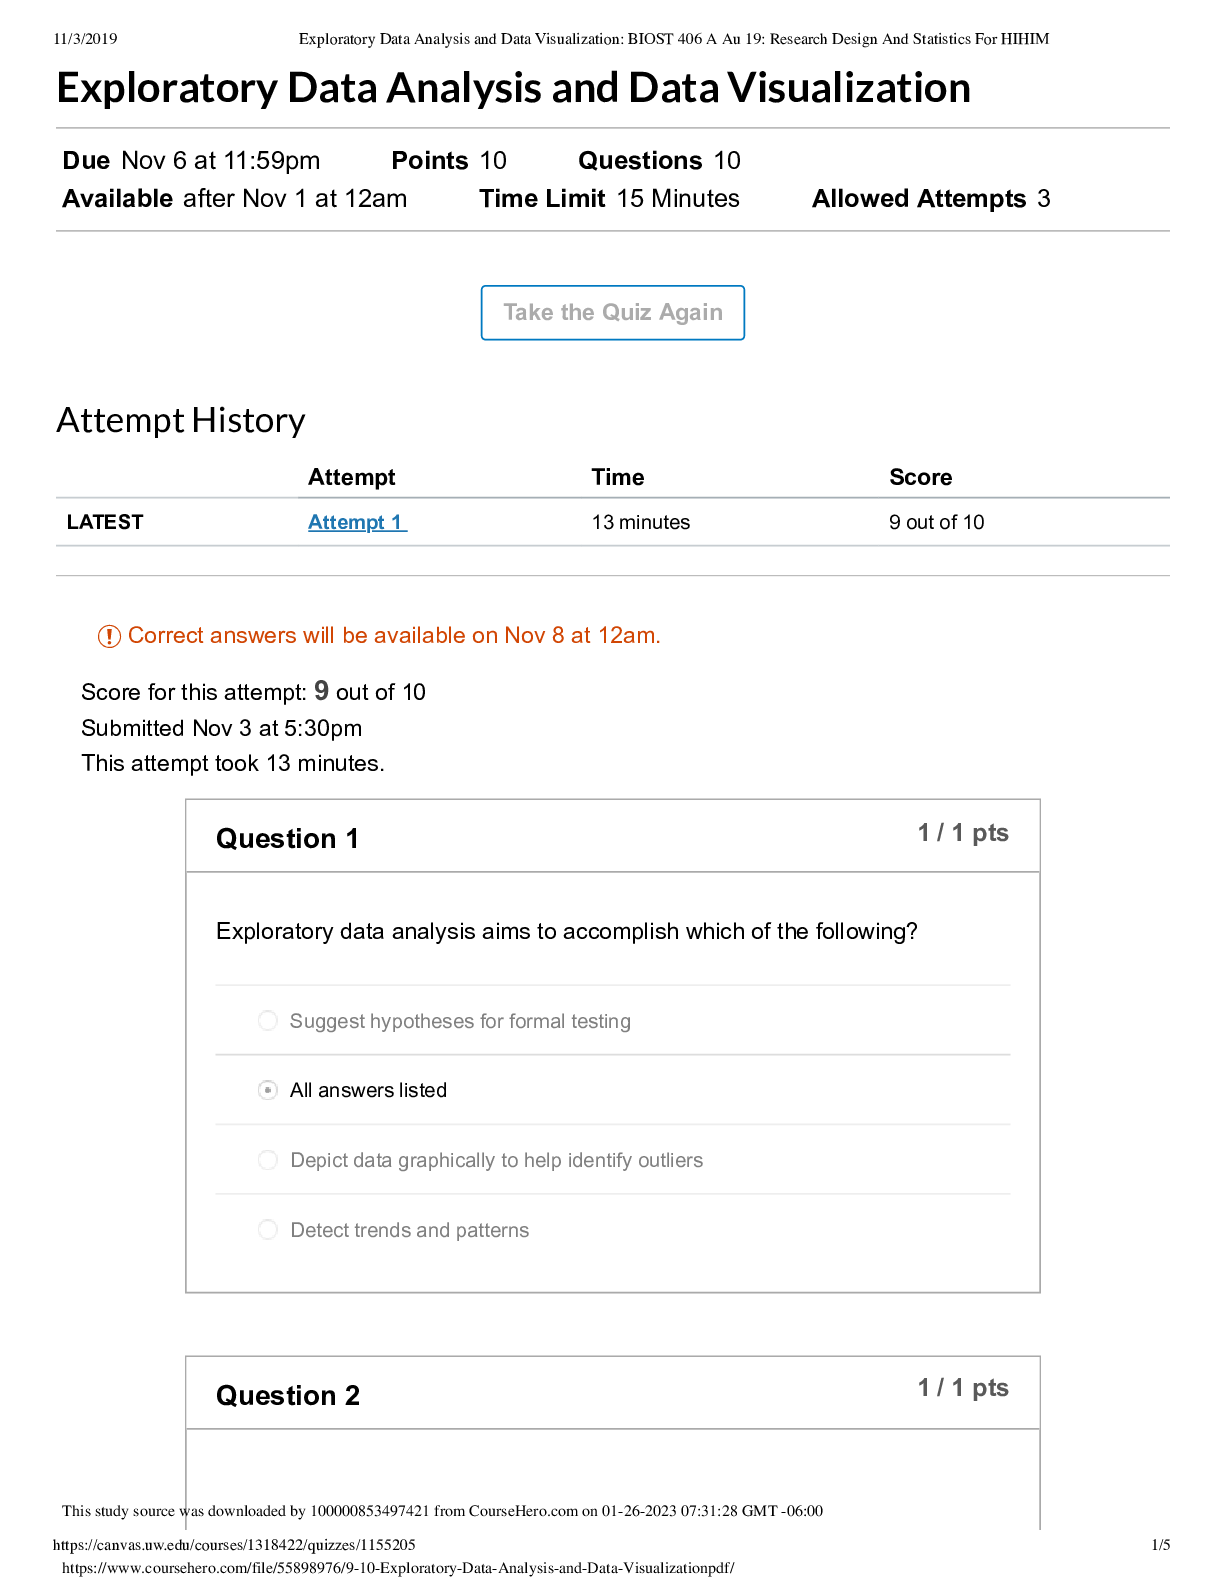
Score for this attempt: 9 out of 10 Submitted Nov 3 at 5:30pm This attempt took 13 minutes. Take the Quiz Again Ques 1 / 1 pts tion 1 Exploratory data analysis aims to accomplish which of the fol... lowing? Suggest hypotheses for formal testing All answers listed Depict data graphically to help identify outliers Detect trends and patterns Q 1 / 1 pts uestion 2 A data visualization technique that lays data out as a grid and assigns color based upon data frequency is called a(n): dplyr bar chart EDA heat map Ques 1 / 1 pts tion 3 The package used to manipulate data frames by reshaping, combining, and summarizing data sets is called: ggplot2 dplyr None of the answers listed R Stud [Show More]
Last updated: 1 year ago
Preview 1 out of 5 pages
Reviews( 0 )
Document information
Connected school, study & course
About the document
Uploaded On
Jan 26, 2023
Number of pages
5
Written in

Additional information
This document has been written for:
Uploaded
Jan 26, 2023
Downloads
0
Views
48