DATA ANALYSIS > QUESTIONS & ANSWERS > DATA VISUALIZATION (All)
DATA VISUALIZATION
Document Content and Description Below
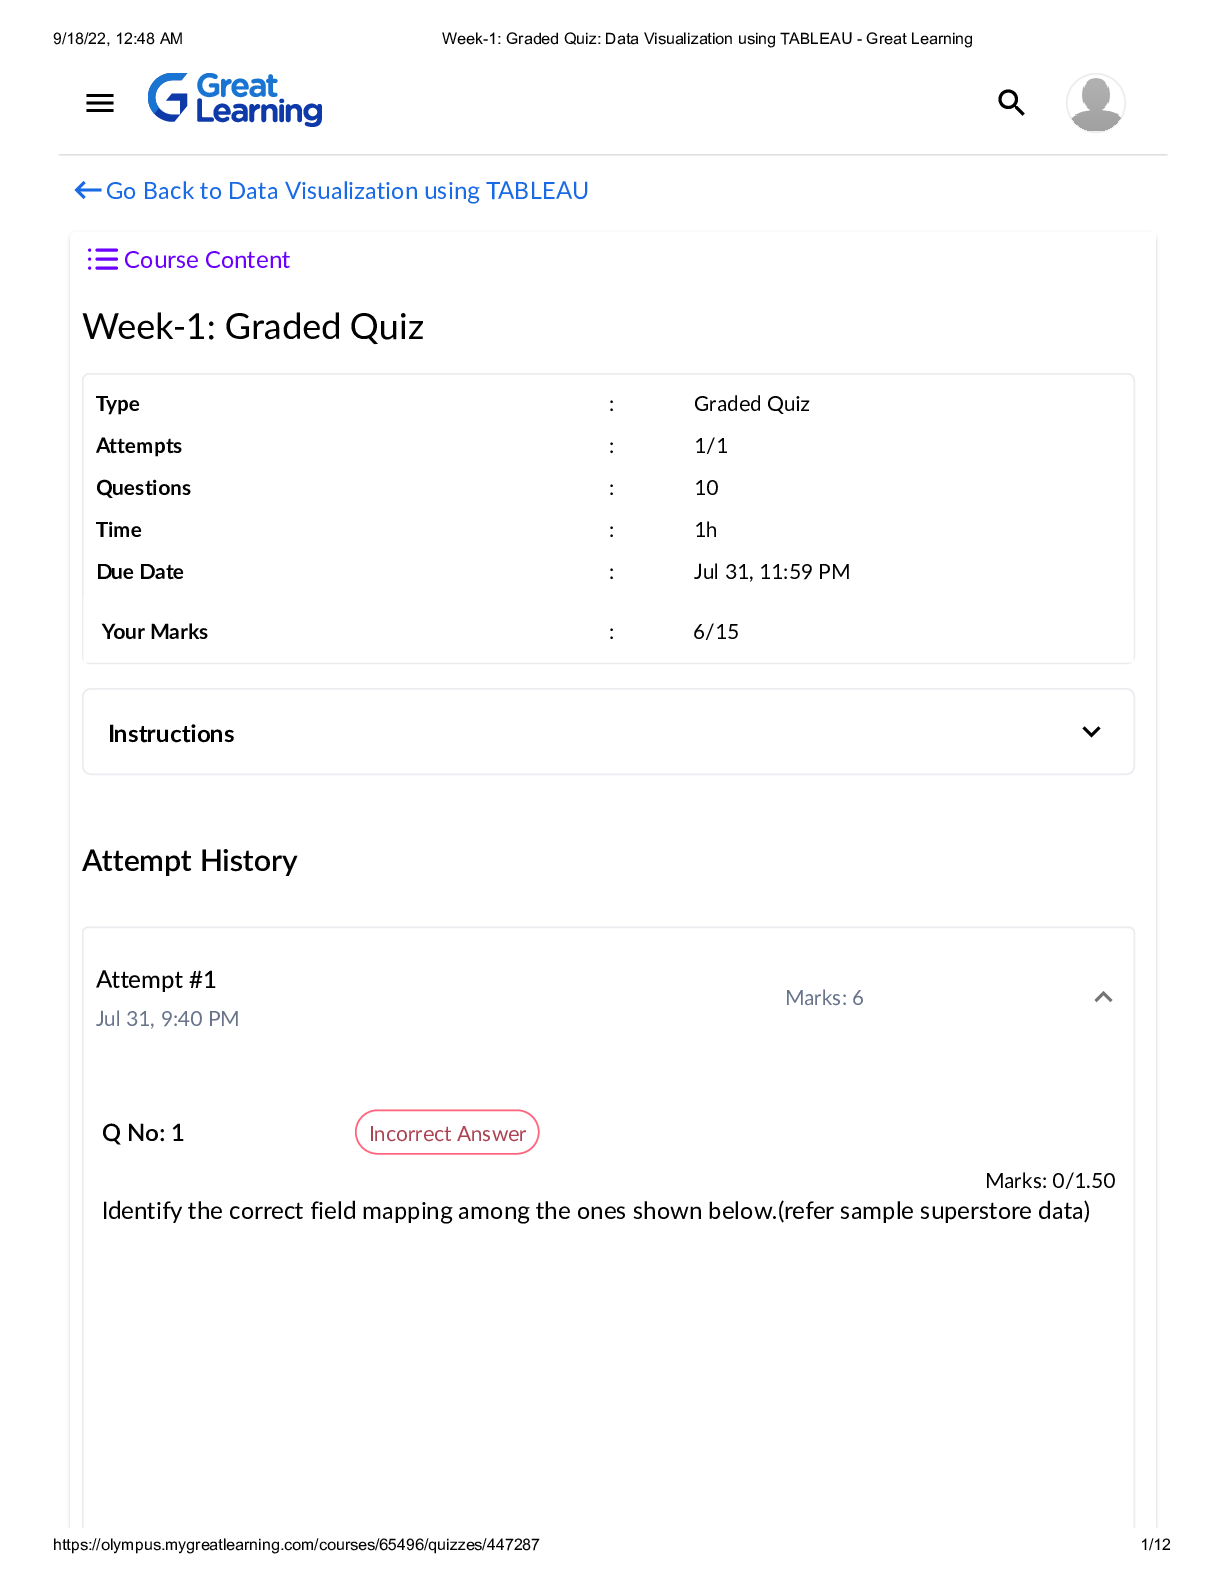
Q No: 1 Incorrect Answer Marks: 0/1.50 Identify the correct field mapping among the ones shown below.(refer sample superstore data) Q No: 2 Incorrect Answer Marks: 0/1.50 Identify the Correct opt... ions regarding Chart A and Chart B. Chart A: It is used to identify a relationship between two measures. Chart B: It is used to understand the distribution of a measure. Identify the correct options regarding Chart A and Chart B. Q No: 3 Correct Answer Marks: 1.50/1.50 Mark the correct statement based upon the following graph. Q No: 4 Incorrect Answer Marks: 0/1.50 You want to create a visualisation for profit and sales across states. Which of the following are the most suitable chart type for this? [Show More]
Last updated: 1 year ago
Preview 1 out of 12 pages
Instant download
Buy this document to get the full access instantly
Instant Download Access after purchase
Add to cartInstant download
Reviews( 0 )
Document information
Connected school, study & course
About the document
Uploaded On
Feb 08, 2023
Number of pages
12
Written in

Additional information
This document has been written for:
Uploaded
Feb 08, 2023
Downloads
0
Views
226