Computer Networking > EXAM > DevOps GCP ALL SOLUTION 100% CORRECT SPRING LATEST 2023 EDITION AID GRADE A+ (All)
DevOps GCP ALL SOLUTION 100% CORRECT SPRING LATEST 2023 EDITION AID GRADE A+
Document Content and Description Below
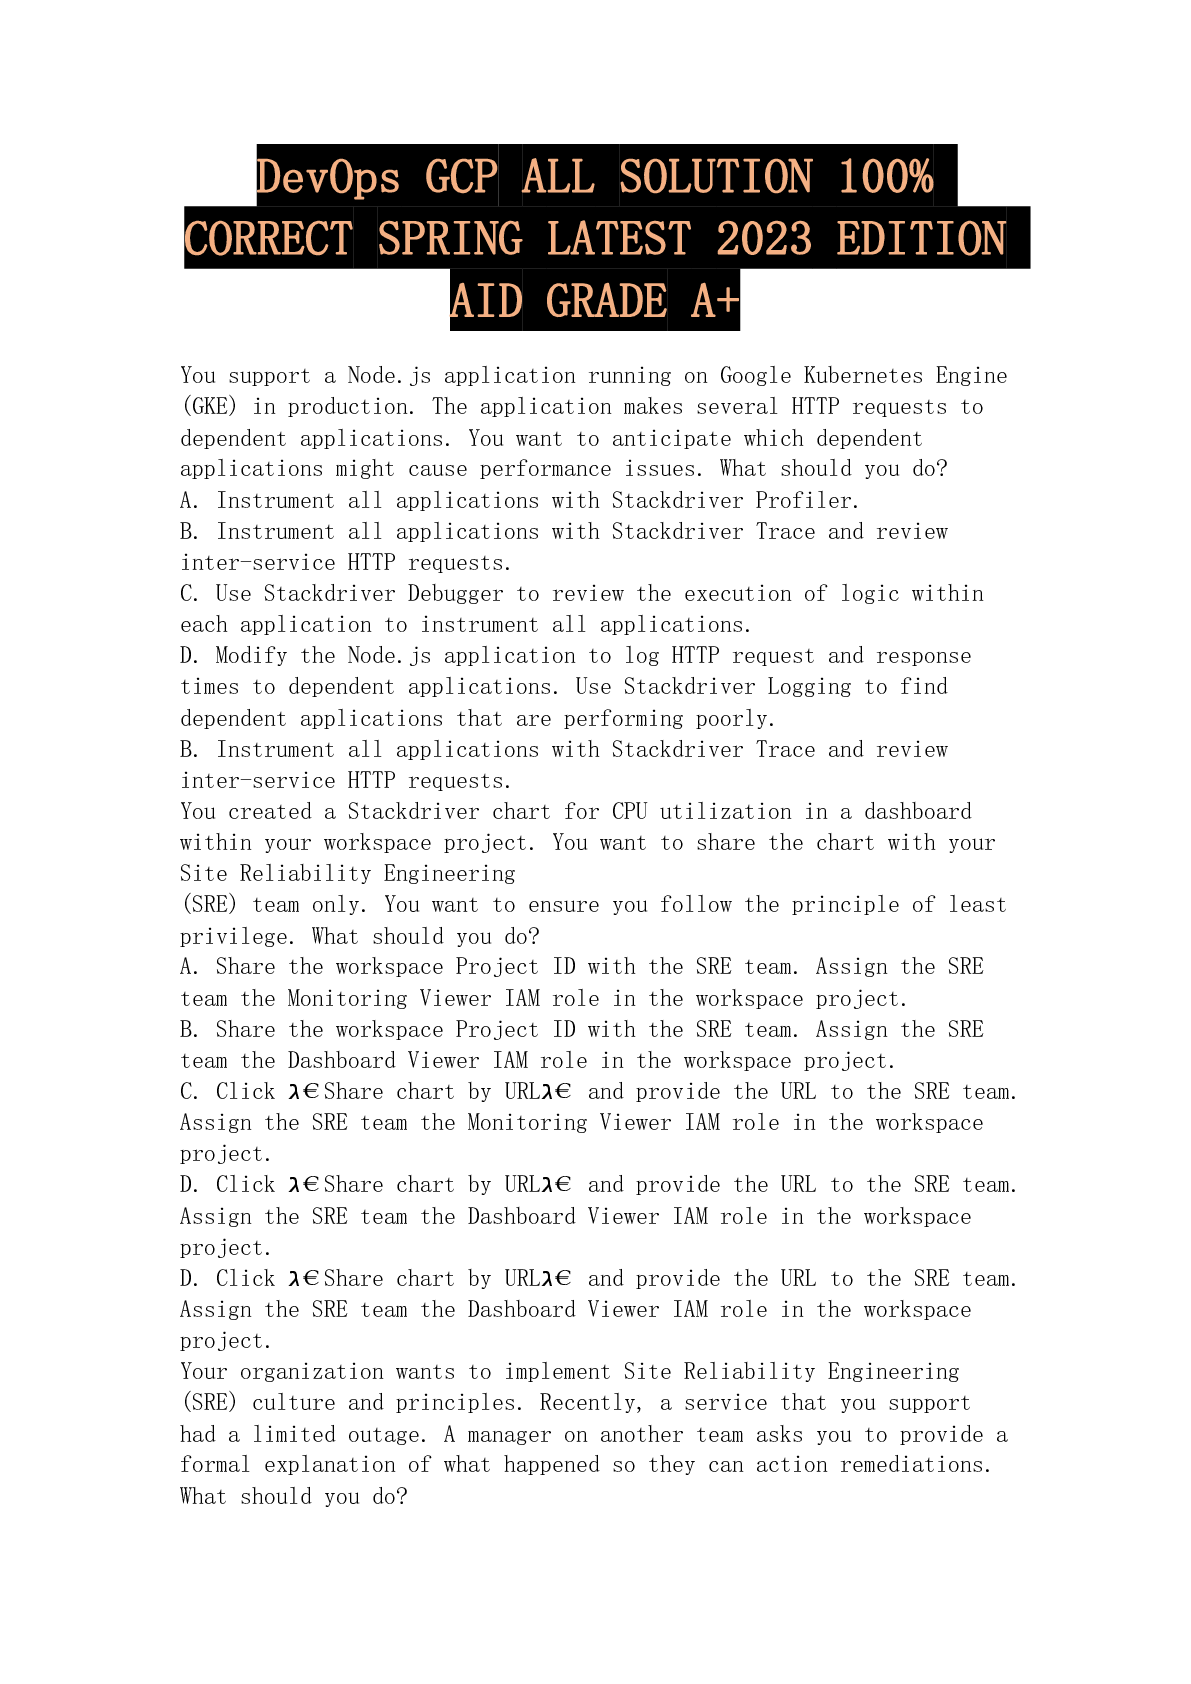
You support a Node.js application running on Google Kubernetes Engine (GKE) in production. The application makes several HTTP requests to dependent applications. You want to anticipate which dependent... applications might cause performance issues. What should you do? A. Instrument all applications with Stackdriver Profiler. B. Instrument all applications with Stackdriver Trace and review inter-service HTTP requests. C. Use Stackdriver Debugger to review the execution of logic within each application to instrument all applications. D. Modify the Node.js application to log HTTP request and response times to dependent applications. Use Stackdriver Logging to find dependent applications that are performing poorly. B. Instrument all applications with Stackdriver Trace and review inter-service HTTP requests. You created a Stackdriver chart for CPU utilization in a dashboard within your workspace project. You want to share the chart with your Site Reliability Engineering (SRE) team only. You want to ensure you follow the principle of least privilege. What should you do? A. Share the workspace Project ID with the SRE team. Assign the SRE team the Monitoring Viewer IAM role in the workspace project. B. Share the workspace Project ID with the SRE team. Assign the SRE team the Dashboard Viewer IAM role in the workspace project. C. Click ג€Share chart by URLג€ and provide the URL to the SRE team. Assign the SRE team the Monitoring Viewer IAM role in the workspace project. D. Click ג€Share chart by URLג€ and provide the URL to the SRE team. Assign the SRE team the Dashboard Viewer IAM role in the workspace project. D. Click ג€Share chart by URLג€ and provide the URL to the SRE team. Assign the SRE team the Dashboard Viewer IAM role in the workspace project. Your organization wants to implement Site Reliability Engineering (SRE) culture and principles. Recently, a service that you support had a limited outage. A manager on another team asks you to provide a formal explanation of what happened so they can action remediations. What should you do? A. Develop a postmortem that includes the root causes, resolution, lessons learned, and a prioritized list of action items. Share it with the manager only. B. Develop a postmortem that includes the root causes, resolution, lessons learned, and a prioritized list of action items. Share it on the engineering organization's document portal. C. Develop a postmortem that includes the root causes, resolution, lessons learned, the list of people responsible, and a list of action items for each person. Share it with the manager only. D. Develop a postmortem that includes the root causes, resolution, lessons learned, the list of people responsible, and a list of action items for each person. Share it on the engineering organization's document portal. B. Develop a postmortem that includes the root causes, resolution, lessons learned, and a prioritized list of action items. Share it on the engineering organization's document portal. You have a set of applications running on a Google Kubernetes Engine (GKE) cluster, and you are using Stackdriver Kubernetes Engine Monitoring. You are bringing a new containerized application required by your company into production. This application is written by a third party and cannot be modified or reconfigured. The application writes its log information to /var/log/app_messages.log, and you want to send these log entries to Stackdriver Logging. What should you do? A. Use the default Stackdriver Kubernetes Engine Monitoring agent configuration. B. Deploy a Fluentd daemonset to GKE. Then create a customized input and output configuration to tail the log file in the application's pods and write to Stackdriver Logging. C. Install Kubernetes on Google Compute Engine (GCE) and redeploy your applications. Then customize the built-in Stackdriver Logging configuration to tail the log file in the application's pods and write to Stackdriver Logging. D. Write a script to tail the log file within the pod and write entries to standard output. Run the script as a sidecar container with the application's pod. Configure a shared volume between the containers to allow the script to have read access to /var/log in the application container. B. Deploy a Fluentd daemonset to GKE. Then create a customized input and output configuration to tail the log file in the application's pods and write to Stackdriver Logging. You are running an application in a virtual machine (VM) using a custom Debian image. The image has the Stackdriver Logging agent installed. The VM has the cloud-platform scope. The application is logging information via syslog. You want to use Stackdriver Logging in the Google Cloud Platform Console to visualize the logs. You notice that syslog is not showing up in the "All logs" dropdown list of the Logs Viewer. What is the first thing you should do? A. Look for the agentג€™s test log entry in the Logs Viewer. B. Install the most recent version of the Stackdriver agent. C. Verify the VM service account access scope includes the monitoring.write scope. D. SSH to the VM and execute the following commands on your VM: ps ax | grep fluentd. C. Verify the VM service account access scope includes the monitoring.write scope. You use a multiple step Cloud Build pipeline to build and deploy your application to Google Kubernetes Engine (GKE). You want to integrate with a third-party monitoring platform by performing a HTTP POST of the build information to a webhook. You want to minimize the development effort. What should you do? A. Add logic to each Cloud Build step to HTTP POST the build information to a webhook. B. Add a new step at the end of the pipeline in Cloud Build to HTTP POST the build information to a webhook. C. Use Stackdriver Logging to create a logs-based metric from the Cloud Build logs. Create an Alert with a Webhook notification type. D. Create a Cloud Pub/Sub push subscription to the Cloud Build cloud-builds PubSub topic to HTTP POST the build information to a webhook. D. Create a Cloud Pub/Sub push subscription to the Cloud Build cloud-builds PubSub topic to HTTP POST the build information to a webhook. You use Spinnaker to deploy your application and have created a canary deployment stage in the pipeline. Your application has an in-memory cache that loads objects at start time. You want to automate the comparison of the canary version against the production version. How should you configure the canary analysis? A. Compare the canary with a new deployment of the current production version. B. Compare the canary with a new deployment of the previous production version. C. Compare the canary with the existing deployment of the current production version. D. Compare the canary with the average performance of a sliding window of previous production versions. A. Compare the canary with a new deployment of the current production version. You support a high-traffic web application and want to ensure that the home page loads in a timely manner. As a first step, you decide to implement a Service Level Indicator (SLI) to represent home page request latency with an acceptable page load time set to 100 ms. What is the Google-recommended way of calculating this SLI? A. Bucketize the request latencies into ranges, and then compute the percentile at 100 ms. B. Bucketize the request latencies into ranges, and then compute the median and 90th percentiles. C. Count the number of home page requests that load in under 100 ms, and then divide by the total number of home page requests. D. Count the number of home page request that load in under 100 ms, and then divide by the total number of all web application request. C. Count the number of home page requests that load in under 100 ms, and then divide by the total number of home page requests. You deploy a new release of an internal application during a weekend maintenance window when there is minimal user tragic. After the window ends, you learn that one of the new features isn't working as expected in the production environment. After an extended outage, you roll back the new release and deploy a fix.You want to modify your release process to reduce the mean time to recovery so you can avoid extended outages in the future. What should you do? (Choose two.) A. Before merging new code, require 2 different peers to review the code changes. B. Adopt the blue/green deployment strategy when releasing new code via a CD server. C. Integrate a code linting tool to validate coding standards before any code is accepted into the repository. D. Require developers to run automated integration tests on their local development environments before release. E. Configure a CI server. Add a suite of unit tests to your code and have your CI server run them on commit and verify any changes. Reveal Solution Discussion 7 B. Adopt the blue/green deployment strategy when releasing new code via a CD server. E. Configure a CI server. Add a suite of unit tests to your code and have your CI server run them on commit and verify any changes. You have a pool of application servers running on Compute Engine. You need to provide a secure solution that requires the least amount of configuration and allows developers to easily access application logs for troubleshooting. How would you implement the solution on GCP? A. ג€¢ Deploy the Stackdriver logging agent to the application servers. ג€¢ Give the developers the IAM Logs Viewer role to access Stackdriver and view logs. B. ג€¢ Deploy the Stackdriver logging agent to the application servers. ג€¢ Give the developers the IAM Logs Private Logs Viewer role to access Stackdriver and view logs. C. ג€¢ Deploy the Stackdriver monitoring agent to the application servers. ג€¢ Give the developers the IAM Monitoring Viewer role to access Stackdriver and view metrics. D. ג€¢ Install the gsutil command line tool on your application servers. ג€¢ Write a script using gsutil to upload your application log to a Cloud Storage bucket, and then schedule it to run via cron every 5 minutes. ג€¢ Give the developers the IAM Object Viewer access to view the logs in the specified bucket. A. ג€¢ Deploy the Stackdriver logging agent to the application servers. ג€¢ Give the developers the IAM Logs Viewer role to access Stackdriver and view logs. You support the backend of a mobile phone game that runs on a Google Kubernetes Engine (GKE) cluster. The application is serving HTTP requests from users.You need to implement a solution that will reduce the network cost. What should you do? A. Configure the VPC as a Shared VPC Host project. B. Configure your network services on the Standard Tier. C. Configure your Kubernetes duster as a Private Cluster. D. Configure a Google Cloud HTTP Load Balancer as Ingress. D. Configure a Google Cloud HTTP Load Balancer as Ingress. You encountered a major service outage that affected all users of the service for multiple hours. After several hours of incident management, the service returned to normal, and user access was restored. You need to provide an incident summary to relevant stakeholders following the Site Reliability Engineering recommended practices. What should you do first? A. Call individual stakeholders to explain what happened. B. Develop a post-mortem to be distributed to stakeholders. C. Send the Incident State Document to all the stakeholders. D. Require the engineer responsible to write an apology email to all stakeholders. B. Develop a post-mortem to be distributed to stakeholders. 00:02 01:23 You are performing a semi-annual capacity planning exercise for your flagship service. You expect a service user growth rate of 10% month-over-month over the next six months. Your service is fully containerized and runs on Google Cloud Platform (GCP), using a Google Kubernetes Engine (GKE) Standard regional cluster on three zones with cluster autoscaler enabled. You currently consume about 30% of your total deployed CPU capacity, and you require resilience against the failure of a zone. You want to ensure that your users experience minimal negative impact as a result of this growth or as a result of zone failure, while avoiding unnecessary costs. How should you prepare to handle the predicted growth? A. Verify the maximum node pool size, enable a horizontal pod autoscaler, and then perform a load test to verify your expected resource needs. B. Because you are deployed on GKE and are using a cluster autoscaler, your GKE cluster will scale automatically regardless of growth rate. C. Because you are at only 30% utilization, you have significant headroom and you wonג€™t need to add any additional capacity for this rate of growth. D. Proactively add 60% more node capacity to account for six months of 10% growth rate, and then perform a load test to make sure you have enough. Reveal Solution A. Verify the maximum node pool size, enable a horizontal pod autoscaler, and then perform a load test to verify your expected resource needs. Your application images are built and pushed to Google Container Registry (GCR). You want to build an automated pipeline that deploys the application when the image is updated while minimizing the development effort. What should you do? A. Use Cloud Build to trigger a Spinnaker pipeline. B. Use Cloud Pub/Sub to bigger a Spinnaker pipeline. C. Use a custom builder in Cloud Build to trigger Jenkins pipeline. D. Use Cloud Pub/Sub to trigger a custom deployment service running in Google Kubernetes Engine (GKE). Reveal Solution Discussion 10 B. Use Cloud Pub/Sub to bigger a Spinnaker pipeline. Your product is currently deployed in three Google Cloud Platform (GCP) zones with your users divided between the zones. You can fail over from one zone to another, but it causes a 10-minute service disruption for the affected users. You typically experience a database failure once per quarter and can detect it within five minutes. You are cataloging the reliability risks of a new real-time chat feature for your product. You catalog the following information for each risk: ג€¢ Mean Time to Detect (MTTD) in minutes ג€¢ Mean Time to Repair (MTTR) in minutes ג€¢ Mean Time Between Failure (MTBF) in days ג€¢ User Impact Percentage The chat feature requires a new database system that takes twice as long to successfully fail over between zones. You want to account for the risk of the new database failing in one zone. What would be the values for the risk of database failover with the new system? A. MTTD: 5 MTTR: 10 MTBF: 90 Impact: 33% B. MTTD: 5 MTTR: 20 MTBF: 90 Impact: 33% C. MTTD: 5 MTTR: 10 MTBF: 90 Impact: 50% D. MTTD: 5 MTTR: 20 MTBF: 90 Impact: 50% B. MTTD: 5 MTTR: 20 MTBF: 90 Impact: 33% You are managing the production deployment to a set of Google Kubernetes Engine (GKE) clusters. You want to make sure only images which are successfully built by your trusted CI/CD pipeline are deployed to production. What should you do? A. Enable Cloud Security Scanner on the clusters. B. Enable Vulnerability Analysis on the Container Registry. C. Set up the Kubernetes Engine clusters as private clusters. D. Set up the Kubernetes Engine clusters with Binary Authorization. D. Set up the Kubernetes Engine clusters with Binary Authorization You support an e-commerce application that runs on a large Google Kubernetes Engine (GKE) cluster deployed on-premises and on Google Cloud Platform. The application consists of microservices that run in containers. You want to identify containers that are using the most CPU and memory. What should you do? A. Use Stackdriver Kubernetes Engine Monitoring. B. Use Prometheus to collect and aggregate logs per container, and then analyze the results in Grafana. C. Use the Stackdriver Monitoring API to create custom metrics, and then organize your containers using groups. D. Use Stackdriver Logging to export application logs to BigQuery, aggregate logs per container, and then analyze CPU and memory consumption. C. Use the Stackdriver Monitoring API to create custom metrics, and then organize your containers using groups. Your company experiences bugs, outages, and slowness in its production systems. Developers use the production environment for new feature development and bug fixes. Configuration and experiments are done in the production environment, causing outages for users. Testers use the production environment for load testing, which often slows the production systems. You need to redesign the environment to reduce the number of bugs and outages in production and to enable testers to toad test new features. What should you do? CONTINUED.. [Show More]
Last updated: 1 year ago
Preview 1 out of 20 pages
Reviews( 0 )
Document information
Connected school, study & course
About the document
Uploaded On
Apr 18, 2023
Number of pages
20
Written in

Additional information
This document has been written for:
Uploaded
Apr 18, 2023
Downloads
0
Views
70