Physics > As Level Question Papers > Thursday 16 June 2022 – Morning A Level Physics B (Advancing Physics) H557/03 Practical skills in (All)
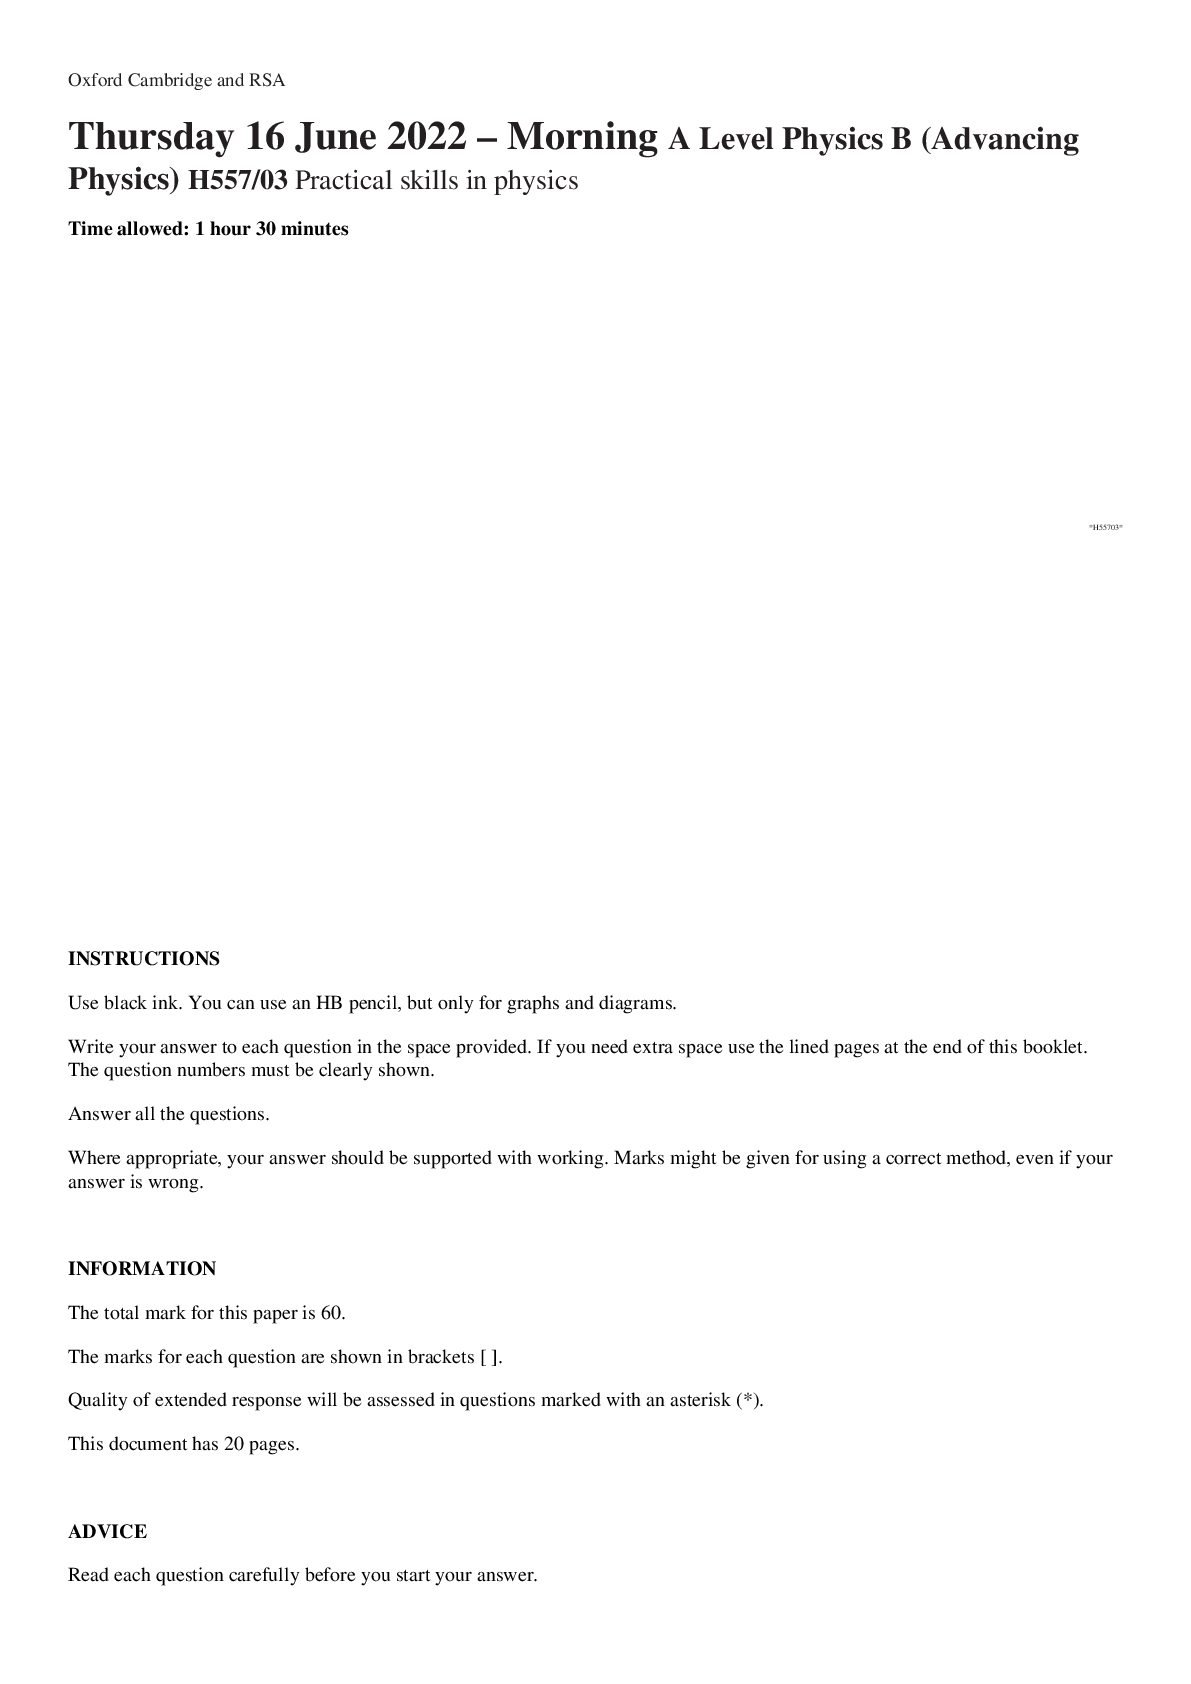
Thursday 16 June 2022 – Morning A Level Physics B (Advancing Physics) H557/03 Practical skills in physics
Document Content and Description Below
Oxford Cambridge and RSA Thursday 16 June 2022 – Morning A Level Physics B (Advancing Physics) H557/03 Practical skills in physics Time allowed: 1 hour 30 minutes * H 5 5 7 0 3 ... * INSTRUCTIONS • Use black ink. You can use an HB pencil, but only for graphs and diagrams. • Write your answer to each question in the space provided. If you need extra space use the lined pages at the end of this booklet. The question numbers must be clearly shown. • Answer all the questions. • Where appropriate, your answer should be supported with working. Marks might be given for using a correct method, even if your answer is wrong. INFORMATION • The total mark for this paper is 60. • The marks for each question are shown in brackets [ ]. • Quality of extended response will be assessed in questions marked with an asterisk (*). • This document has 20 pages. ADVICE • Read each question carefully before you start your answer. © OCR 2022 [601/4745/3] DC (ST/SW) 305576/4 OCR is an exempt Charity Turn over SECTION A Answer all the questions. 1 This question is about the polarisation of electromagnetic waves. (a) Explain what is meant by the term polarisation and state why all electromagnetic waves can be polarised. ................................................................................................................................................... ................................................................................................................................................... ................................................................................................................................................... .............................................................................................................................................. [2] (b) A student looks at light reflected from a glass block through one polarising filter. Explain how they could tell if the reflected light shows any polarisation. ................................................................................................................................................... ................................................................................................................................................... ................................................................................................................................................... ................................................................................................................................................... ................................................................................................................................................... .............................................................................................................................................. [3] (c) Another student investigates the polarisation of microwaves using apparatus shown in Fig. 1.1. Fig. 1.1 The grille starts in the vertical position as shown and is rotated. The intensity of the microwaves at the receiver is measured at different angles. (i) Describe how the angle of rotation could be measured in a school laboratory. ........................................................................................................................................... ........................................................................................................................................... ........................................................................................................................................... ...................................................................................................................................... [2] (ii) The results from the investigation are plotted on the graph shown in Fig. 1.2. Use data points from the graph below (excluding voltage = 0) to test whether the investigation shows that Intensity ∝ cos2θ Make your conclusion clear. 4.0 3.0 2.0 1.0 0.0 0 50 100 150 200 angle θ / ° Fig. 1.2 250 300 350 [3] 2 This question is about an investigation into the relationship between the pressure and volume of a gas. The relationship is often referred to as Boyle’s Law. A student set up the apparatus shown in Fig. 2.1. gas pressure gauge reservoir of air to air pump oil Fig. 2.1 (a) (i) Identify a variable which needs to be controlled in the investigation. ...................................................................................................................................... [1] (ii) Before setting up the apparatus, the student took measurements with vernier calipers of the internal diameter of the tube containing the gas. The student created the dot plot of cross‑sectional area shown in Fig. 2.2. Taking into consideration any outliers, calculate a value for the mean and percentage uncertainty of the cross‑sectional area of the tube. Give your answers to an appropriate number of significant figures. cross-sectional area / mm2 Fig. 2.2 Mean cross‑sectional area = ............................. mm2 ± % [4] (iii) The height, h, of the column of air is measured using a standard laboratory metre rule. Estimate the absolute uncertainty in the measurement and justify your answer. ........................................................................................................................................... ........................................................................................................................................... ...................................................................................................................................... [2] (b) The pressure gauge used in the experiment records excess pressure. The absolute pressure of the gas is given by absolute pressure = excess pressure + atmospheric pressure When the pressure gauge reads 255 kPa calculate the value for 1 and state the unit. Atmospheric pressure = 101 kPa. absolute pressure 1 = ................................... unit [2] Question 2 continues on page 6 The pressure of the gas is changed and the values for absolute pressure and height of the column of gas are recorded. The data are shown in Table 2.1. The student plots a graph to show the relationship between height of the column of gas and 1 / absolute pressure shown in Fig. 2.3. Height / m 1 / absolute pressure 0.150 2.82 × 10⁻⁶ 0.200 3.85 × 10⁻⁶ 0.250 5.90 × 10⁻⁶ 0.300 6.06 × 10⁻⁶ 0.350 7.69 × 10⁻⁶ 0.400 9.01 × 10⁻⁶ Table 2.1 16 12 8 4 0 0.12 0.18 0.24 0.30 0.36 height / m 0.42 Fig. 2.3 (c) * Suggest, with reasons, how the presentation of the graph in Fig. 2.3 could be improved, and identify any anomalous points. The student calculates the gradient to be 25 × 10–6 kN–1 m. Explain the physical significance of the gradient, state your assumptions, and estimate n, the number of moles of gas that would be present at a temperature of 298 K. ................................................................................................................................................... ................................................................................................................................................... ................................................................................................................................................... ................................................................................................................................................... ................................................................................................................................................... ................................................................................................................................................... ................................................................................................................................................... ................................................................................................................................................... ................................................................................................................................................... ................................................................................................................................................... ................................................................................................................................................... ................................................................................................................................................... ................................................................................................................................................... ................................................................................................................................................... ................................................................................................................................................... ................................................................................................................................................... .............................................................................................................................................. [6] 3 This question is about radioactive decay. (a) The decay equation is ΔN = –λN Δ where λ is the decay constant and N is the number of nuclei present. Explain what the decay constant represents for a particular radioisotope and the meaning of the negative sign in the equation. ................................................................................................................................................... ................................................................................................................................................... .............................................................................................................................................. [2] (b) The decay equation can be used to make an iterative model of radioactive decay. Initially a radioactive sample has 5000 nuclei. The decay constant is λ = 0.4 s–1. Using Δt = 1 s generates the model shown in Table 3.1. Time elapsed / s Number of nuclei, N Number of nuclei decaying in Δt = 1 s, ΔN = λNΔt Number of remaining nuclei at t + Δt, N – ΔN 0 5000 2000 3000 1 3000 1200 1800 2 1800 3 4 Table 3.1 (i) Complete the remaining rows of Table 3.1. [2] (ii) The decay graph has been started in Fig. 3.1. Complete the final three points on the graph using data from Table 3.1. [2] 6000 5000 4000 3000 2000 1000 0 0 1 2 3 4 5 time / s Fig. 3.1 (iii) How is the activity of the sample represented in this model? ........................................................................................................................................... ...................................................................................................................................... [1] (iv) Explain why a better model is created if Δt = 0.5 s. ........................................................................................................................................... ........................................................................................................................................... ...................................................................................................................................... [2] (c) Protactinium‑234 is a radioactive isotope which emits beta particles. It is produced in the school laboratory in a bottle containing a solution of a uranium compound. The bottle is shaken, and the protactinium‑234 separates out into the top layer of solvent. The radiation is then detected using a Geiger‑Muller tube connected to a counter. The number of counts in consecutive 10‑second intervals is recorded over a period of a few minutes. The count rate is found by correcting for the background count and then dividing this number of counts by ten. (i) Explain why 10‑second intervals over a period of a few minutes are suitable for this experiment. ........................................................................................................................................... ........................................................................................................................................... ...................................................................................................................................... [2] (ii) Fig. 3.2 shows a graph of ln(count rate) against t from this experiment. Use the graph to find a value for the decay constant for protactinium‑234 and hence the half‑life. Half‑life = [Show More]
Last updated: 11 months ago
Preview 1 out of 26 pages
Reviews( 0 )
Document information
Connected school, study & course
About the document
Uploaded On
Jun 14, 2023
Number of pages
26
Written in
Additional information
This document has been written for:
Uploaded
Jun 14, 2023
Downloads
0
Views
31





 H433-01 Fundamentals of Chemistry QUESTION PAPER Monday 13 June 2022 – Morning.png)
 H433-02 Scientific literacy in chemistry QUESTION PAPER Monday 20 June 2022 – Morning.png)

