MATH 225N Week 4 Statistics Quiz – Questions and Answers
Document Content and Description Below
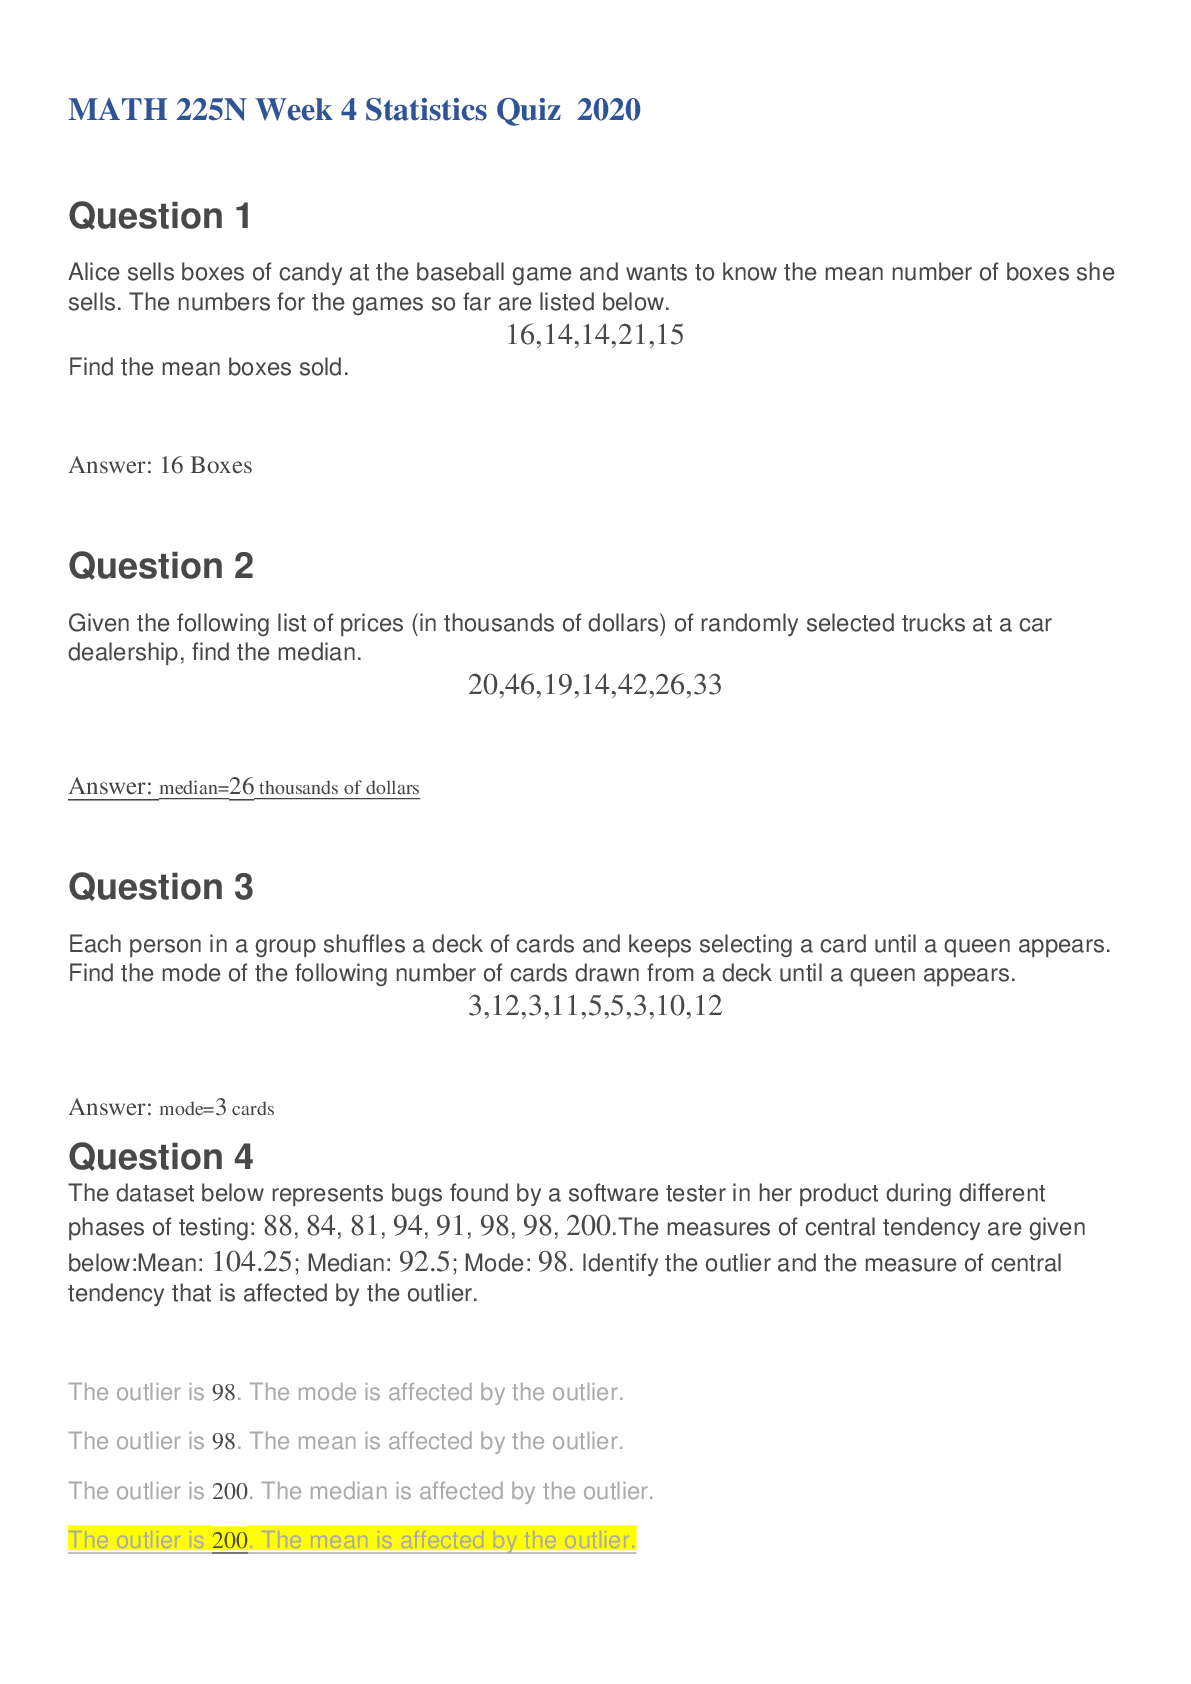
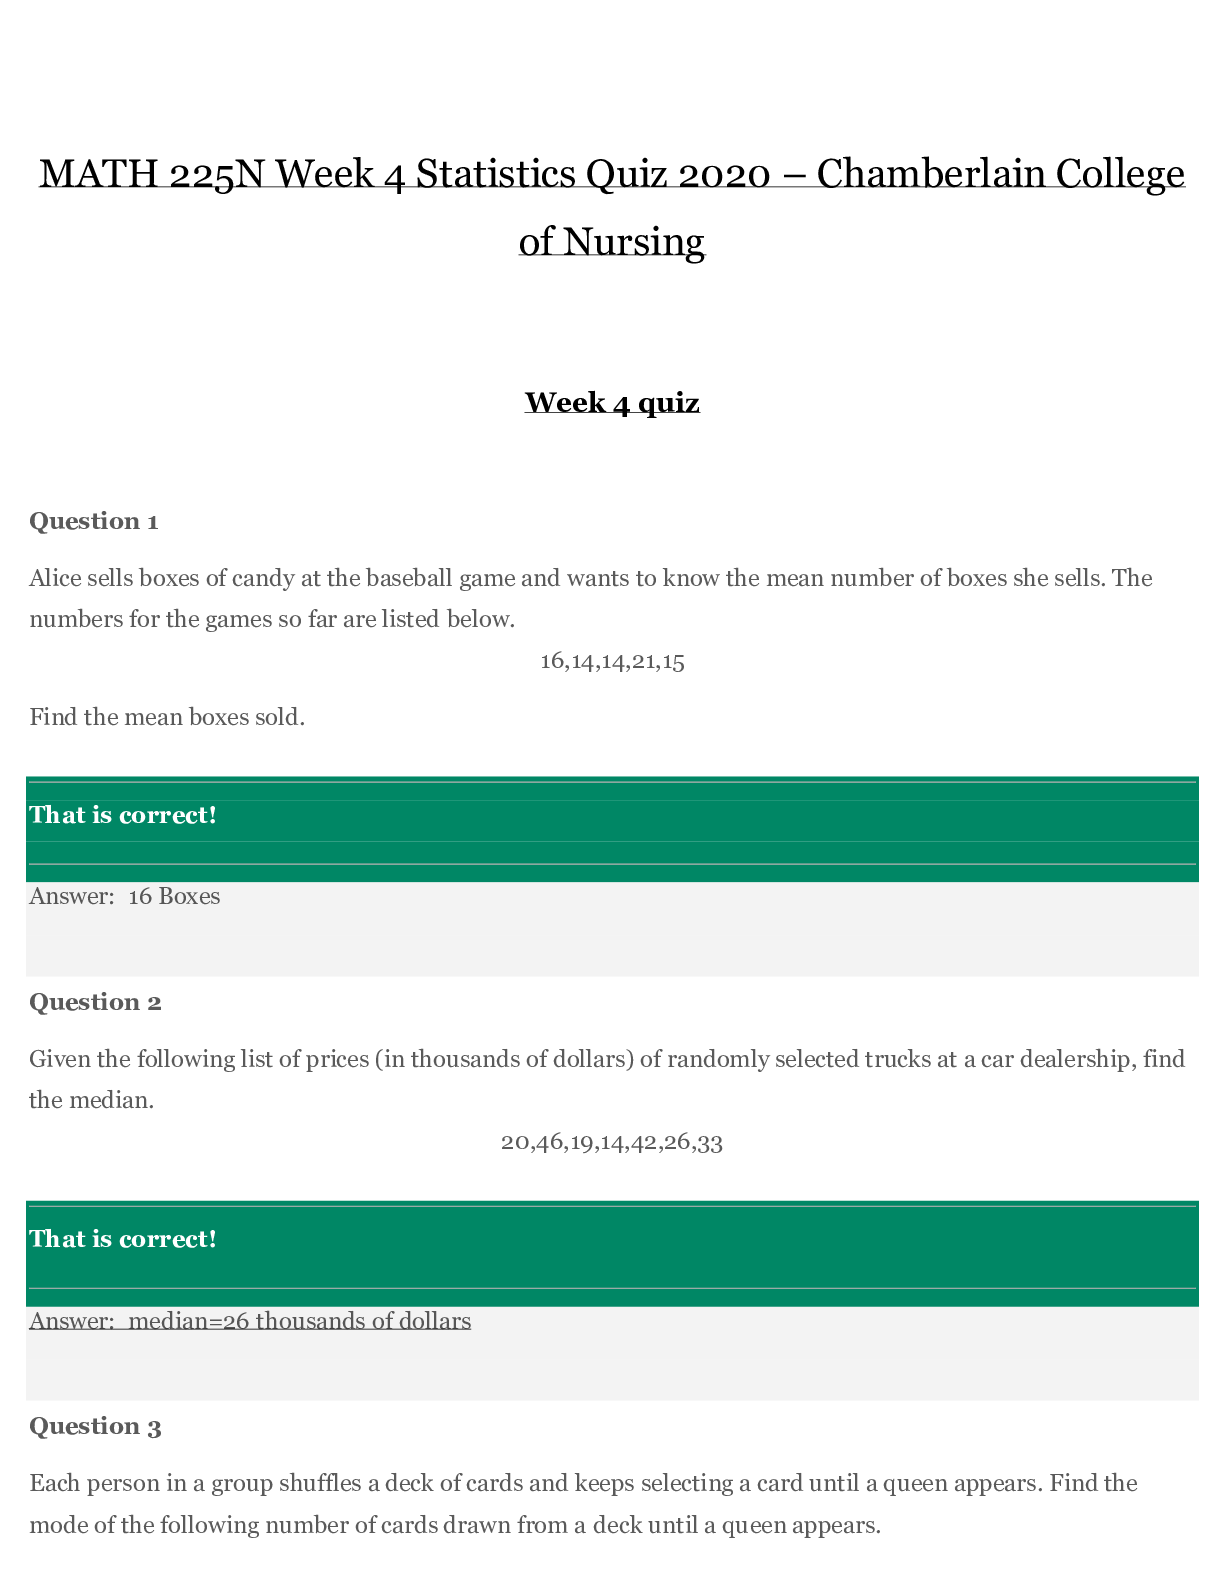
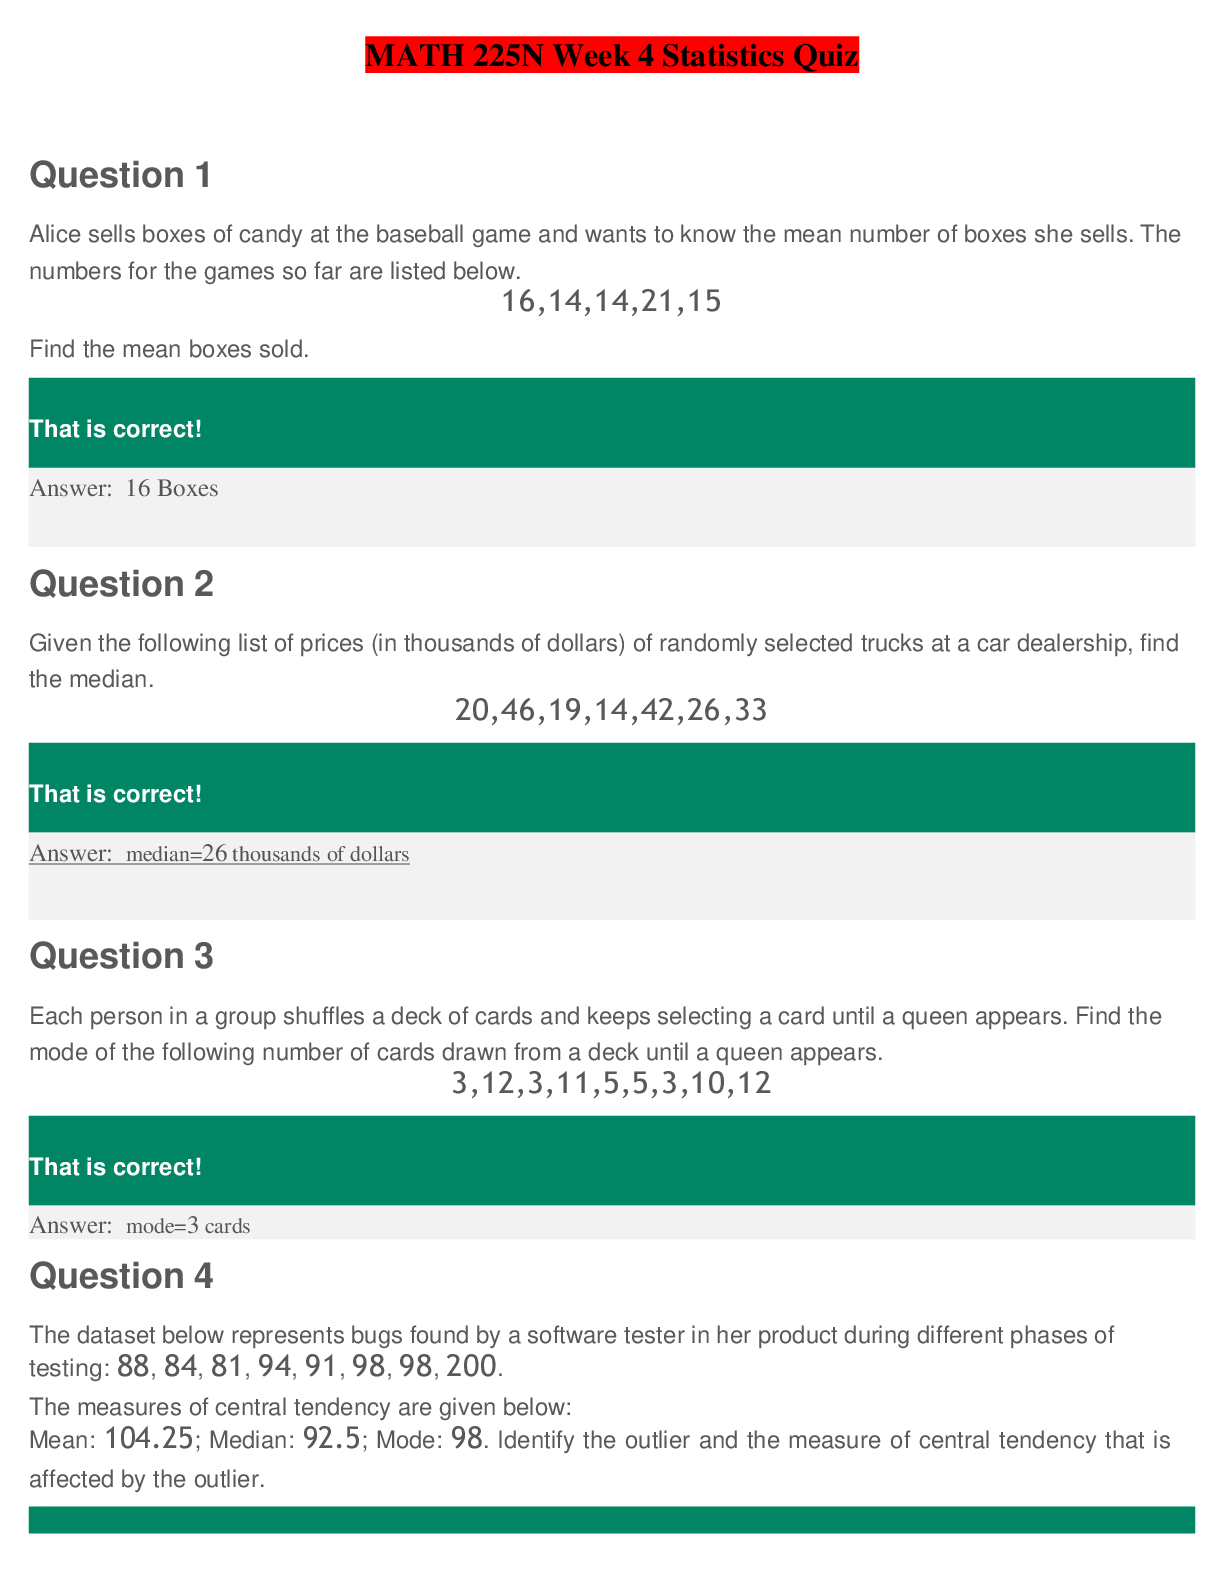
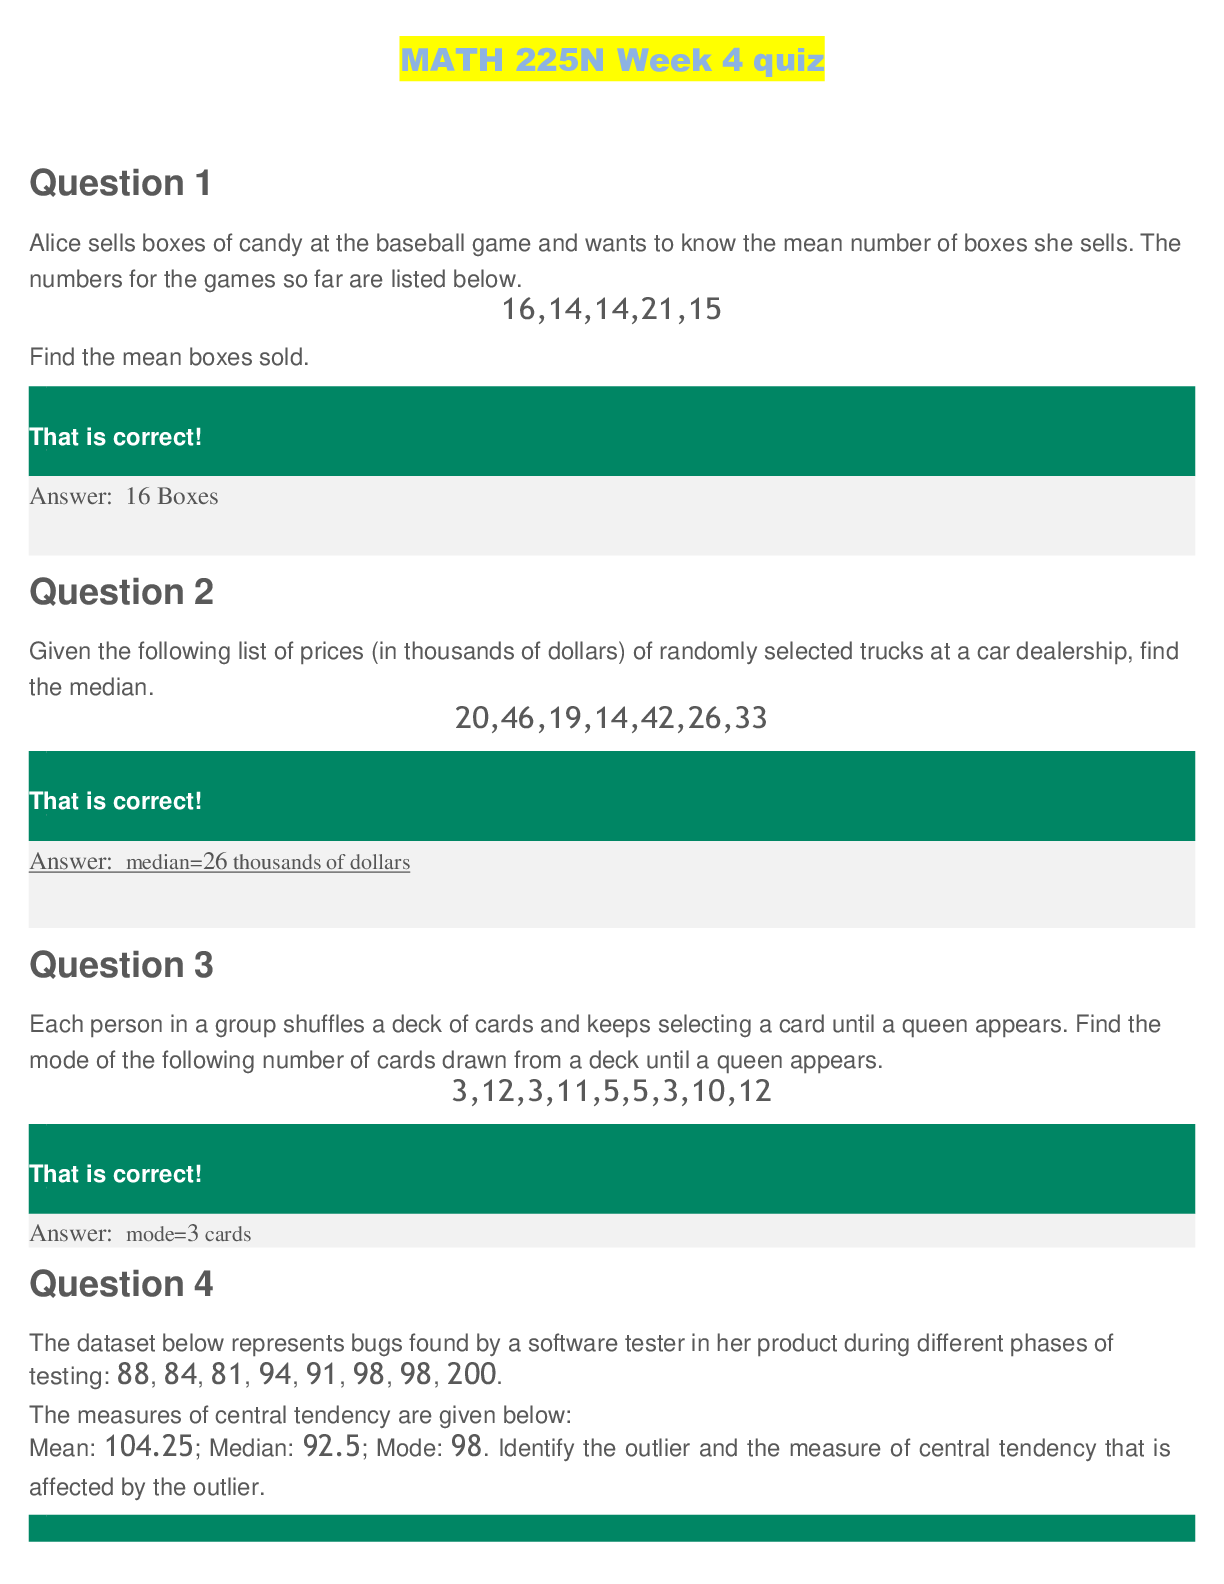
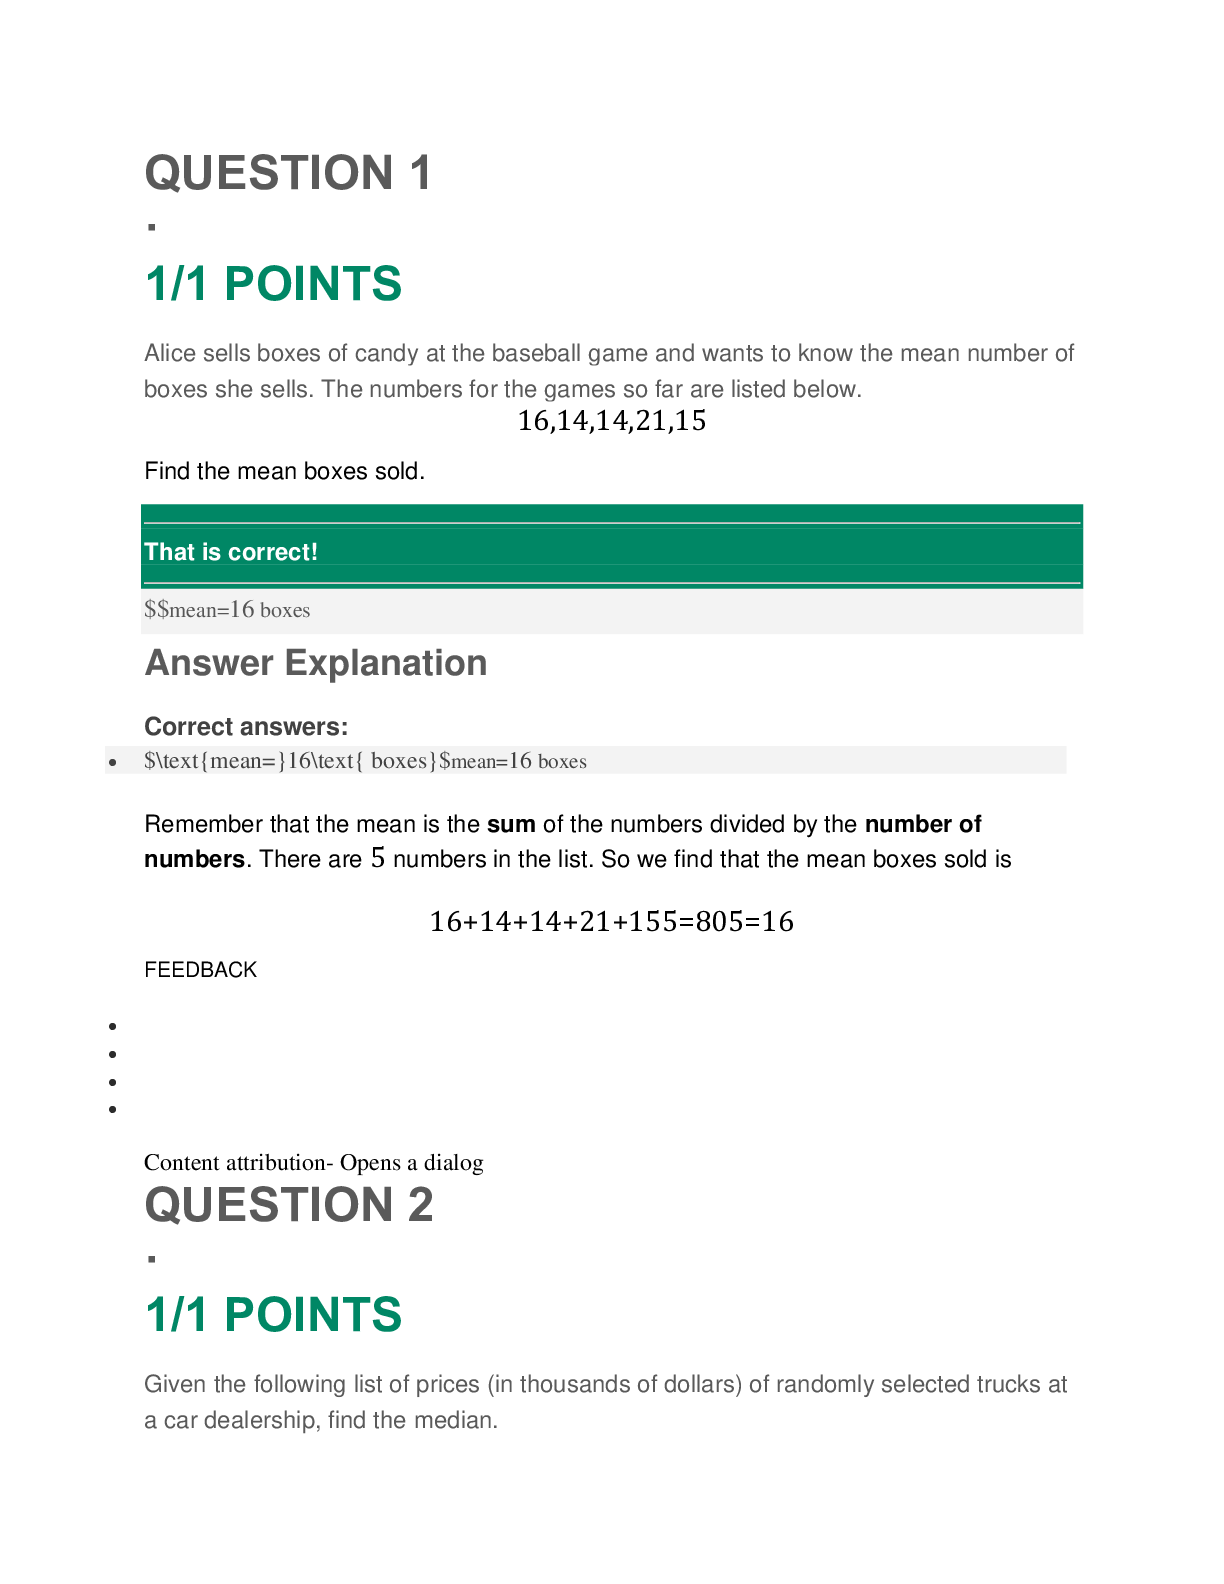
MATH 225N Week 4 Statistics Quiz – Questions and Answers QUESTION 1 · 1/1 POINTS Alice sells boxes of candy at the baseball game and wants to know the mean number of boxes she sells. The number... s for the games so far are listed below. 16,14,14,21,15 Find the mean boxes sold. ________________________________________ That is correct! ________________________________________ $$mean=16 boxes Answer Explanation Correct answers: • $\text{mean=}16\text{ boxes}$mean=16 boxes Remember that the mean is the sum of the numbers divided by the number of numbers. There are 5 numbers in the list. So we find that the mean boxes sold is 16+14+14+21+155=805=16 FEEDBACK • • • • Content attribution- Opens a dialog QUESTION 2 · 1/1 POINTS Given the following list of prices (in thousands of dollars) of randomly selected trucks at a car dealership, find the median. 20,46,19,14,42,26,33 ________________________________________ That is correct! ________________________________________ $$median=26 thousands of dollars Answer Explanation Correct answers: • $\text{median=}26\text{ thousands of dollars}$median=26 thousands of dollars It helps to put the numbers in order. 14,19,20,26,33,42,46 Now, because the list has length 7, which is odd, we know the median number will be the middle number. In other words, we can count to item 4 in the list, which is 26. So the median price (in thousands of dollars) of randomly selected trucks at a car dealership is 26. FEEDBACK • • • • Content attribution- Opens a dialog QUESTION 3 · 1/1 POINTS Each person in a group shuffles a deck of cards and keeps selecting a card until a queen appears. Find the mode of the following number of cards drawn from a deck until a queen appears. 3,12,3,11,5,5,3,10,12 ________________________________________ That is correct! ________________________________________ $$mode=3 cards Answer Explanation Correct answers: • $\text{mode=}3\text{ cards}$mode=3 cards If we count the number of times each value appears in the list, we get the following frequency table: Value Frequency 3 3 5 2 10 1 11 1 12 2 Note that 3 occurs 3 times, which is the greatest frequency, so 3 is the mode of the number of cards drawn from a deck until a queen appears. FEEDBACK • • • • Content attribution- Opens a dialog QUESTION 4 · 1/1 POINTS The dataset below represents bugs found by a software tester in her product during different phases of testing: 88, 84, 81, 94, 91, 98, 98, 200. The measures of central tendency are given below: Mean: 104.25; Median: 92.5; Mode: 98. Identify the outlier and the measure of central tendency that is affected by the outlier. ________________________________________ That is correct! ________________________________________ The outlier is 98. The mode is affected by the outlier. The outlier is 98. The mean is affected by the outlier. The outlier is 200. The median is affected by the outlier. The outlier is 200. The mean is affected by the outlier. Answer Explanation Correct answer: The outlier is 200. The mean is affected by the outlier. The data value 200 is significantly different from other data values in the dataset, so 200 is the outlier. The mean is affected by outliers. A data value that is far greater than the rest of the data values will cause the mean to be much greater than it would be if the data value were closer to the rest. In this case, the mean of 104.25 would not be a good measure of the center of the dataset since 7 of the 8 data values are less than 104.25. FEEDBACK • • • • Content attribution- Opens a dialog QUESTION 5 · 1/1 POINTS Given the following histogram, decide if the data is skewed or symmetrical. A bar graph has a horizontal axis titled Values labeled from 2 to 18 in increments of 2 and a vertical axis titled Frequency labeled from 0 to 200 in increments of 50. 14 bars are plotted, above the numbers 2 to 16. From left to right, the heights of the bars are as follows: 1. 5. 10. 40, 75, 125, 190, 180, 130, 125, 60, 25,20, 10. All values are approximate. ________________________________________ That is correct! ________________________________________ The data are skewed to the left. The data are skewed to the right. The data are symmetric. Answer Explanation Correct answer: .................continued......... [Show More]
Last updated: 1 year ago
Preview 1 out of 14 pages
Instant download
Buy this document to get the full access instantly
Instant Download Access after purchase
Add to cartInstant download
Also available in bundle (1)

MATH 225N Week 2,4,&6 Statistics Quizzes and Answers
MATH 225N Week 2,4,&6 Statistics Quizzes and Answers
By YourTutor 3 years ago
$40.5
3
Reviews( 0 )
Document information
Connected school, study & course
About the document
Uploaded On
Feb 15, 2021
Number of pages
14
Written in

Additional information
This document has been written for:
Uploaded
Feb 15, 2021
Downloads
0
Views
40