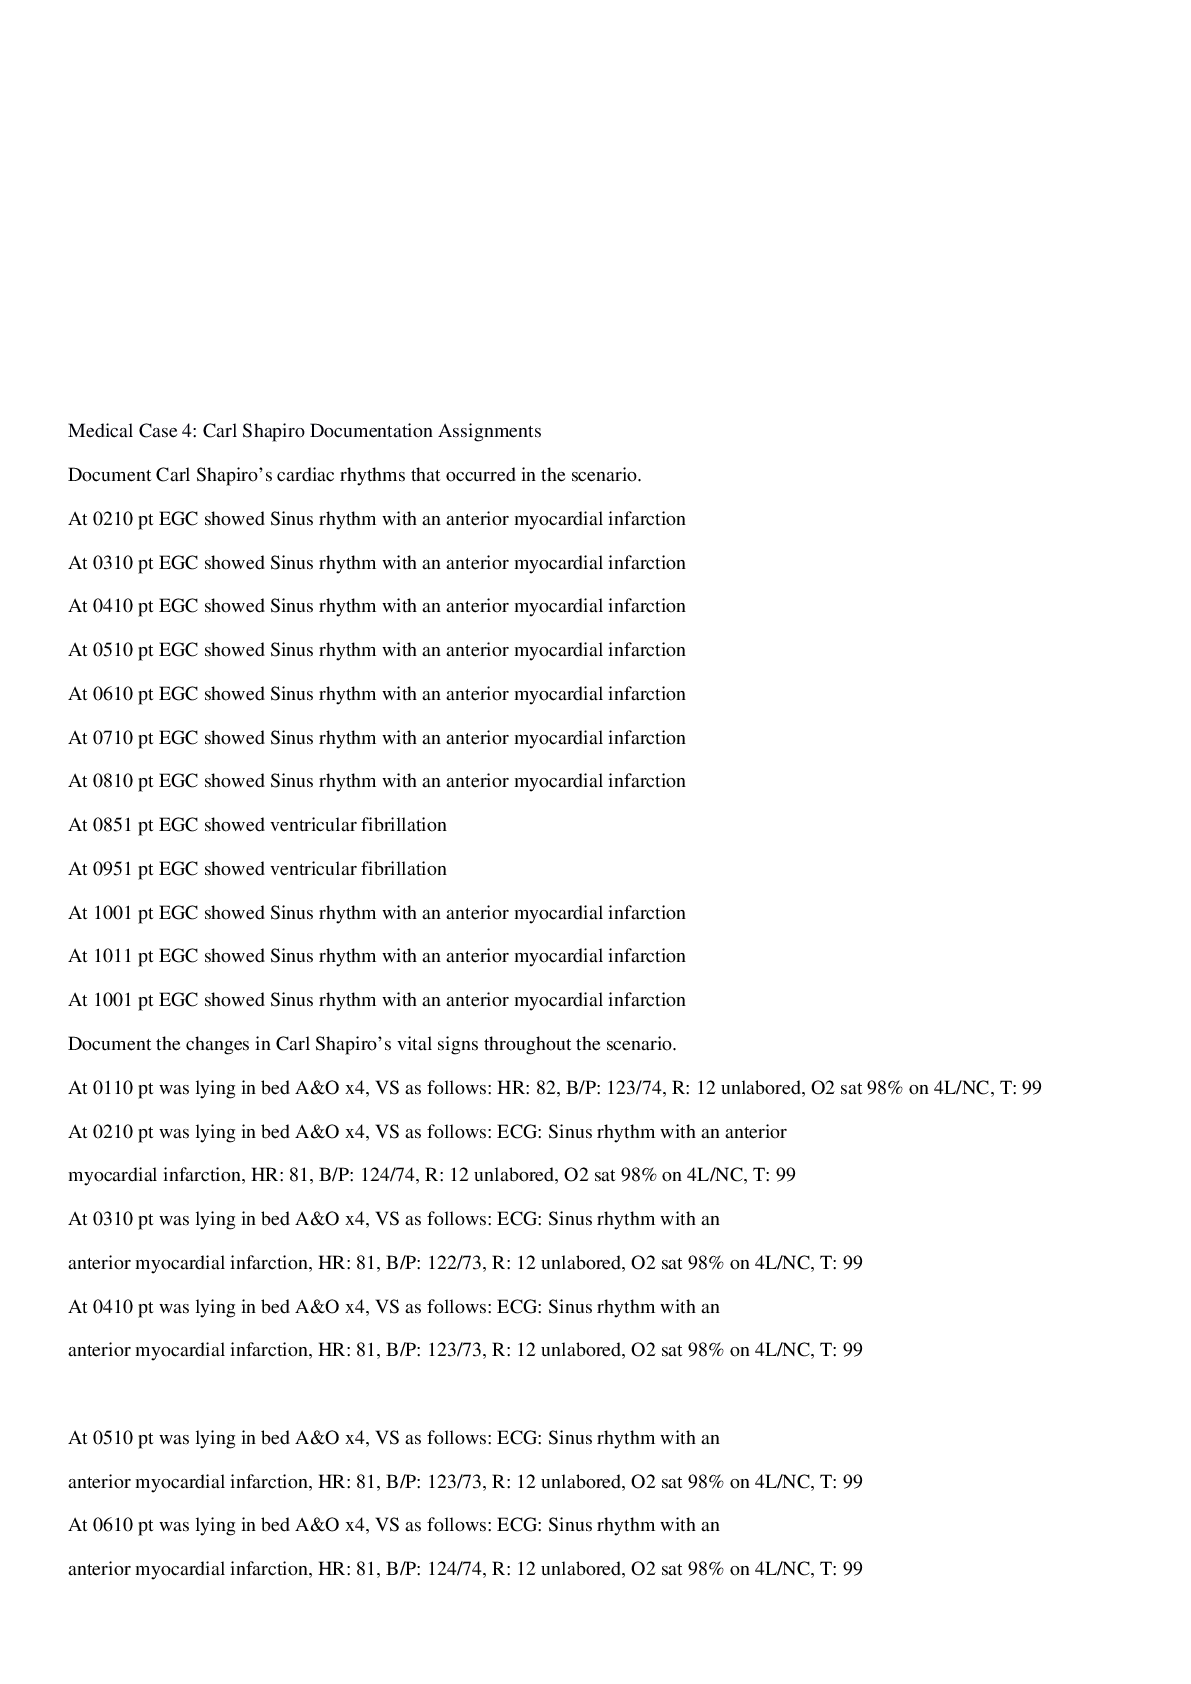
GLO-BUS – Decisions for Year 11|BUS 4993 Business Capstone Project.
Document Content and Description Below
Introduction After receiving the results from our year 10 business decisions we were pleasantly surprised in learning that we had achieved the ranking of first in the industry with a Weighted Avera... ge Score of a 94. Additionally, we were even happier to have been awarded a Leap Frog Award for raising our Current-Year Score by 14 points; this was accomplished by substantially increasing our Earnings Per Share (+2.09), Return on Equity (+13.2), and our Stock Price (+64.45 per share). While our primary focus in making our year 10 decisions were based on our need to increase Demand, Market Share and Sales, we have chosen to maintain similar goals as we enter year 11. Therefore, the purpose of this paper is to document the observations and analysis gathered from the journals and competitive reports from year 10, as well as how the data has facilitated the implementation of strategic business decisions that will support the further success of BeVisionary Cameras. Analysis and Strategic Plan for Year 11 As our team evaluated the Camera & Drone Journals, Competitive Intelligence Reports, and the Company Operating Reports from year 10 we were able to conduct our own trend analysis in regards to the behavioral patterns of specific regions and rival companies. In doing so, we were able to develop strategies that are tailored specifically for our highest competitors, as well as, specific approaches for each marketing region and segment. Furthermore, we had previously determined that we would need to rebuild our company Image Rating after choosing to increase the number of models that we provided for the AC Camera in year 10; this decision was made in order to raise our overall Market Share and Profitability at the sacrifice of our Image Rating. Therefore, as we entered into our decision-making efforts for year 11 we had clear GLO-BUS – Decisions for Year 11 4 cross-organizational goals that we wanted to accomplish including: the continued product development and increase in P/Q Ratings for our AC Camera and UVA Drones, the facilitation of growth for our Market Share, Product Demand, and Image Rating, while also maintaining a high Operating Profit Margin throughout each market segment and region. Business Decisions Product Design We were pleased in learning that our efforts towards the product development and P/Q ratings were validated in the Assembly and Production Benchmarks, where we are still conducting a profitable business model that requires costs that are predominantly below industry average and produce the highest Operating Profit in each region and product segment. With this in mind, we wanted to increase our P/Q ratings above the average in year 10 as well as the implementation of design attributes that would add points towards our Image Rating. [Show More]
Last updated: 1 year ago
Preview 1 out of 129 pages
Reviews( 0 )
Document information
Connected school, study & course
About the document
Uploaded On
Mar 30, 2021
Number of pages
129
Written in

Additional information
This document has been written for:
Uploaded
Mar 30, 2021
Downloads
0
Views
86
.png)


NSG110 AMERICANS RATE NURSES HIGHEST ON HONESTY, ETHICAL STANDARDS.png)


.png)