Statistics > EXAM > Sophia Statistics Final Milestone (All)
Sophia Statistics Final Milestone
Document Content and Description Below
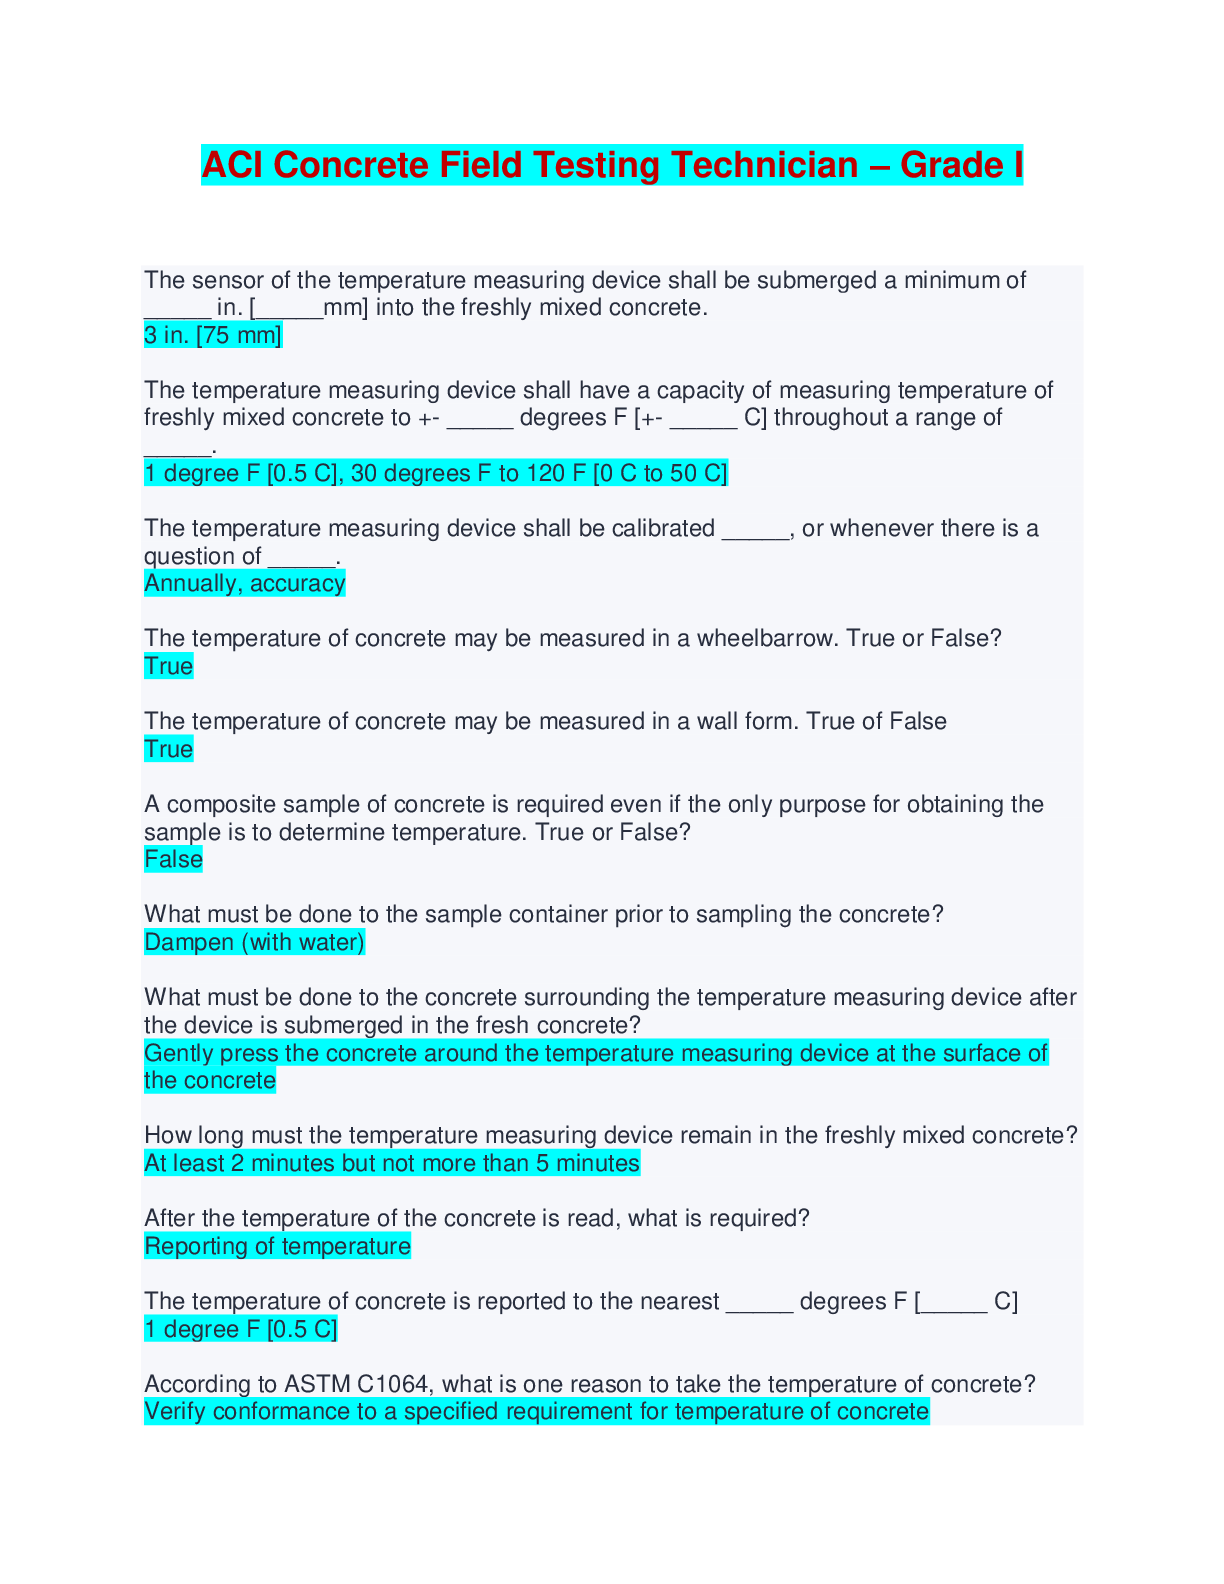
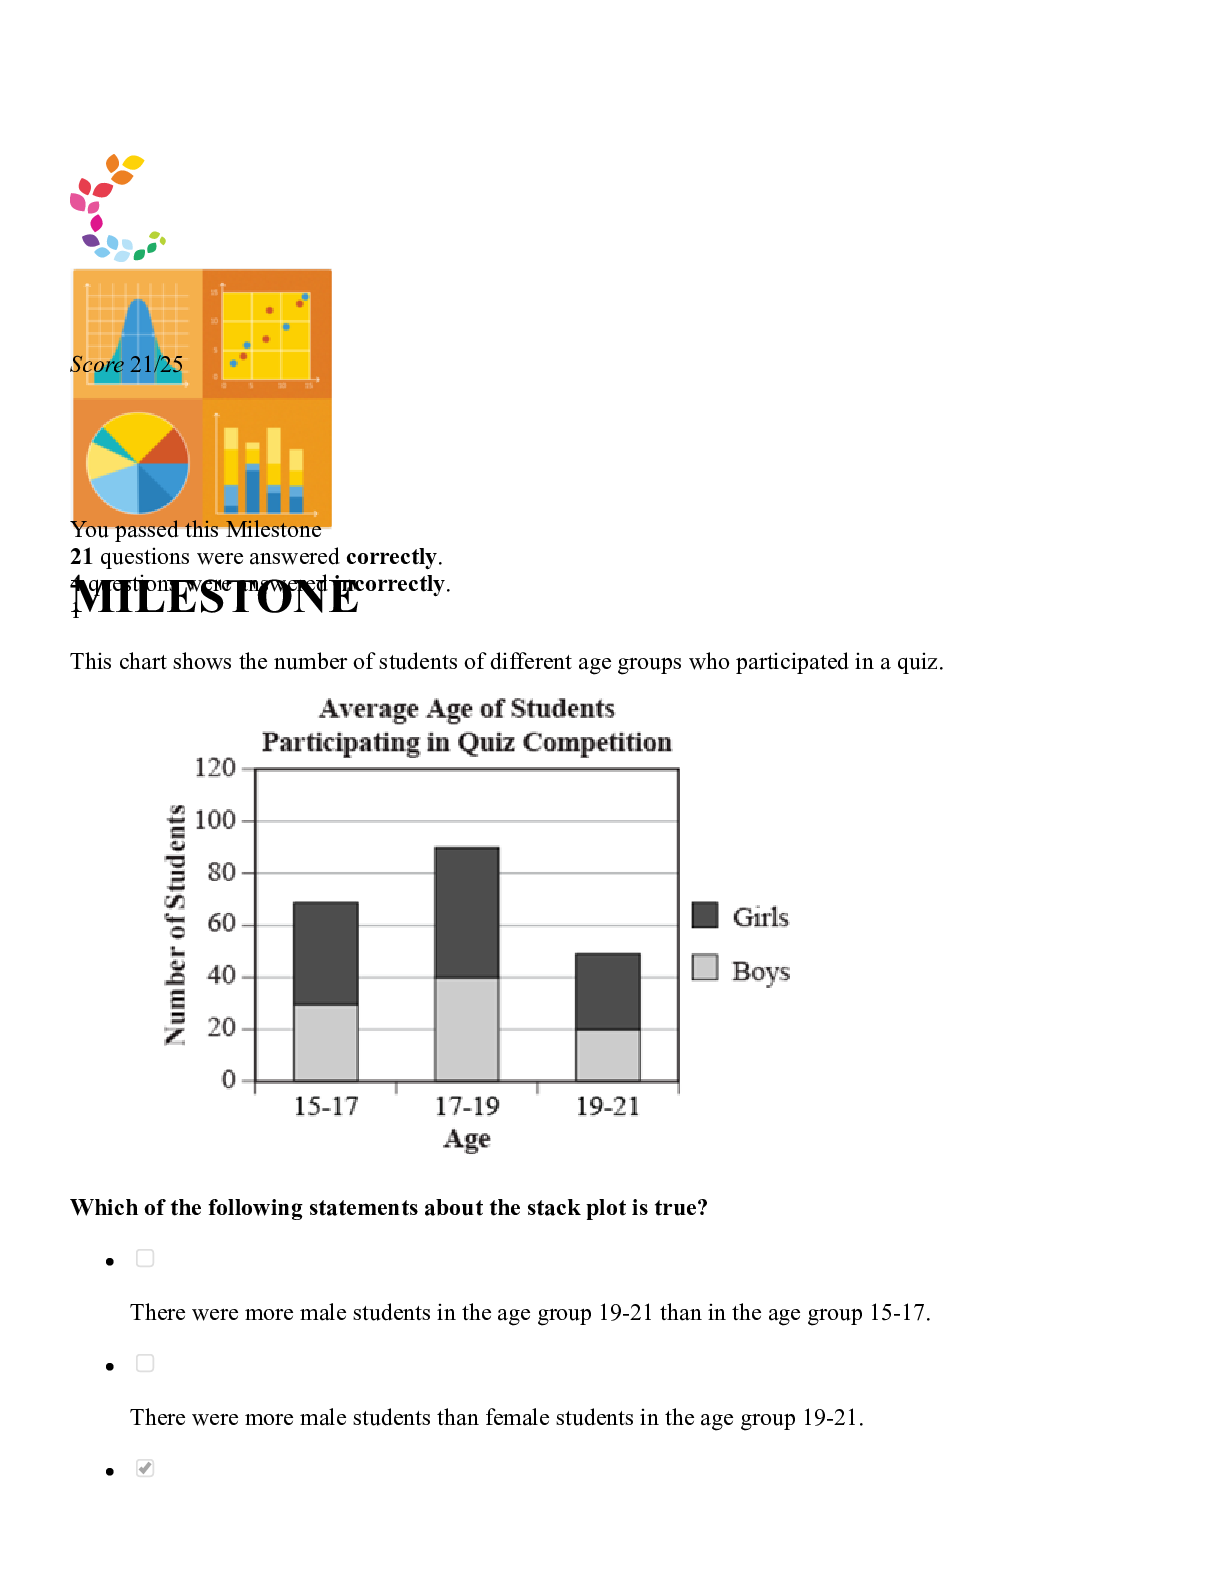
Sophia Statistics Final Milestone This chart shows the number of students of different age groups who participated in a quiz. Which of the following statements about the stack plot is true? There were... more male students in the age group 19-21 than in the age group 15-17. There were more male students than female students in the age group 19-21. There were more female students in the age group 17-19 than in any other age group. There were more students in the age group 15-17 than in any other age group. Which of the scenarios below will provide Jay with available data? Going to a local high school and asking the principal for information about students' previous grades, then interviewing a random selection of students about their eating habits. Going to a local high school and asking the principal for information about students' current and previous grades, then interviewing a random selection of students about their eating habits. Going to a local high school and asking the principal for information about students' current and previous grades, then asking the health teacher for the results from a survey students took in health class. Going to a local college and asking current undergraduates to report their grades and eating habits from high school. [Show More]
Last updated: 1 year ago
Preview 1 out of 21 pages
Also available in bundle (1)
SOPHIA PATHWAYS, STATISTICS MILESTONE and SOPHIA FINANCE Bundle.
Sophia Finance, SOPHIA PATHWAYS & Statistics Milestone Bundle
By A+ Solutions 2 years ago
$14.5
37
Reviews( 0 )
Document information
Connected school, study & course
About the document
Uploaded On
Apr 08, 2021
Number of pages
21
Written in

Additional information
This document has been written for:
Uploaded
Apr 08, 2021
Downloads
0
Views
112

.png)