SCIENCE 101 > QUESTIONS & ANSWERS > Questions and Answers > SCIENCE 101 Lizard-Predation- Student SCIENCE. All Questions Answered. (All)
Questions and Answers > SCIENCE 101 Lizard-Predation- Student SCIENCE. All Questions Answered.
Document Content and Description Below
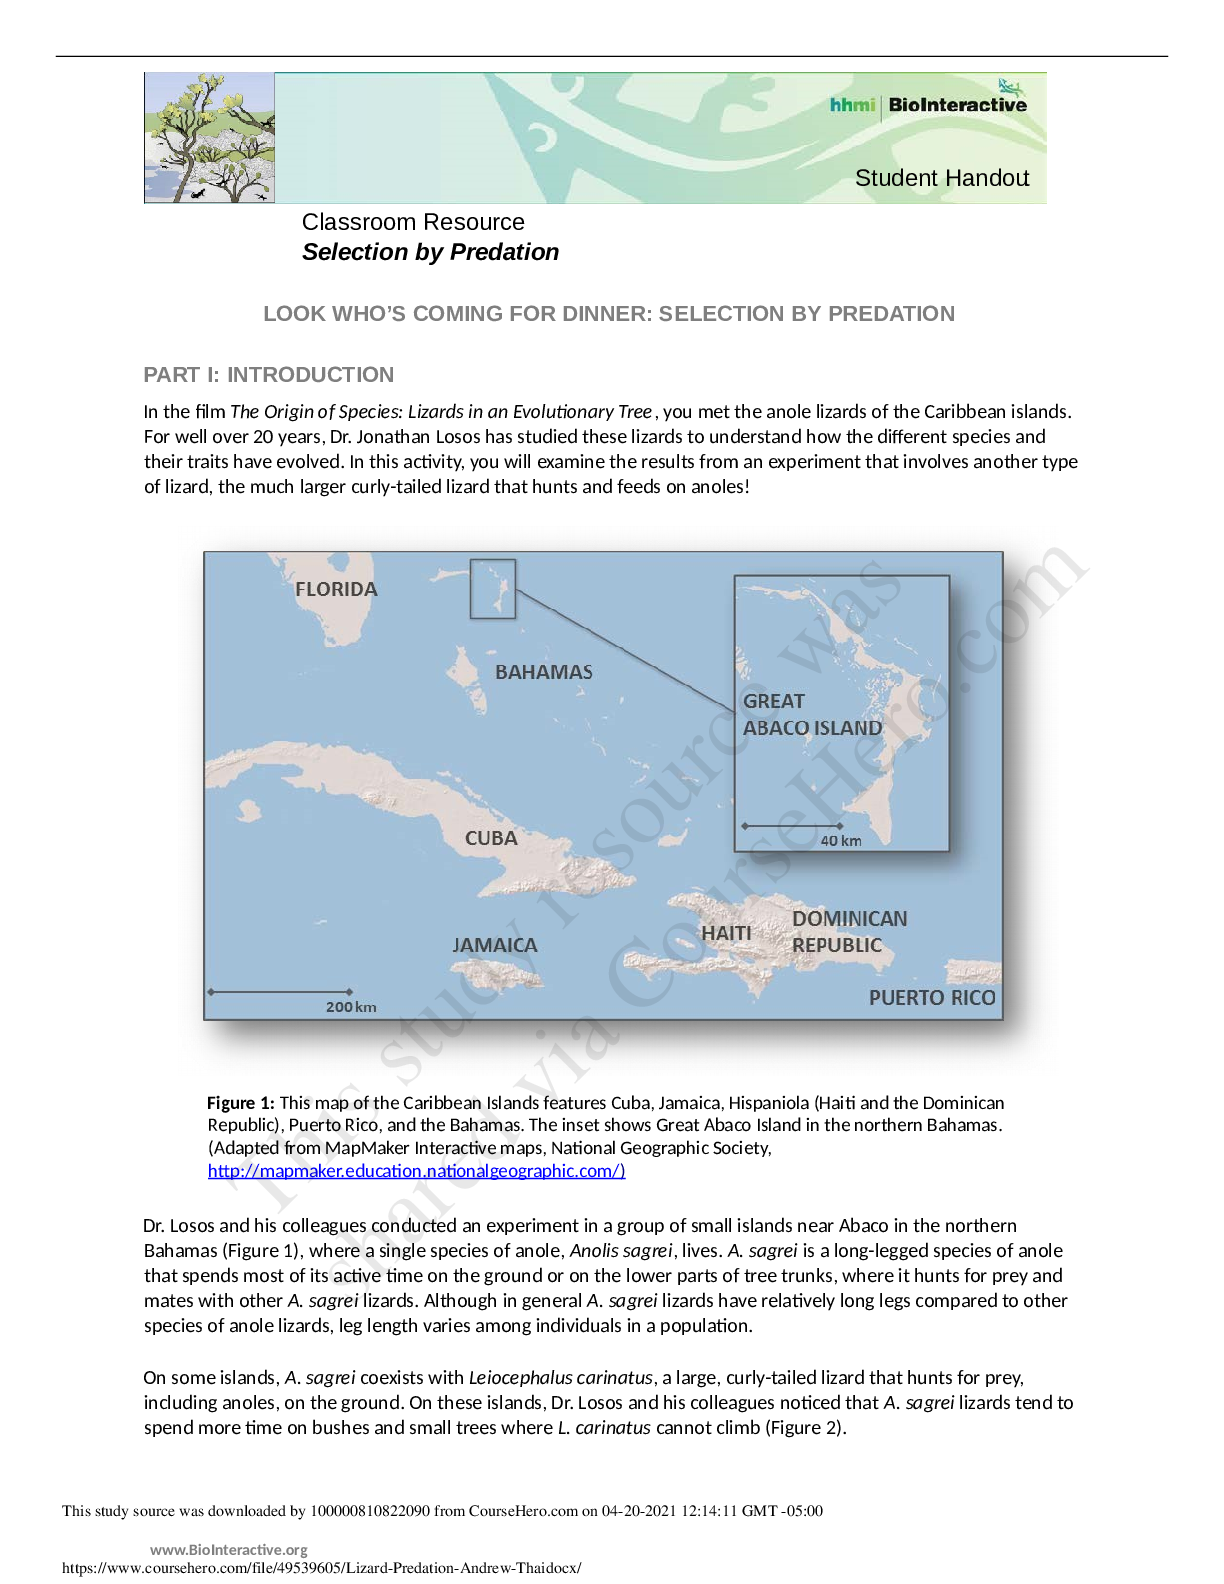
www.BioInteractive.org Published June 2015 Page 1 of 8 Student Handout Classroom Resource Selection by Predation LOOK WHO’S COMING FOR DINNER: SELECTION BY PREDATION PART I: INTRODUCTION In ... the film The Origin of Species: Lizards in an Evolutionary Tree, you met the anole lizards of the Caribbean islands. For well over 20 years, Dr. Jonathan Losos has studied these lizards to understand how the different species and their traits have evolved. In this activity, you will examine the results from an experiment that involves another type of lizard, the much larger curly-tailed lizard that hunts and feeds on anoles! Figure 1: This map of the Caribbean Islands features Cuba, Jamaica, Hispaniola (Haiti and the Dominican Republic), Puerto Rico, and the Bahamas. The inset shows Great Abaco Island in the northern Bahamas. (Adapted from MapMaker Interactive maps, National Geographic Society, http://mapmaker.education.nationalgeographic.com/) Dr. Losos and his colleagues conducted an experiment in a group of small islands near Abaco in the northern Bahamas (Figure 1), where a single species of anole, Anolis sagrei, lives. A. sagrei is a long-legged species of anole that spends most of its active time on the ground or on the lower parts of tree trunks, where it hunts for prey and mates with other A. sagrei lizards. Although in general A. sagrei lizards have relatively long legs compared to other species of anole lizards, leg length varies among individuals in a population. On some islands, A. sagrei coexists with Leiocephalus carinatus, a large, curly-tailed lizard that hunts for prey, including anoles, on the ground. On these islands, Dr. Losos and his colleagues noticed that A. sagrei lizards tend to spend more time on bushes and small trees where L. carinatus cannot climb (Figure 2). www.BioInteractive.org Page 2 of 8 Student Handout Classroom Resource Selection by Predation Figure 2. The illustration on the left shows that A. sagrei is mostly on the ground on islands without the predator lizard L. carinatus. On islands with L. carinatus, A. sagrei is found mostly on twigs and branches (illustration on the right). 1. Based on these initial observations by Dr. Losos and his colleagues, formulate a hypothesis regarding how L. carinatus affects where A. sagrei lives. Explain your reasoning. 0 www.BioInteractive.org Page 3 of 8 Student Handout Classroom Resource Selection by Predation PART II: HYPOTHESIS AND EXPERIMENT Dr. Losos and his colleagues hypothesized that the presence of the predatory curly-tailed lizard L. carinatus causes A. sagrei to live mostly higher off the ground, on small branches and bushes. Is this the same hypothesis you formulated? If not, go back and revise it. The scientists also hypothesized that, over many generations, the anoles living on small branches and bushes would evolve different features compared to anoles living on the ground. How would you test these two hypotheses? Here is the experiment Dr. Losos and his colleagues conducted: • They identified 12 small islands in the Bahamas with A. sagrei but not L. carinatus. Remember that A. sagrei live mostly on the ground or the lower parts of tree trunks and only occasionally climb higher branches and bushes. • At the start of the experiment, they counted and marked all A. sagrei individuals on each island and noted where they found them (i.e., on the ground or on branches). By marking the anoles, they could track this initial population of lizards over the course of the experiment. • They then introduced the curly-tailed predator, L. carinatus, on six of the islands. They added one predator for every seven A. sagrei lizards to ensure equal proportions on all islands. These were the experimental islands. • The six remaining islands without L. carinatus served as control islands. • They planned to return to each island every six months and monitor the population over several generations (one generation is about 12 months). Each time, they collected data on the lizards’ survival and leg length and made notes about where they found them (i.e., on the ground or on branches). PART III: DATA COLLECTION AND ANALYSIS After about a year, a hurricane swept all the lizards off the islands and terminated the experiment too early to monitor the lizards over several generations. So, unfortunately, Dr. Losos and colleagues were only able to return to the islands after six months and after 12 months and only gathered data on the original population. Both times they counted and noted the locations of A. sagrei survivors from the initial population, which had been marked at the beginning of the experiment. You will now analyze and interpret some of the data they collected. Survivors and Proportion on the Ground Your instructor will distribute 24 island “snapshot” cards representing eight of the islands (four control and four experimental islands) that Dr. Losos and colleagues studied at three different times (at the start, after six months, and after 12 months). Control islands are labeled A through D, experimental islands E through H. Your instructor may assign only a few snapshots to each group of students. Over time some of the anoles in the initial population died, so the snapshots show the number of anoles that were still alive after six and 12 months (i.e., the survivors). You will count the anoles and note their locations, just like Dr. Losos and colleagues did. After you receive your snapshots, follow these steps: a. Count all anoles (survivors) and calculate the proportion found on the ground. 0 www.BioInteractive.org Page 4 of 8 Student Handout Classroom Resource Selection by Predation b. Complete Table 1 (number of survivors) and Table 2 (proportion of survivors on the ground) for the snapshots you were given. If you were only given a few snapshots, your instructor will collect results from the entire class and you can then write down the missing numbers. c. Calculate the mean for the four numbers in each column and record the results in both tables. d. Complete questions 2 through 10. Table 1: Total number of A. sagrei from the initial population, not including offspring. NUMBER OF SURVIVORS CONTROL ISLANDS EXPERIMENTAL ISLANDS Island Start 6 Months 12 Months Island Start 6 Months 12 Months A E B F C G D H Mean Mean 2. Compare the means. Do you see any difference in the number of survivors between control and experimental islands over time? Explain your answer. 3. Some islands had more anoles than others at the start of the experiment. To determine whether there is a difference in survival between the control and experimental islands, you will need to calculate the proportion of lizards that survived on these islands over the course of the experiment, i.e., the survival rate for that anole population. To do this, divide the mean number of lizards found alive after six (or 12) months by the mean number of lizards in the initial population (see below). A survival rate of 1 means that all individuals in the initial population survived; a rate of 0 means they all died. CONTROL ISLANDS: Survival Rate (after 6 months) = MEAN6 mo/MEANstart = ______________ Survival Rate (after 12 months) = MEAN12 mo/MEANstart = ______________ EXPERIMENTAL ISLANDS: Survival Rate (after 6 months) = MEAN6 mo/MEANstart = ______________ Survival Rate (after 12 months) = MEAN12 mo/MEANstart = ______________ 4. Are the lizards more likely to survive on the control or the experimental islands? How would you explain this difference? 0 www.BioInteractive.org Page 5 of 8 Student Handout Classroom Resource Selection by Predation 5. What additional factors could cause lizards to die, even on control islands? On your snapshot cards, you calculated the proportion of A. sagrei living primarily on the ground. Enter your answers in the table below. Table 2: Proportion of A. sagrei living primarily on the ground. PROPORTION ON GROUND CONTROL ISLANDS EXPERIMENTAL ISLANDS Island Start 6 Months 12 Months Island Start 6 Months 12 Months A E B F C G D H Mean Mean 6. Compare the means. Do you see any difference between control and experimental islands over time? Explain your answer. Although you may be able to identify some trends in the proportion of lizards on the ground by looking at your raw data, it is helpful to visualize your results by graphing the means. 7. For each island type (control and experimental), construct a line graph showing the mean proportion of anoles on the ground over time. Steps a through e will guide you through the process. a. The experiment looked at how the proportion of anoles on the ground changed over time in response to the predator. What is the independent variable, and what is the dependent variable? Independent variable: Dependent variable: b. What needs to go on the x-axis? 0 www.BioInteractive.org Page 6 of 8 Student Handout Classroom Resource Selection by Predation c. What needs to go on the y-axis? d. First, plot the means of the control islands and connect the dots with a line. Then, do the same with the experimental island means. Use two different colors for the control and experimental islands. e. Add a title for the graph and label both axes. 8. Describe any trends or patterns you see in your graph. Make sure to compare the control and experimental islands. 9. Does your data support the hypothesis you formulated on page 2? Explain your answer. 10. Looking at the data you collected in Tables 1 and 2, how would you complete the sentence below? Fill in the blanks, choosing among the following words {fewer | more | about the same number of}. Compared to the control islands, on the experimental islands _______________________ anoles from the initial population survived, and _________________________ survivors were living primarily on the ground. 0 www.BioInteractive.org Page 7 of 8 Student Handout Classroom Resource Selection by Predation PART IV: CONCLUSIONS You have just determined the survival rates of anoles on different islands and how the survivors used their habitat. Dr. Losos and colleagues also collected data on the anoles’ hind limb length. 11. Based on your findings in Part III, do you predict there to be a difference in the average hind limb length of surviving A. sagrei on experimental islands compared to control islands over the course of the experiment? List your predictions for each point in time below and explain your reasoning. (There is no right or wrong answer. Refer to what you may know about the connection between hind limb length and habitat use from the film The Origin of Species: Lizards in an Evolutionary Tree.) Start of experiment: After 6 months: After 12 months: You will now watch a video in which Dr. Losos describes what he and his colleagues found. 12. What did Dr. Losos and colleagues discover about the average hind limb length of survivors after six months and after 12 months? Remember that they looked at the survivors of only one generation of lizards. a. Were these findings different from what you expected? Explain your answer. b. How did Dr. Losos explain their findings? 13. Dr. Losos and colleagues had set out to study the effect of predation on evolution, but they were only able to take measurements for a year and in only one generation of anoles. For evolution by natural selection to occur in a particular population, there has to be variation in a trait in that population, the variation must be 0 www.BioInteractive.org Page 8 of 8 Student Handout Classroom Resource Selection by Predation heritable, and individuals who possess a particular version of the trait have to have a fitness advantage (i.e., be more likely to survive and produce more offspring) over other individuals. Consider the trait hind limb length and explain whether Dr. Losos and his colleagues were able to demonstrate each of the following claims with their predation experiment. For each claim list the evidence that supports it. If a claim is not supported by evidence, explain why not and what additional observation would be needed to support the claim. a. There was variation in the trait among individual anoles in the population. b. Variation in the trait was heritable. c. Some anoles had a fitness advantage over other anoles. d. Natural selection favored certain trait variations. e. Beneficial trait variations were passed on to future generations, and the population changed as lizards with features better adapted to living on trees evolved. 14. If Dr. Losos and his colleagues had been able to continue their experiment and measure the anoles on these islands for many years, including offspring generations, what do you predict they would have found? How would the population have changed? [Show More]
Last updated: 1 year ago
Preview 1 out of 9 pages
Reviews( 0 )
Document information
Connected school, study & course
About the document
Uploaded On
Apr 20, 2021
Number of pages
9
Written in

Additional information
This document has been written for:
Uploaded
Apr 20, 2021
Downloads
0
Views
33


.png)


.png)


.png)