Mathematics > EXAM > MATH 225N Week 8 Final Exam 2020 – Chamberlain College of Nursing (A grade) | MATH225N Week 8 Fina (All)
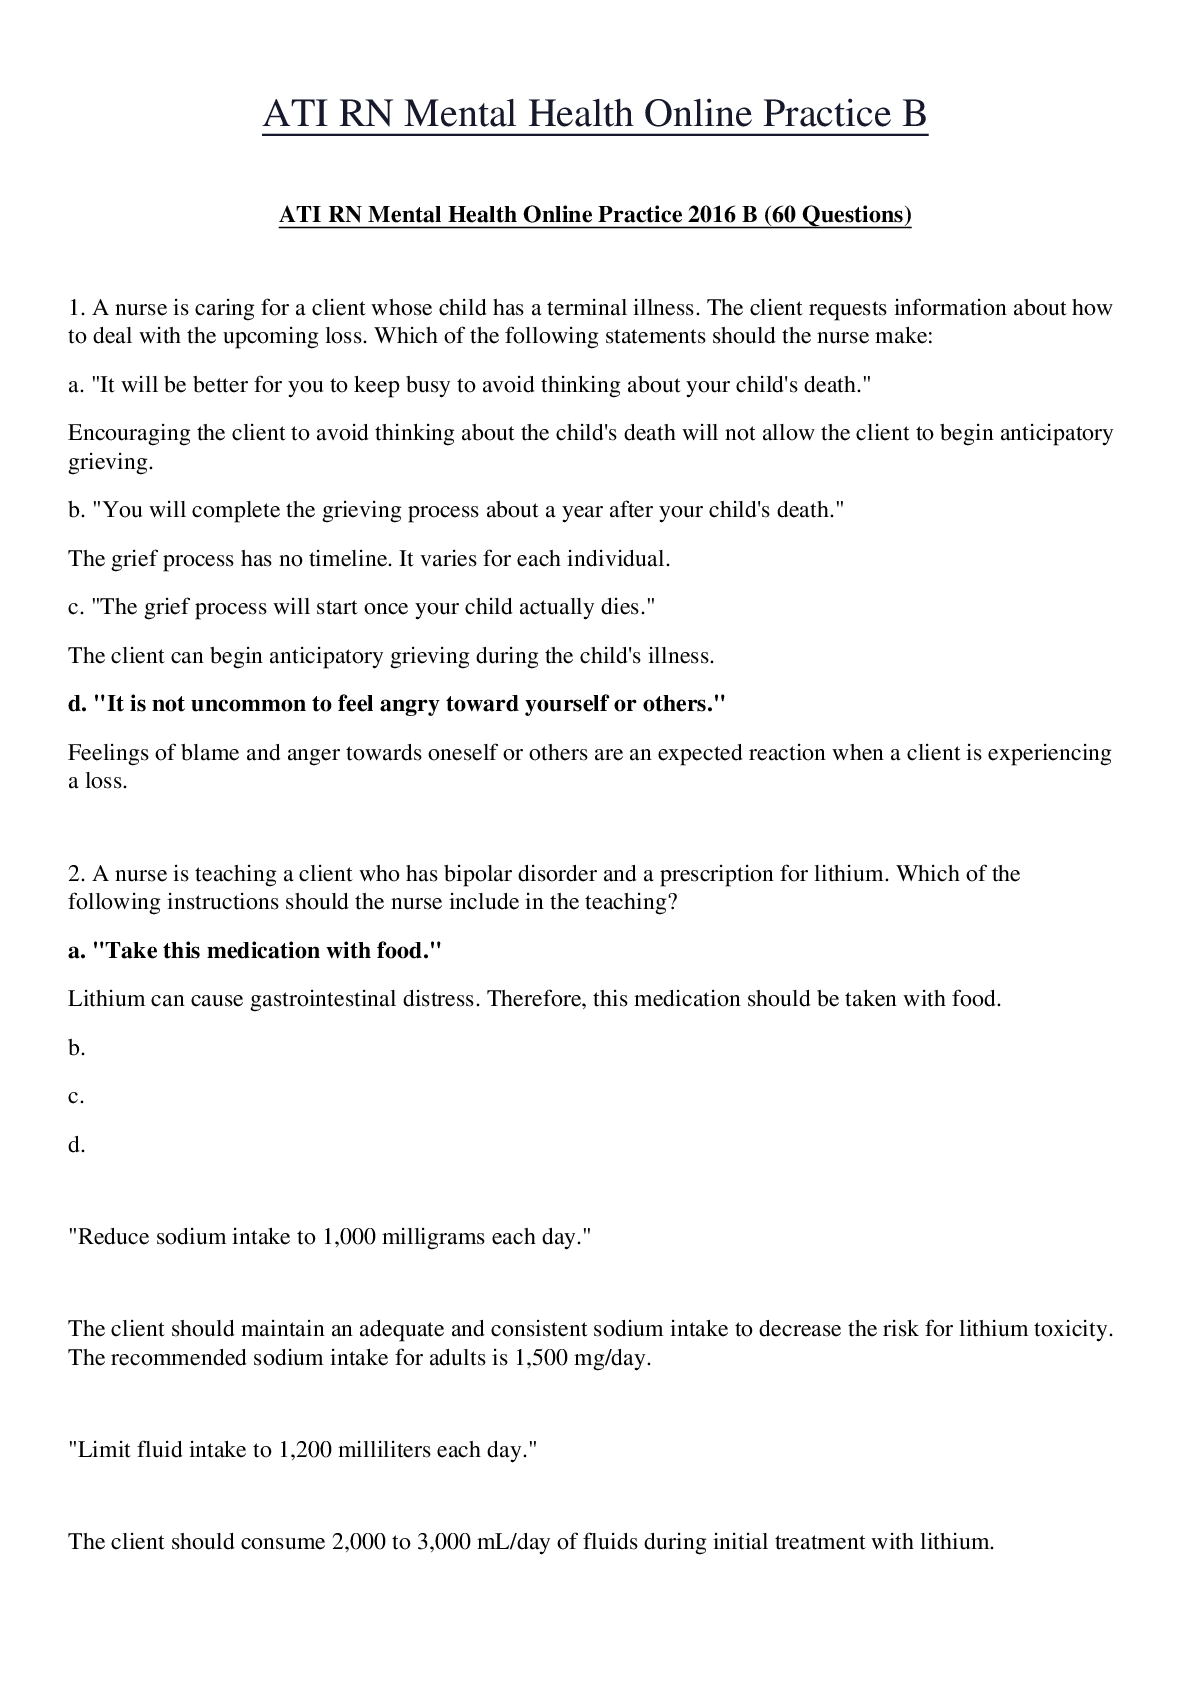
MATH 225N Week 8 Final Exam 2020 – Chamberlain College of Nursing (A grade) | MATH225N Week 8 Final Exam 2020 – A grade
Document Content and Description Below
MATH 225N Week 8 Final Exam 2020 – Chamberlain College of Nursing (A grade) 50 well-answered question Question 1 · 1/1 points A fitness center claims that the mean amount of time that a person... spends at the gym per visit is 33 minutes. Identify the null hypothesis, H0, and the alternative hypothesis, Ha, in terms of the parameter μ. That is correct! H0: μ≠33; Ha: μ=33 H0: μ=33; Ha: μ≠33 H0: μ≥33; Ha: μ<33 H0: μ≤33; Ha: μ>33 Answer Explanation Correct answer: H0: μ=33; Ha: μ≠33 Let the parameter μ be used to represent the mean. The null hypothesis is always stated with some form of equality: equal (=), greater than or equal to (≥), or less than or equal to (≤). Therefore, in this case, the null hypothesis H0 is μ=33. The alternative hypothesis is contradictory to the null hypothesis, so Ha is μ≠33. • • • • Question 2 · 1/1 points The answer choices below represent different hypothesis tests. Which of the choices are right-tailed tests? Select all correct answers. That is correct! • H0:X≥17.1, Ha:X<17.1 • • H0:X=14.4, Ha:X≠14.4 • • H0:X≤3.8, Ha:X>3.8 • • H0:X≤7.4, Ha:X>7.4 • • H0:X=3.3, Ha:X≠3.3 • Answer Explanation Correct answer: H0:X≤3.8, Ha:X>3.8 H0:X≤7.4, Ha:X>7.4 Remember the forms of the hypothesis tests. • Right-tailed: H0:X≤X0, Ha:X>X0. • Left-tailed: H0:X≥X0, Ha:X<X0. • Two-tailed: H0:X=X0, Ha:X≠X0. So in this case, the right-tailed tests are: • H0:X≤7.4, Ha:X>7.4 • H0:X≤3.8, Ha:X>3.8 • • • • Question 3 · 1/1 points Find the Type II error given that the null hypothesis, H0, is: a building inspector claims that no more than 15% of structures in the county were built without permits. That is correct! The building inspector thinks that no more than 15% of the structures in the county were built without permits when, in fact, no more than 15% of the structures really were built without permits. The building inspector thinks that more than 15% of the structures in the county were built without permits when, in fact, more than 15% of the structures really were built without permits. The building inspector thinks that more than 15% of the structures in the county were built without permits when, in fact, at most 15% of the structures were built without permits. The building inspector thinks that no more than 15% of the structures in the county were built without permits when, in fact, more than 15% of the structures were built without permits. Answer Explanation Correct answer: The building inspector thinks that no more than 15% of the structures in the county were built without permits when, in fact, more than 15% of the structures were built without permits. A Type II error is the decision not to reject the null hypothesis when, in fact, it is false. In this case, the Type II error is when the building inspector thinks that no more than 15% of the structures were built without permits when, in fact, more than 15% of the structures were built without permits. • • • • Question 4 · 1/1 points Suppose a chef claims that her meatball weight is less than 4 ounces, on average. Several of her customers do not believe her, so the chef decides to do a hypothesis test, at a 10% significance level, to persuade them. She cooks 14 meatballs. The mean weight of the sample meatballs is 3.7 ounces. The chef knows from experience that the standard deviation for her meatball weight is 0.5 ounces. • H0: μ≥4; Ha: μ<4 • α=0.1 (significance level) What is the test statistic (z-score) of this one-mean hypothesis test, rounded to two decimal places? That is correct! - - - - - - - - - - - - - - - - - - - - - - - - - - - - - - - - Question 50 · 1/1 points The following frequency table summarizes a set of data. What is the five-number summary? Value Frequency 1 6 2 2 3 1 4 1 8 1 9 1 10 1 16 6 20 3 21 1 23 1 24 1 25 1 27 1 That is correct! Min Q1 Median Q3 Max 1 2 16 20 27 Min Q1 Median Q3 Max 11 33 2020 2222 27 Min Q1 Median Q3 Max $_1$_ $_2$_ $_6$_ $_20$_ $_27$_ Min Q1 Median Q3 Max $_1$_ $_4$_ $_5$_ $_16$_ $_27$_ Min Q1 Median Q3 Max $_1$_ $_7$_ $_8$_ $_22$_ $_27$_ Answer Explanation Correct answer: Min Q1 Median Q3 Max $_1$_ $_2$_ $_16$_ $_20$_ $_27$_ We can immediately see that the minimum value is $_1$_ and the maximum value is $_27$_. If we add up the frequencies in the table, we see that there are $_27$_ total values in the data set. Therefore, the median value is the one where there are $_13$_ values below it and $_13$_ values above it. By adding up frequencies, we see that this happens at the value $_16$_, so that is the median. Now, looking at the lower half of the data, there are $_13$_ values there, and so the median value of that half of the data is $_2$_. This is the first quartile. Similarly, the third quartile is the median of the upper half of the data, which is $_20$_. $_\color{blue}{1}$_, $_1$_, $_1$_, $_1$_, $_1$_, $_1$_, $_\color{blue}{2}$_, $_2$_, $_3$_, $_4$_, $_8$_, $_9$_, $_10$_, $_\color{blue}{16}$_, $_16$_, $_16$_, $_16$_, $_16$_, $_16$_, $_20$_, $_\color{blue}{20}$_, $_20$_, $_21$_, $_23$_, $_24$_, $_25$_, $_\color{blue}{27}$_ So, the five-number summary is Min Q1 Median Q3 Max $_1$_ $_2$_ $_16$_ $_20$_ $_27$_ [Show More]
Last updated: 1 year ago
Preview 1 out of 21 pages
.png)
Buy this document to get the full access instantly
Instant Download Access after purchase
Add to cartInstant download
We Accept:

Reviews( 0 )
$15.50
Document information
Connected school, study & course
About the document
Uploaded On
Jul 01, 2020
Number of pages
21
Written in

Additional information
This document has been written for:
Uploaded
Jul 01, 2020
Downloads
0
Views
94