Mathematics > EXAM > MATH 225N Week 7 Assignment 2020 - Conduct a Hypothesis Test for Proportion- P-Value Approach | MATH (All)
MATH 225N Week 7 Assignment 2020 - Conduct a Hypothesis Test for Proportion- P-Value Approach | MATH225N Week 7 Assignment 2020 - Chamberlain College of nursing
Document Content and Description Below
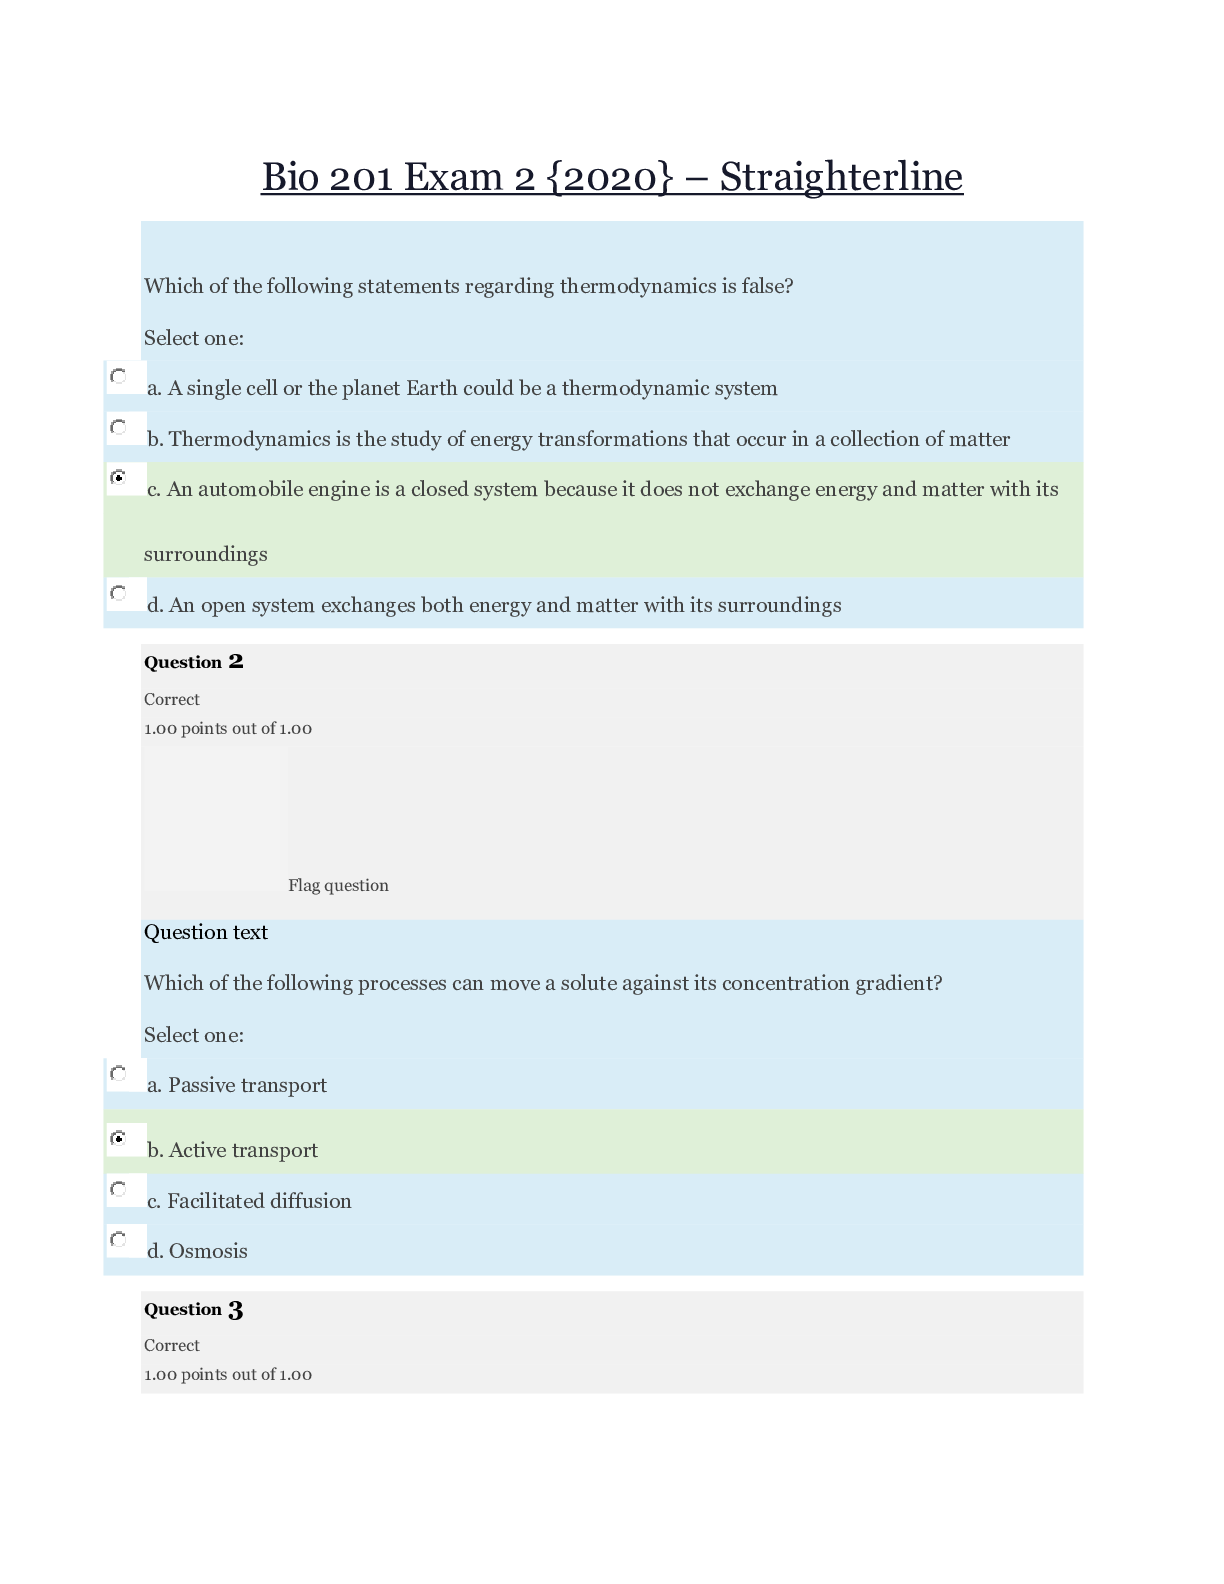
MATH 225N Week 7 Assignment 2020 - Conduct a Hypothesis Test for Proportion- P-Value Approach Determine the p-value for a hypothesis test for proportion Question A college administrator claims th... at the proportion of students that are nursing majors is greater than 40%. To test this claim, a group of 400 students are randomly selected and its determined that 190 are nursing majors. The following is the setup for this hypothesis test: H0:p=0.40 Ha:p>0.40 Find the p-value for this hypothesis test for a proportion and round your answer to 3 decimal places. The following table can be utilized which provides areas under the Standard Normal Curve: Correct answers: • P-value=0.001 Here are the steps needed to calculate the p-value for a hypothesis test for a proportion: 1. Determine if the hypothesis test is left tailed, right tailed, or two tailed. 2. Compute the value of the test statistic. 3. If the hypothesis test is left tailed, the p-value will be the area under the standard normal curve to the left of the test statistic z0 If the test is right tailed, the p-value will be the area under the standard normal curve to the right of the test statistic z0 If the test is two tailed, the p-value will be the area to the left of −|z0| plus the area to the right of |z0| under the standard normal curve For this example, the test is a right tailed test and the test statistic, rounding to two decimal places, is z=0.475−0.400.40(1−0.40)400‾‾‾‾‾‾‾‾‾‾‾‾‾‾‾√≈3.06. Thus the p-value is the area under the Standard Normal curve to the right of a z-score of 3.06. From a lookup table of the area under the Standard Normal curve, the corresponding area is then 1 - 0.999 = 0.001. z 0.00 0.01 0.02 0.03 0.04 0.05 0.06 0.07 0.08 0.09 3.0 0.999 0.999 0.999 0.999 0.999 0.999 0.999 0.999 0.999 0.999 Required p-value = 0.001 Explanation: Formula to calculate the test statistic z is z=((1−p)∗p)/np^−p where p^=x/n=190/400=0.475,p=0.40,n=400 →((1−0.4)∗0.4)/4000.475−0.4 →0.0244950.075 ⇒3.06 P(z>3.06) = 1-P(z<3.06) ⇒ 1 - 0.999 [Find 3.0 in row and 0.06 in column in above table] ⇒ 0.001 Hence, p-value is 0.001 Determine the p-value for a hypothesis test for proportion Question A police officer claims that the proportion of accidents that occur in the daytime (versus nighttime) at a certain intersection is 35%. To test this claim, a random sample of 500 accidents at this intersection was examined from police records it is determined that 156 accidents occurred in the daytime. The following is the setup for this hypothesis test: H0:p = 0.35 - - - - - - - - - - - - - - - - - - - Come to a conclusion and interpret the results for this hypothesis test for a proportion (use a significance level of 5%) Perfect. Your hard work is paying off ? Correct answer: The decision is to fail to reject the Null Hypothesis. The conclusion is that there is not enough evidence to reject the claim. To come to a conclusion and interpret the results for a hypothesis test for proportion using the P-Value Approach, the first step is to compare the p-value from the sample data with the level of significance. The decision criteria is then as follows: If the p-value is less than or equal to the given significance level, then the null hypothesis should be rejected. So, if p≤α, reject H0; otherwise fail to reject H0. When we have made a decision about the null hypothesis, it is important to write a thoughtful conclusion about the hypotheses in terms of the given problem's scenario. Assuming the claim is the null hypothesis, the conclusion is then one of the following: • if the decision is to reject the null hypothesis, then the conclusion is that there is enough evidence to reject the claim. • if the decision is to fail to reject the null hypothesis, then the conclusion is that there is not enough evidence to reject the claim. Assuming the claim is the alternative hypothesis, the conclusion is then one of the following: • if the decision is to reject the null hypothesis, then the conclusion is that there is enough evidence to support the claim. • if the decision is to fail to reject the null hypothesis, then the conclusion is that there is not enough evidence to support the claim. In this example the p-value = 0.124. We then compare the p-value to the level of significance to come to a conclusion for the hypothesis test. In this example, the p-value is greater than the level of significance which is 0.05. Since the p-value is greater than the level of significance, the conclusion is to fail to reject the null hypothesis. [Show More]
Last updated: 1 year ago
Preview 1 out of 13 pages
Buy this document to get the full access instantly
Instant Download Access after purchase
Add to cartInstant download
We Accept:

Reviews( 0 )
$11.50
Document information
Connected school, study & course
About the document
Uploaded On
Jul 01, 2020
Number of pages
13
Written in

Additional information
This document has been written for:
Uploaded
Jul 01, 2020
Downloads
1
Views
59