Computer Science > Solutions Guide > University of California, BerkeleyDATA 100hw2sol. (All)
University of California, BerkeleyDATA 100hw2sol.
Document Content and Description Below
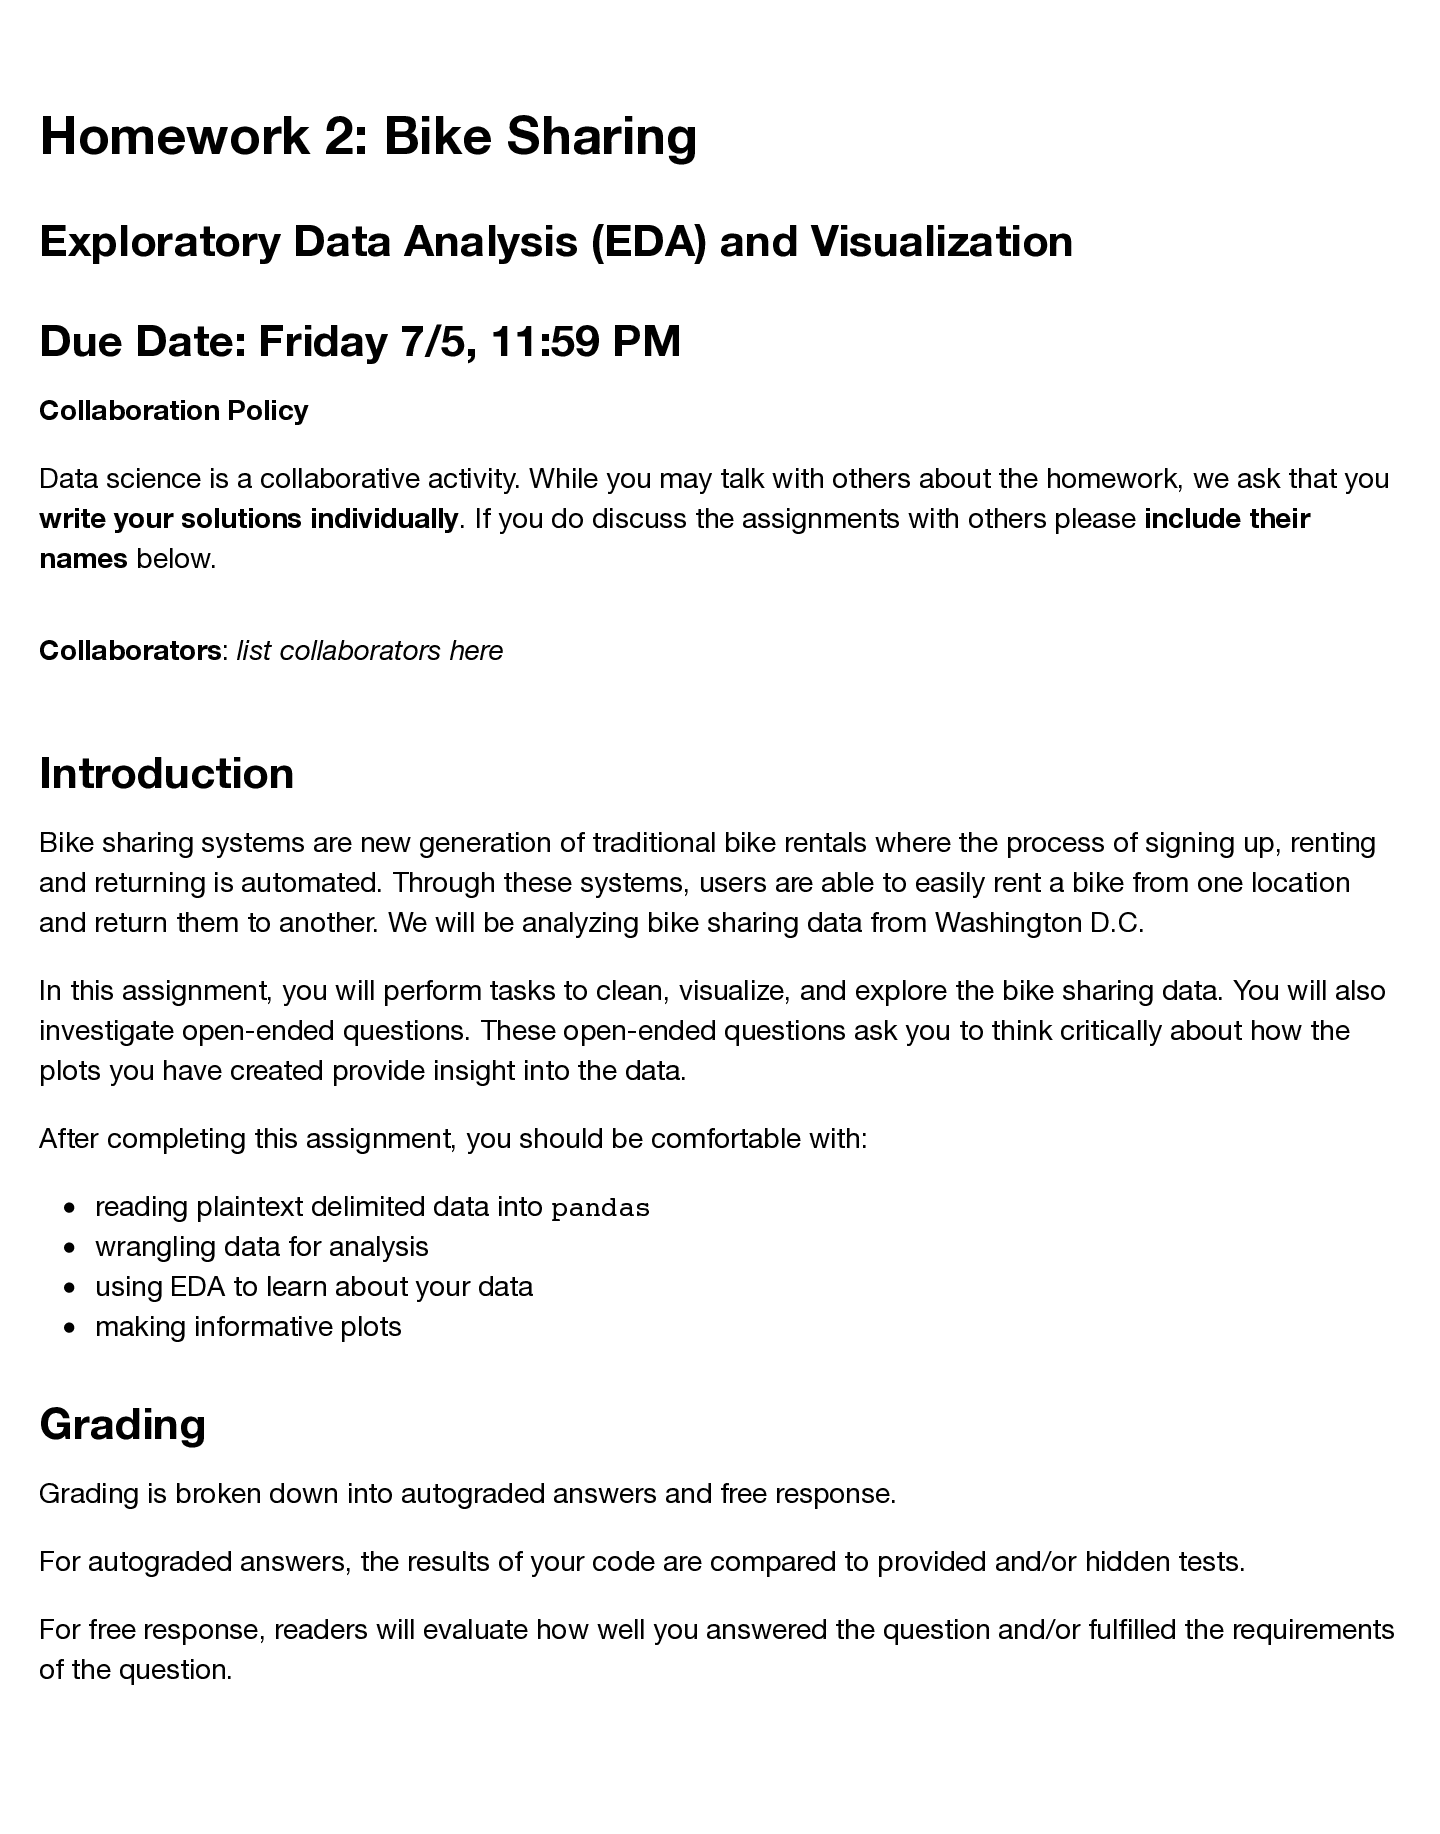
Homework 2: Bike Sharing Exploratory Data Analysis (EDA) and Visualization Due Date: Friday 7/5, 11:59 PM Collaboration Policy Data science is a collaborative activity. While you may talk with oth... ers about the homework, we ask that you write your solutions individually. If you do discuss the assignments with others please include their names below. Collaborators: list collaborators here Introduction Bike sharing systems are new generation of traditional bike rentals where the process of signing up, renting and returning is automated. Through these systems, users are able to easily rent a bike from one location and return them to another. We will be analyzing bike sharing data from Washington D.C. In this assignment, you will perform tasks to clean, visualize, and explore the bike sharing data. You will also investigate open-ended questions. These open-ended questions ask you to think critically about how the plots you have created provide insight into the data. After completing this assignment, you should be comfortable with: reading plaintext delimited data into pandas wrangling data for analysis using EDA to learn about your data making informative plots Grading Grading is broken down into autograded answers and free response. For autograded answers, the results of your code are compared to provided and/or hidden tests. For free response, readers will evaluate how well you answered the question and/or fulfilled the requirements of the question.For plots, your plots should be similar to the given examples. We will tolerate small variations such as color differences or slight variations in scale. However it is in your best interest to make the plots as similar as possible, as similarity is subject to the readers. Note that for ALL plotting questions from here on out, we will expect appropriate titles, axis labels, legends, etc. The following question serves as a good guideline on what is "enough": If I directly downloaded the plot and viewed it, would I be able to tell what was being visualized without knowing the question? Score breakdown Question Points Question 1a 2 Question 1b 1 Question 1c 2 Question 2a 2 Question 2b 2 Question 2c 1 Question 2d 1 Question 2e 2 Question 2f 2 Question 3a 5 Question 3b 3 Question 4 2 Question 5a 2 Question 5b 2 Question 6a 1 Question 6b 4 Question 6c 2 Question 6d 2 Total 38In [1]: # Run this cell to set up your notebook. Make sure ds100_utils.py is in this as signment's folder import seaborn as sns import csv import numpy as np import pandas as pd import matplotlib.pyplot as plt import zipfile from pathlib import Path import ds100_utils # Default plot configurations %matplotlib inline plt.rcParams['figure.figsize'] = (16,8) plt.rcParams['figure.dpi'] = 150 sns.set() from IPython.display import display, Latex, Markdown [Show More]
Last updated: 1 year ago
Preview 1 out of 33 pages
Reviews( 0 )
Document information
Connected school, study & course
About the document
Uploaded On
Jul 08, 2021
Number of pages
33
Written in

Additional information
This document has been written for:
Uploaded
Jul 08, 2021
Downloads
0
Views
86

 University of Cambridge Local Examinations Syndicate - Cambridge IELTS 3 Student's Book with Answers_ Examination Papers from the University of Cambridge Local Examinations Synd.png)
.png)

.png)
.png)
.png)


.png)