Business > QUESTIONS & ANSWERS > Georgia Institute Of Technology - ISYE 6501 midterm 2 solutions (All)
Georgia Institute Of Technology - ISYE 6501 midterm 2 solutions
Document Content and Description Below
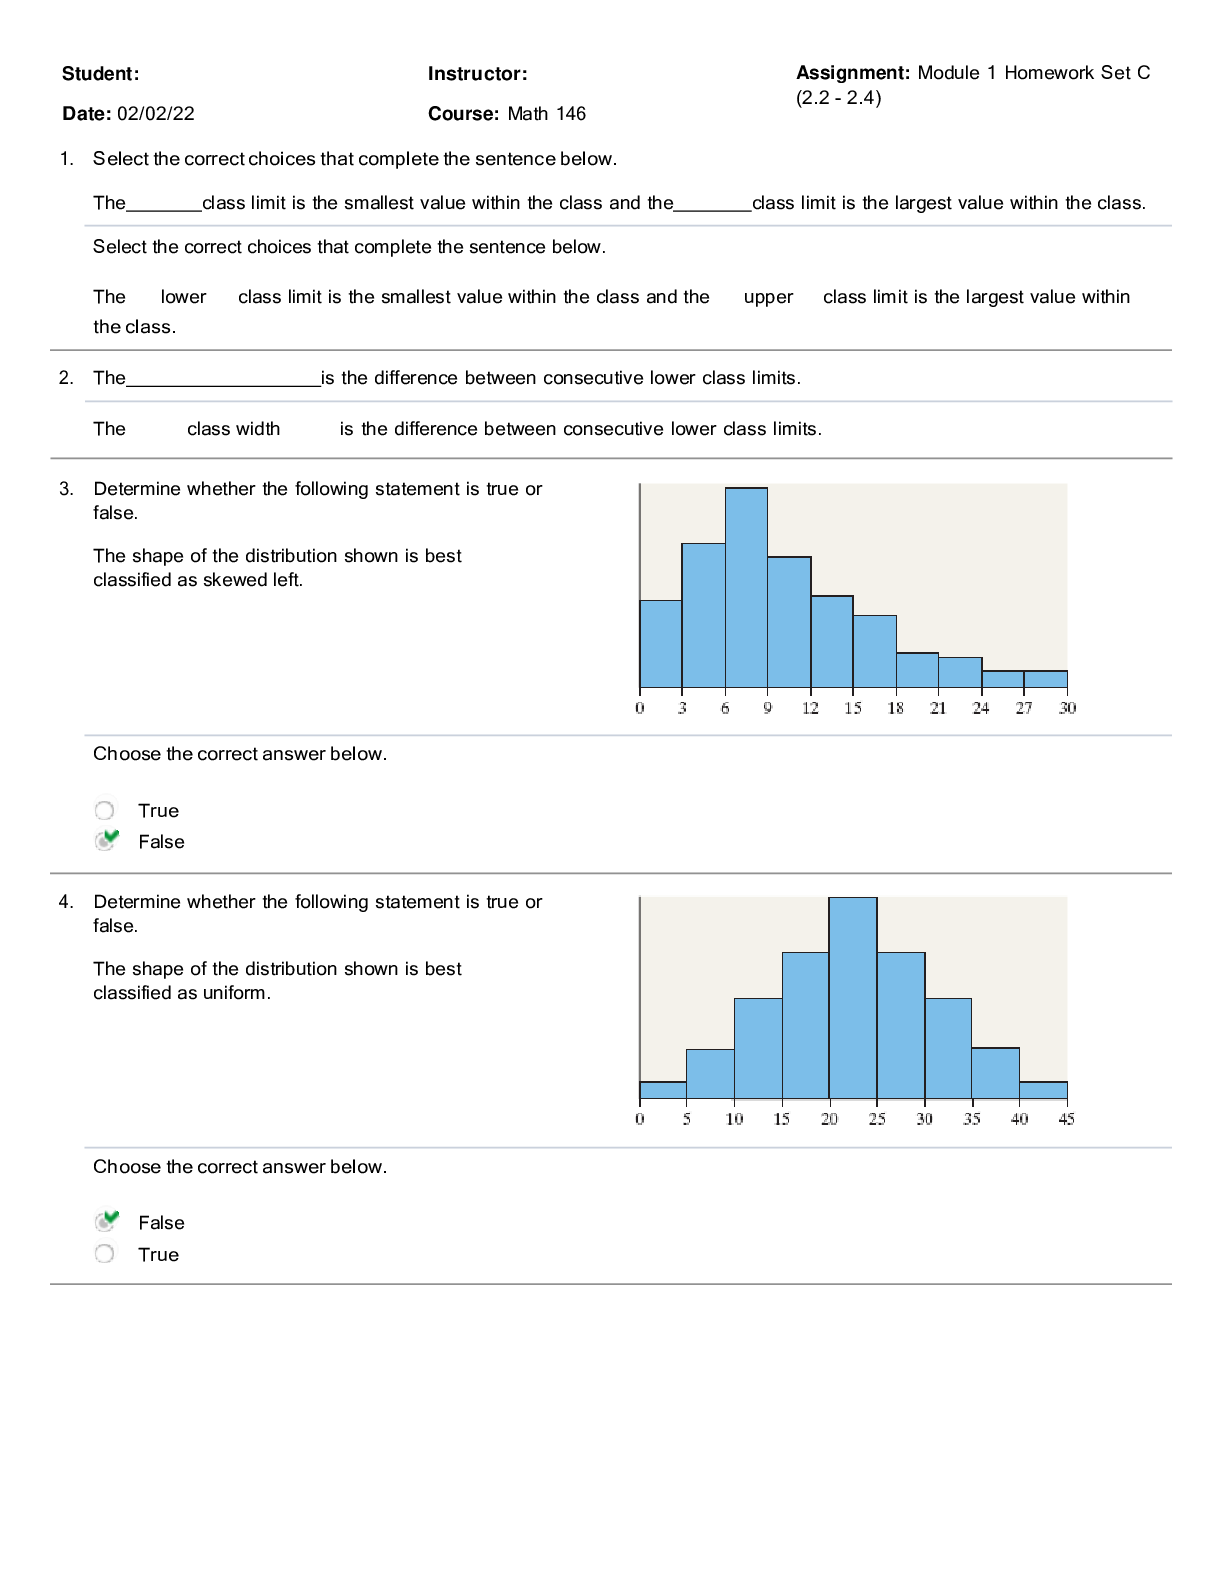
ISYE 6501x Introduction to Analytics Modeling Sample Quiz #1 Questions NOTES 1. The real quiz will have more questions, and cover more material; these questions are just meant to give you an idea ... of the question style and depth. 2. Because of the online format, I will try to make some of the answers more structured than the purely-free-answer format in two of the questions below. 3. This is being posted early, because a bunch of you asked for it. Some of the topics covered below are things you’ll see in the weeks between now and when you take the quiz, so if they don’t look familiar yet, don’t worry!NAME____________________________ ISYE 6501x, Introduction to Analytics Modeling Quiz #1 – 90 minute time limit INSTRUCTIONS • Work alone. Do not collaborate with or copy from anyone else. • You may use any of the following resources: o One sheet (both sides) of handwritten (not photocopied or scanned) notes • If any question seems ambiguous, use the most reasonable interpretation (i.e., don’t be like Calvin). • Good luck!1. Figure A below shows a linear classifier (dashed line) for a classification problem, using two predictors (???? and ????) to separate between black and white points. Figure B shows a CART (classification tree) approach to the same problem. Figure A Figure B In each leaf, “a out of b” means that there are b data points in the leaf, and a of them are classified correctly using the leaf’s answer. a. In Figure A, which predictor (???? or ????) is not important for separating between the black and white points in this model? (CORRECT ANSWER: ????. The classifier is a vertical line, so all that matters is whether x1 is larger or smaller than 3.5.) b. In Figure B, both ???? and ???? are used to classify the points (even though one was unimportant in Figure A). Which classification model do you think is better (Figure A or Figure B), and why? CHOICES i. Figure A, because Figure B overfits the lower-rightmost leaf. ii. Figure B, because it misclassifies 11 points, and Figure A misclassifies 12 points. i. Figure B, because it uses both predictors for classification. ii. Figure A, because it is a simpler model. (CORRECT ANSWER: i. The lower-rightmost leaf has just one data point in it, a clear example of overfitting. Although ii is a true answer, it is not correct: B is not a better model even though it misclassifies one fewer point, because the apparent better fit is due to overfitting. iv might be a reasonable answer in general, but in this case the overfitting of B overrides having or not having a slightly simpler model. NOTE: As we saw in the lessons, as a rule of thumb each leaf should have at least 5% of the data points, and a common rule of thumb for a factor-based model is to have at least 10 times as many data points as factors selected.)2. A geologist would like to build a model to predict the probability that a volcano will erupt in a given week. The geologist has previous eruption data, as well as several factors that can be used as predictors. a. Which of the following models would be most appropriate for the geologist to use to predict the probability of an eruption? CHOICES a. ARIMA g. k-means clustering b. CART h. k-nearest-neighbor classification c. Cross-validation i. Linear regression d. CUSUM j. Logistic regression e. [Show More]
Last updated: 1 year ago
Preview 1 out of 8 pages

Reviews( 0 )
Document information
Connected school, study & course
About the document
Uploaded On
Jul 12, 2021
Number of pages
8
Written in

Additional information
This document has been written for:
Uploaded
Jul 12, 2021
Downloads
0
Views
30


.png)

.png)


.png)