Environmental Science > QUESTIONS & ANSWERS > ENV 101 Introduction to Environmental Science Study Guide for Exam 3: Chapters 7, 8, 9, 10 (ASSURED (All)
ENV 101 Introduction to Environmental Science Study Guide for Exam 3: Chapters 7, 8, 9, 10 (ASSURED A)
Document Content and Description Below
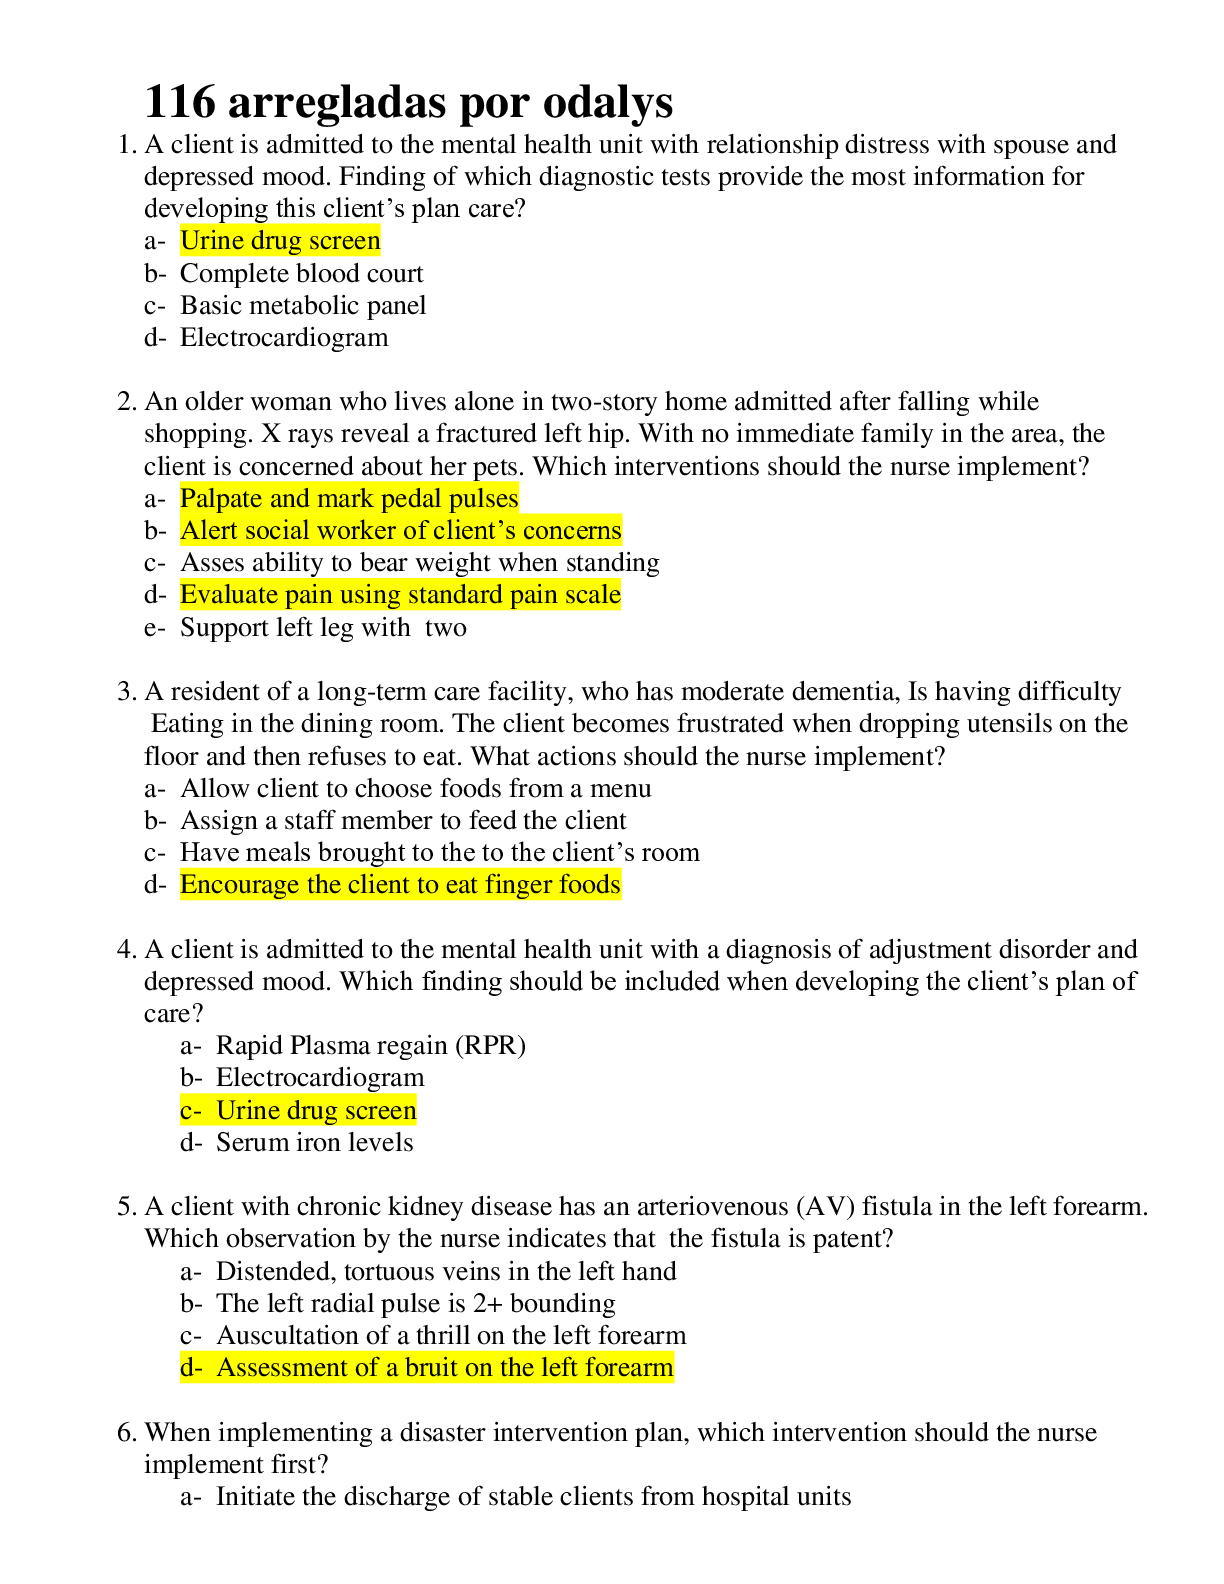
ENV 101 Introduction to Environmental Science Study Guide for Exam 3: Chapters 7, 8, 9, 10 (ASSURED A) Chapter 07 Human Populations 1. Historically, up until the middle ages, populations were mostly... limited by A. Low fertility rates B. Culturally imposed family planning practices C. Disease, famine and war D. Religious restrictions on marriage E. Infanticide 2. ____________ are the most numerous vertebrate organisms on Earth. A. Fish B. Insects C. Rodents D. Birds E. Humans 3. Human population growth most closely resembles A. Carrying capacity geometric increase B. Irruptive growth C. Malthusian growth D. S-shaped growth curve E. J-shaped growth curve 4. The world human population reached 1 billion in about _________ and passed ____________ in 1999. A. 1400; 78 billion B. 1500; 6 trillion C. 1600; 78 million D. 1700; 6 million E. 1800; 6 billion 5. The population theory held by Thomas Malthus was that the human population would A. Never reach its environment's carrying capacity B. Develop a modern utopia C. Reach its environment's carrying capacity and then maintain equilibrium D. Maintain equilibrium with its carrying capacity E. Outstrip its resources, then suffer starvation and misery 6. Neo-Malthusians argue that A. Malthus's eighteenth century theories apply to similar circumstances today B. We should never return to the conditions observed by Malthus in his day C. Malthus could be useful today if reinterpreted D. Malthus was wrong from the start E. None of these represent the viewpoint of Neo-Malthusians2 7. Technological optimists argue that technological advances have A. Led to the increase in human population but whether we can continue is of great concern B. Proved Marx wrong in his predictions of famine and disaster C. Proved Malthus wrong in his predictions of famine and disaster D. Been developed because there are more people, supporting the view that more people are the "ultimate resource." E. Been a neutral factor in the issue of population growth 8. Malthus and Marx A. Worked together to form their theories B. Agreed about the root causes of overpopulation, poverty and social upheaval C. Disagreed about the root causes of overpopulation, poverty and social upheaval D. Held the same beliefs but worked on different issues E. Disagreed about the severity of overpopulation, poverty and social upheaval 9. Human ingenuity and intelligence as the "ultimate resource" is the central theme in the argument of A. Julian Simon B. John Muir C. Thomas Malthus D. Neo-Malthusians E. Marxism 10. Demography is the science that describes A. The earth's carrying capacity B. Population changes and characteristics C. Energy resources D. Food production E. Environmental factors that affects population sizes 11. Ninety percent of the world's population growth in the next century is expected to occur in A. Less-developed countries B. China C. Developed countries D. Moderately developed nations E. India 12. Why is Russia's population declining? A. There is a one-child policy similar to the one in China and Thailand B. There has been a massive education campaign to reduce births C. The standard of living has decreased leading to lower infant mortality and lower birth rates D. Russia's population is not declining E. The standard of living has decreased leading to higher death rates and lower birth rates 13. The I = PAT formula says that our environmental impacts (I) are the product of A. The population size times affluence and the amount of time it took for the population to reach B. its current size C. The population size times affluence and the technology used to produce goods and services consumed D. The population size times the amount of technology used E. The percentage of affluence times the percentage of technology produced F. None of the above is correct3 14. Crude birth rates are measured in terms of the number of children born A. In a single year B. Per family C. Per family per year D. Per 1000 people each year E. Per 1000 people in the general population 15. The total fertility rate is the number of children born A. To the average woman per year B. To the average woman during her lifetime C. In the world during a single year D. In a population during a single year E. In a population during an entire generation [Show More]
Last updated: 1 year ago
Preview 1 out of 14 pages
Instant download
.png)
Instant download
Reviews( 0 )
Document information
Connected school, study & course
About the document
Uploaded On
Jul 23, 2021
Number of pages
14
Written in

Additional information
This document has been written for:
Uploaded
Jul 23, 2021
Downloads
0
Views
45