Mathematics > QUESTIONS & ANSWERS > MATH 225N Construct Hypothesis Test for Proportions 2021_Already Graded A. (All)
MATH 225N Construct Hypothesis Test for Proportions 2021_Already Graded A.
Document Content and Description Below
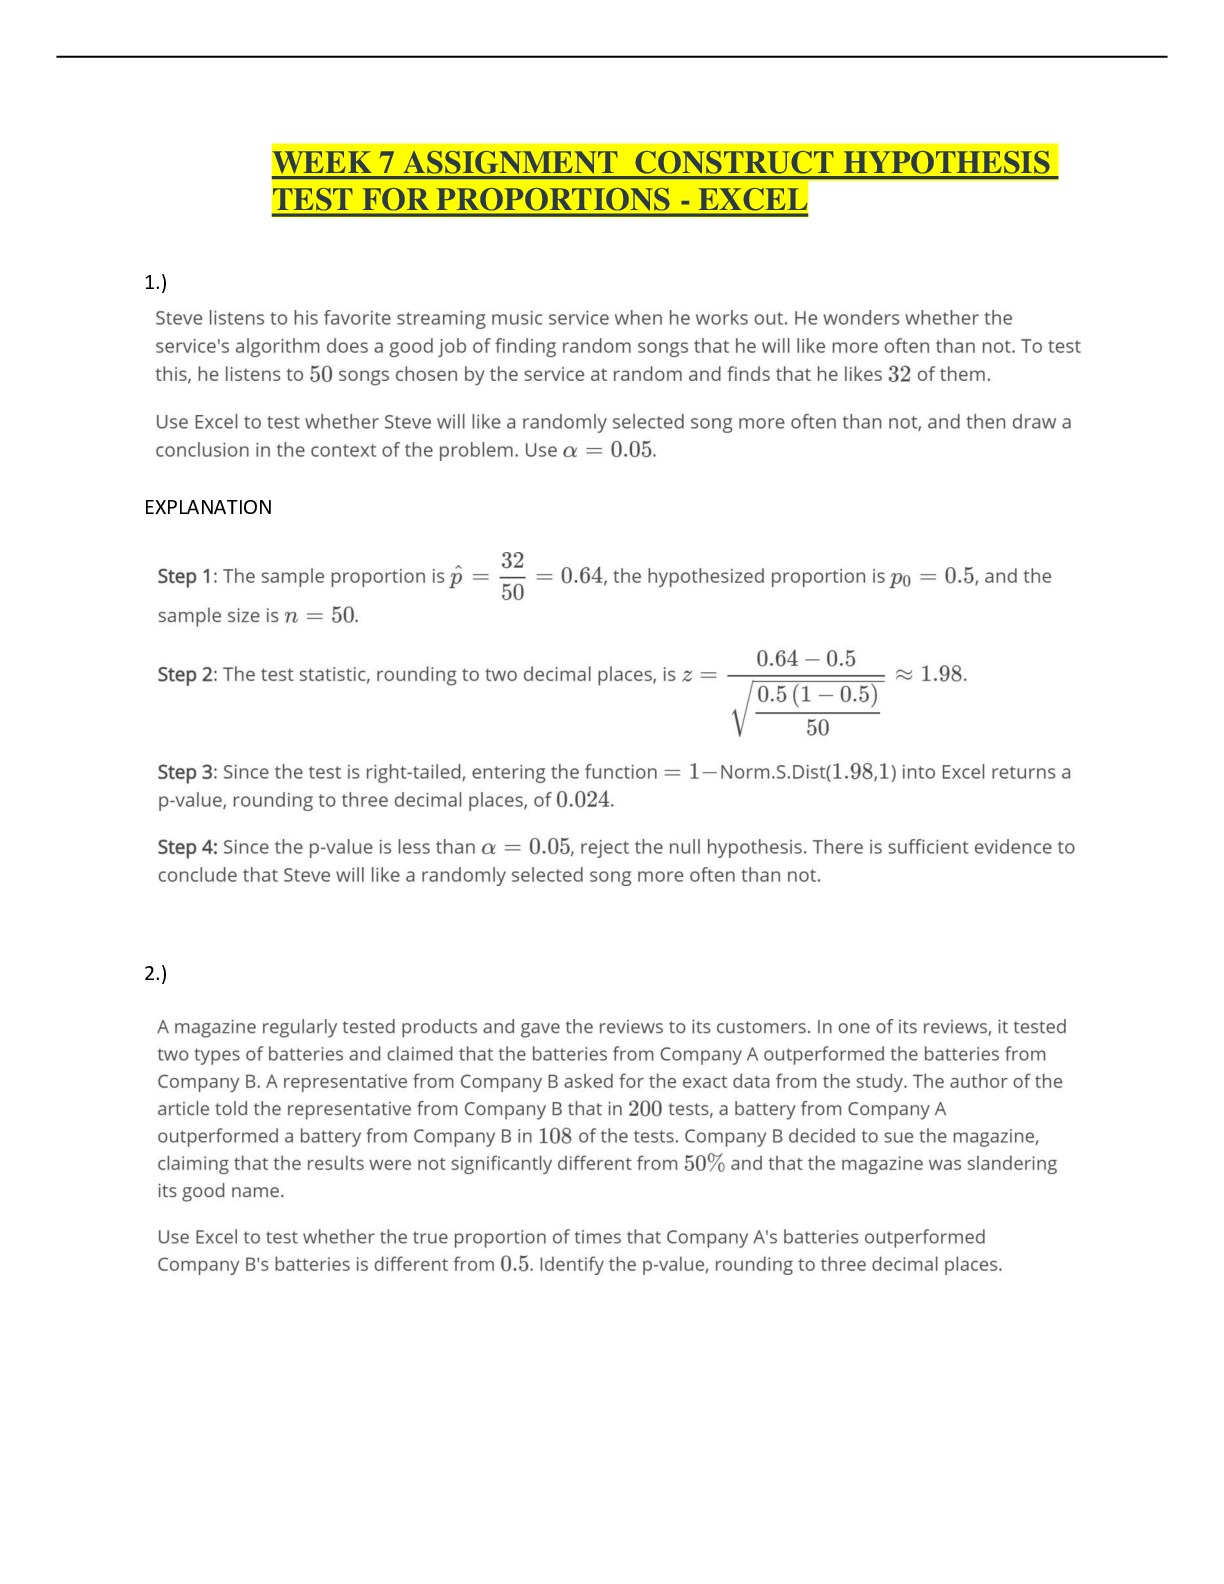
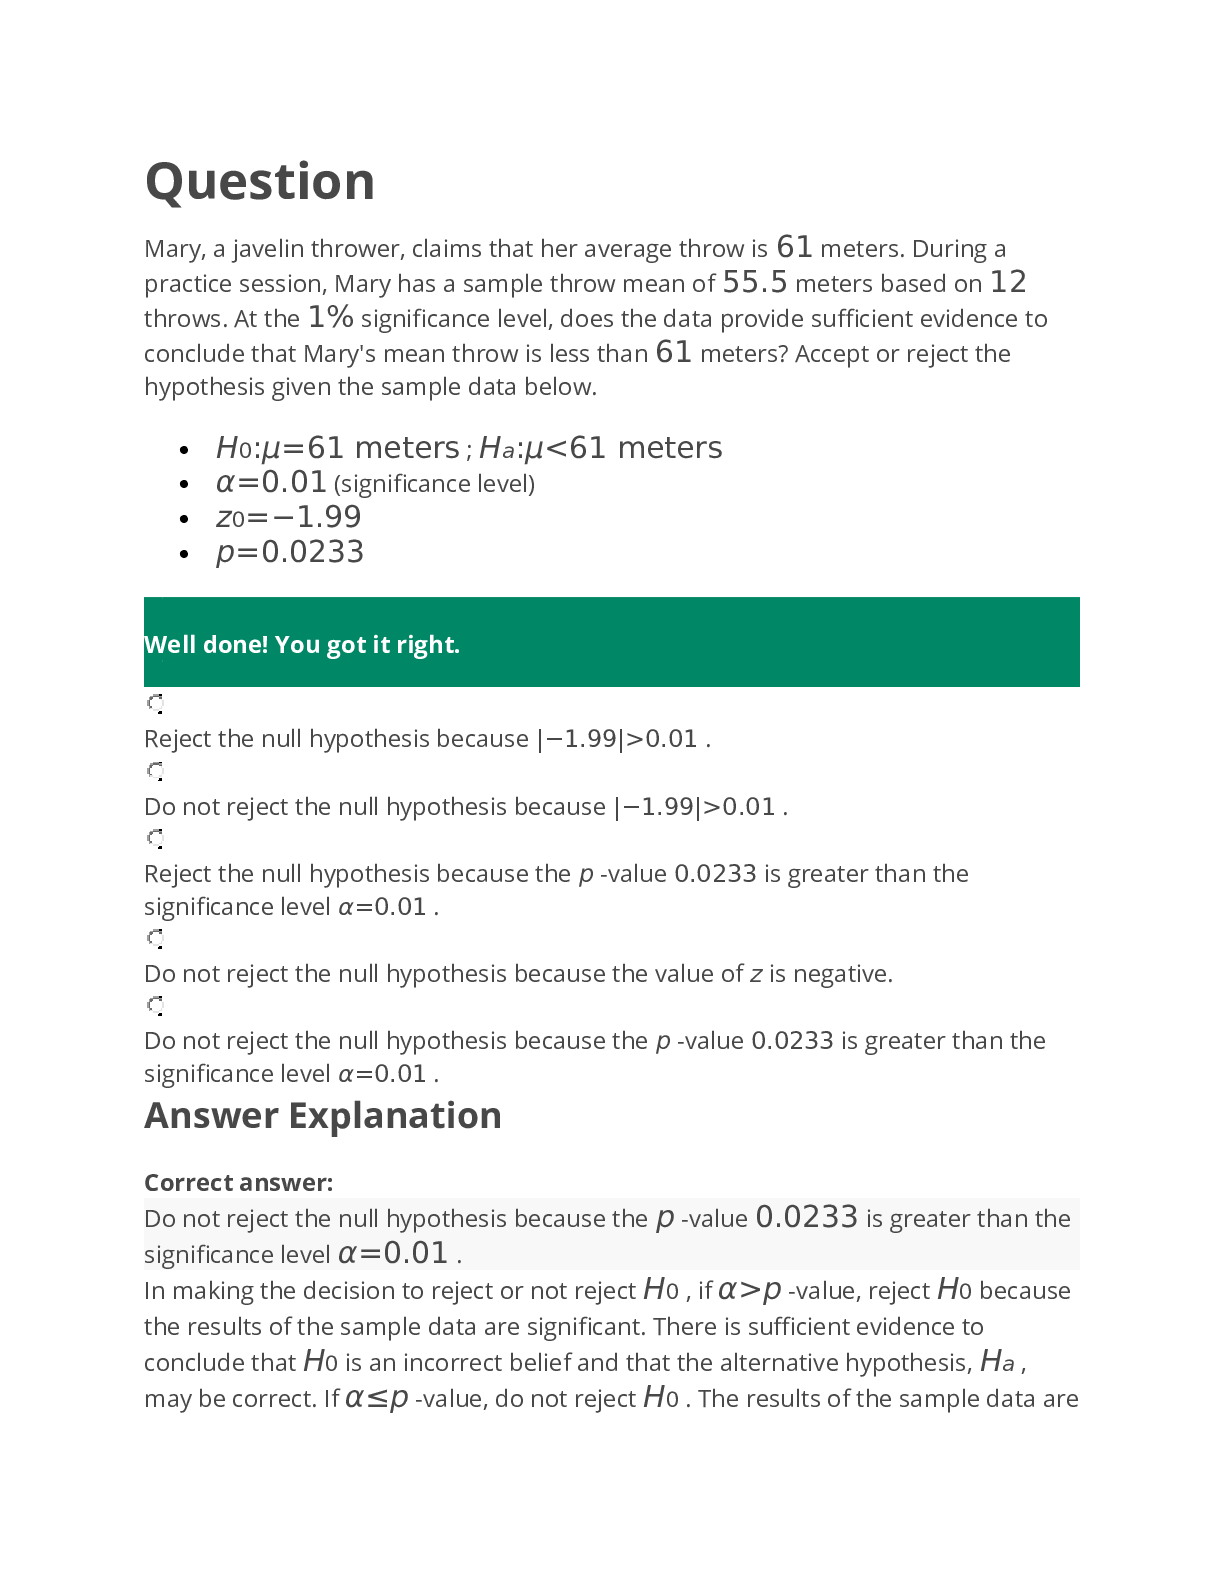
Question Mary, a javelin thrower, claims that her average throw is 61 meters. During a practice session, Mary has a sample throw mean of 55.5 meters based on 12 throws. At the 1% significance level... , does the data provide sufficient evidence to conclude that Mary's mean throw is less than 61 meters? Accept or reject the hypothesis given the sample data below. H0:μ=61 meters ; Ha:μ<61 meters α=0.01 (significance level) z0=−1.99 p=0.0233 Well done! You got it right. Reject the null hypothesis because |−1.99|>0.01 . Do not reject the null hypothesis because |−1.99|>0.01 . Reject the null hypothesis because the p -value 0.0233 is greater than the significance level α=0.01 . Do not reject the null hypothesis because the value of z is negative. Do not reject the null hypothesis because the p -value 0.0233 is greater than the significance level α=0.01 . Answer Explanation Correct answer: Do not reject the null hypothesis because the p -value 0.0233 is greater than the significance level α=0.01 . In making the decision to reject or not reject H0 , if α>p -value, reject H0 because the results of the sample data are significant. There is sufficient evidence to conclude that H0 is an incorrect belief and that the alternative hypothesis, Ha , may be correct. If α≤p -value, do not reject H0 . The results of the sample data arenot significant, so there is not sufficient evidence to conclude that the alternative hypothesis, Ha , may be correct. In this case, α=0.01 is less than or equal to p=0.0233 , so the decision is to not reject the null hypoth Question What is the p -value of a two-tailed one-mean hypothesis test, with a test statistic of z0=−1.73 ? (Do not round your answer; compute your answer using a value from the table below.) z−1.8−1.7−1.6−1.5−1.40.000.0360.0450.0550.0670.0810 .010.0350.0440.0540.0660.0790.020.0340.0430.0530.0640. 0780.030.0340.0420.0520.0630.0760.040.0330.0410.0510. 0620.0750.050.0320.0400.0490.0610.0740.060.0310.0390. 0480.0590.0720.070.0310.0380.0470.0580.0710.080.0300. 0380.0460.0570.0690.090.0290.0370.0460.0560.068 Well done! You got it right. 0 point 0 8 4$$0.0840 point 0 8 4 - correct Correct answers: Answer Explanation $$no response given Correct answers: 00 point 0 8 4$0.084$0.084 The p -value is the probability of an observed value of z=1.73 or greater in magnitude if the null hypothesis is true, because this hypothesis test is two-tailed. This means that the p -value could be less than z=−1.73 , or greater than z=1.73 . This probability is equal to the area under the Standard Normal curve that lies either to the left of z=−1.73 , or to the right of z=1.73 .A normal curve is over a horizontal axis and is centered on 0. Two points are labeled negative 1.73 and 1.72 The area to the right of 1.73 and to the left of negative 1.73 is shaded. Using the Standard Normal Table given, we can see that the p -value that corresponds with z=−1.73 is 0.042 , which is just the area to the left of z=−1.73 . Since the Standard Normal curve is symmetric, the area to the right of z=1.73 is 0.042 as well. So, the p -value of this two-tailed one-mean hypothesis test is (2)(0.042)=0.084 . Question What is the p -value of a two-tailed one-mean hypothesis test, with a test statistic of z0=0.27 ? (Do not round your answer; compute your answer using a value from the table below.) z0.10.20.30.40.50.000.5400.5790.6180.6550.6910.010.54 40.5830.6220.6590.6950.020.5480.5870.6260.6630.6980.0 30.5520.5910.6290.6660.7020.040.5560.5950.6330.6700.70 50.050.5600.5990.6370.6740.7090.060.5640.6030.6410.67 70.7120.070.5670.6060.6440.6810.7160.080.5710.6100.64 80.6840.7190.090.5750.6140.6520.6880.722Well done! You got it right. 0 point 7 8 8$$0.7880 point 7 8 8 - correct Correct answers: Answer Explanation $$no response given Correct answers: 00 point 7 8 8$0.788$0.788 The p -value is the probability of an observed value of z=0.27 or greater in magnitude if the null hypothesis is true, because this hypothesis test is two-tailed. This means that the p -value could be less than z=−0.27 , or greater than z=0.27 . This probability is equal to the area under the Standard Normal curve that lies either to the left of z=−0.27 , or to the right of z=0.27 . A standard normal curve with three points labeled on the horizontal axis labeled z. The mean is labeled at 0 and observed values of negative 0.27 and 0.27 are labeled. The areas under the curve and to the left of negative 0.27 and to the right of 0.27 are shaded. The shaded areas are both labeled p-value. Using the Standard Normal Table, we can see that the p -value that corresponds with z=0.27 is 0.606 , which is the area to the left of z=0.27 . However, wewant the area to the right of 0.27 , which is 1−0.606=0.394 . Because the Standard Normal curve is symmetric, the area to the left of z=−0.27 is 0.394 as well. So, the p -value of this two-tailed one-mean hypothesis test is (2) (0.394)=0.788 . Something's not right... There is an error in the instruction or question. This looks broken... A graph/image/equation/video isn't working I cannot enter my answer. A problem is preventing me from entering an answer to this question. I have an idea! I have some feedback/suggestions. Question Marty, a typist, claims that his average typing speed is 72 words per minute. During a practice session, Marty has a sample typing speed mean of 84 words per minute based on 12 trials. At the 5% significance level, does the data provide sufficient evidence to conclude that his mean typing speed is greater than 72 words per minute? Accept or reject the hypothesis given the sample data below. H0:μ≤72 words per minute ; Ha:μ>72 words per minute α=0.05 (significance level) z0=2.1 p=0.018 Great work! That's correct. Do not reject the null hypothesis because 2.1>0.05 .Do not reject the null hypothesis because the value of z is positive. Reject the null hypothesis because 2.75>0.05 . Reject the null hypothesis because the p -value 0.018 is less than the significance level α=0.05 . Do not reject the null hypothesis because the p -value 0.018 is less than the significance level α=0.05 . Answer Explanation Correct answer: Reject the null hypothesis because the p -value 0.018 is less than the significance level α=0.05 . In making the decision to reject or not reject H0 , if α>p -value, reject H0 because the results of the sample data are significant. There is sufficient evidence to conclude that H0 is an incorrect belief and that the alternative hypothesis, Ha , may be correct. If α≤p -value, do not reject H0 . The results of the sample data are not significant, so there is not sufficient evidence to conclude that the alternative hypothesis, Ha , may be correct. In this case, p=0.018 is less than the significance level α=0.05 , so the decision is to reject the null hypothesis. Something's not right... There is an error in the instruction or question. This looks broken... A graph/image/equation/video isn't working I cannot enter my answer. A problem is preventing me from entering an answer to this question. I have an idea! I have some feedback/suggestions.Question Kurtis is a statistician who claims that the average salary of an employee in the city of Yarmouth is no more than $55,000 per year. Gina, his colleague, believes this to be incorrect, so she randomly selects 61 employees who work in Yarmouth and record their annual salary. Gina calculates the sample mean income to be $56,500 per year with a sample standard deviation of 3,750 . Using the alternative hypothesis Ha:μ>55,000 , find the test statistic t and the p-value for the appropriate hypothesis test. Round the test statistic to two decimal places and the p-value to three decimal places. Right-Tailed T-Table probability 0.0004 0.0014 0.0024 0.0034 0.0044 0.0054 0.0064 Degrees of Freedom 54 3.562 3.135 2.943 2.816 2.719 2.641 2.576 55 3.558 3.132 2.941 2.814 2.717 2.640 2.574 56 3.554 3.130 2.939 2.812 2.716 2.638 2.572 57 3.550 3.127 2.937 2.810 2.714 2.636 2.571 58 3.547 3.125 2.935 2.808 2.712 2.635 2.569 59 3.544 3.122 2.933 2.806 2.711 2.633 2.568 60 3.540 3.120 2.931 2.805 2.709 2.632 2.567 Great work! That's correct. t is equal to 3 point 1 2 comma p-value is equal to 0 point 0 0 1$$t=3.12, pvalue=0.001t is equal to 3 point 1 2 comma p-value is equal to 0 point 0 0 1 - correct Correct answers: Answer Explanationt is equal to blank comma p-value is equal to$$t= , pvalue= t is equal to blank comma p-value is equal to - no response given Correct answers: 0t is equal to 3 point 1 2 comma p-value is equal to 0 point 0 0 1$t=3.12,\ \text{p-value}=0.001$t=3.12, p-value=0.001 Since σ is unknown and the sample size is at least 30 , the hypothesis test for the mean can be performed using the t -distribution. Here, the sample mean x¯¯¯ is 56,500 , the hypothesized mean μ is 55,000 , the sample standard deviation s is 3,750 , and the sample size n is 61 . Substitute these values into the formula to calculate the t test statistic. tt=56,500−55,0003,750/61−−√≈3.12 Now find the p-value. Notice that the test statistic has 61−1=60 degrees of freedom and that this is a right-tailed test because the alternative hypothesis is Ha:μ>55,000 . Find the p-value for a right-tailed test of a t -distribution with 60 degrees of freedom, where t≈3.12 . That is, to find the p-value, find the area under the t -distribution curve with 60 degrees of freedom to the right of t≈3.12 . The p-value that corresponds to these conditions is approximately 0.001 . Question What is the p -value of a two-tailed one-mean hypothesis test, with a test statistic of z0=−1.59 ? (Do not round your answer; compute your answer using a value from the table below.) z−1.8−1.7−1.6−1.5−1.40.000.0360.0450.0550.0670.0810 .010.0350.0440.0540.0 [Show More]
Last updated: 1 year ago
Preview 1 out of 39 pages
Instant download
Buy this document to get the full access instantly
Instant Download Access after purchase
Add to cartInstant download
Also available in bundle (1)
MATH 225N Week 1, week 2, week 3, week 4, week 5, week 6, week 8 Assignments & Quizes| Latest Edition 2021
MATH 225N Week 1, week 2, week 3, week 4, week 5, week 6, week 8 Assignments & Quizes| Latest Edition 2021
By d.occ 2 years ago
$45
18
Reviews( 0 )
Document information
Connected school, study & course
About the document
Uploaded On
Jul 29, 2021
Number of pages
39
Written in

Additional information
This document has been written for:
Uploaded
Jul 29, 2021
Downloads
0
Views
55
.png)

.png)