Management > EXAM > Summer MGT 6203 FINAL EXAM 2021-ALL ANSWERS CORRECT-GRADED A+ (All)
Summer MGT 6203 FINAL EXAM 2021-ALL ANSWERS CORRECT-GRADED A+
Document Content and Description Below
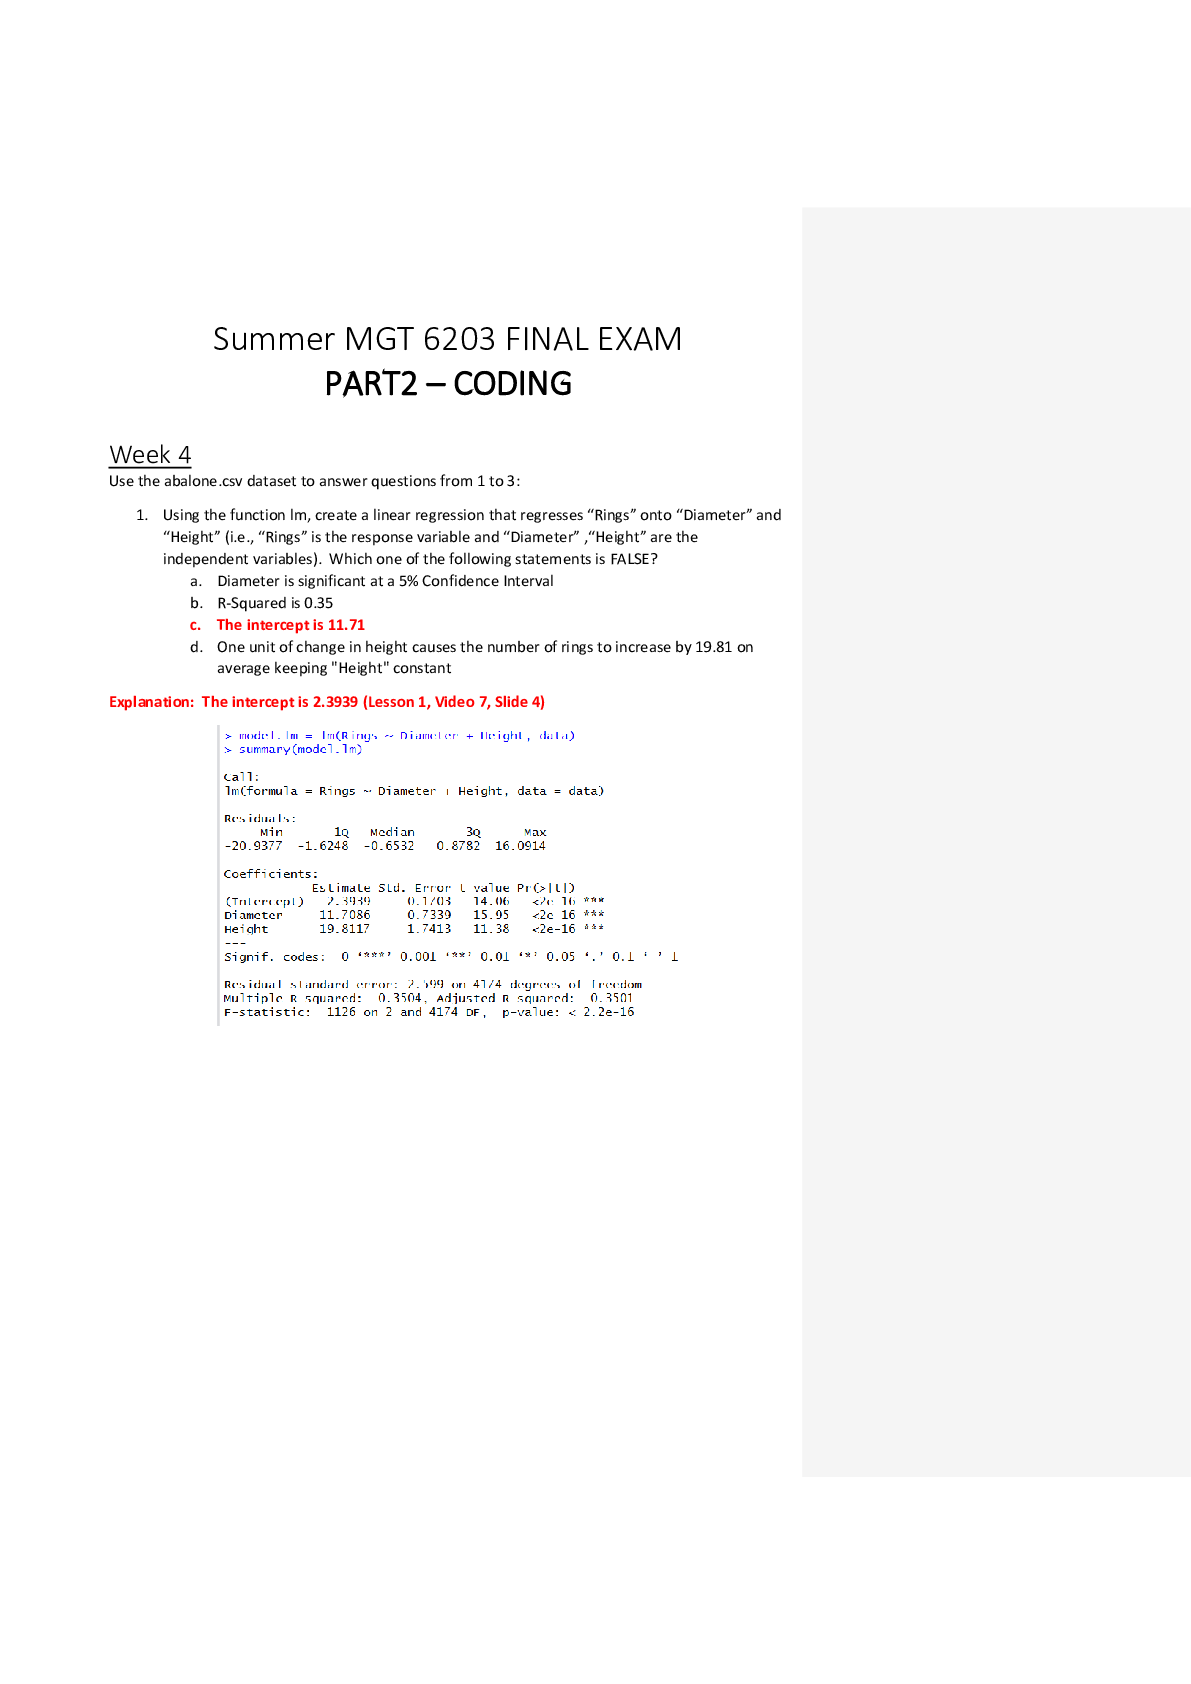
Summer MGT 6203 FINAL EXAM PART2 – CODING Week 4 Use the abalone.csv dataset to answer questions from 1 to 3: 1. Using the function lm, create a linear regression that regresses “Rings” onto... “Diameter” and “Height” (i.e., “Rings” is the response variable and “Diameter” ,“Height” are the independent variables). Which one of the following statements is FALSE? a. Diameter is significant at a 5% Confidence Interval b. R-Squared is 0.35 c. The intercept is 11.71 d. One unit of change in height causes the number of rings to increase by 19.81 on average keeping "Height" constant Explanation: The intercept is 2.3939 (Lesson 1, Video 7, Slide 4)2. Using the function lm, create a linear regression that regresses “Rings” onto all the features except “Type”. From this new model, which three features have the highest VIF score? a. LongetstShell, WholeWeight, Diameter b. Height, Diameter, ShellWeight c. ShellWeight, ShuckedWeight, VisceraWeight d. VisceraWeight, Height, LongestShell Explanation: See code below (Lesson 1 / Video 8/ Slides 12 - 15) 3. Create two separate datasets from abalone.csv. The first data set will contain Male (M) abalones and infant (I) abalones. The second dataset will contain Female (F) abalones and infant (I) abalones. Now use a linear regression model to compute the difference estimator (average difference in diameter) for each dataset (taking infant as the reference in each case). a. 0.125, 0.118 b. 0.113, 0.128 c. 0.128, 0.113 d. 0.118, 0.125 Explanation: The b1 coefficient for each model is 0.113 and 0.128 respectively. See summaries below (Lesson 5/ Video 3 / Slide 4 and Lesson 5/ Video 4/1-10) Commented [JD1]: 3 and 4 are the same. So need to omit one of them Commented [HW2R1]: DoneUse the Admissions.csv dataset to answer Q4-5 Fit a logistic regression model using Admitted as the response variable and all the other variables as independent variables. Once the model is done, predict the probabilities of getting admitted for all the datapoints. Using a threshold of 0.75 identify the students as admitted using predicted probabilities (i.e., if probability > 0.75 identify the student as admitted). 4. What is the Accuracy of the logistic regression model? a. 0.84 b. 0.88 c. 0.76 d. None of the aboveExplanation: Lesson 3 / Video 6 / Slides 3 – 8 5. What is the AUC of ROC curve of our predicted admissions and true admissions? a. 0.867 b. 0.824 c. 0.782 d. None of the above Explanation: Lesson 3 / Video 6 / Slides 9 – 10 Week 5 Commented [JD3]: Q.5 Ploting ROC seems redundant here as the answer is mainly centered around AUCFor Questions 6-8 you will use the dataset “managers” from the PerformanceAnalytics package in R. This dataset is already in XTS format and no further data cleaning is necessary. Please use this dataset as is and DO NOT impute any null values with 0. The dataset begins on 1996-01-30 and end on 2006-12-31. It contains the following variables: • HAM1-HAM6: Columns of monthly returns for six hypothetical asset managers • EDHEC LS EQ: EDHEC Long-Short Equity hedge fund index • SP500 TR: S&P 500 total returns • US 10YR TR: Total return series for US Treasury 10-year bond • US 3m TR: Total return series for US Treasury 3-month bill The dataset "managers” can be found by using the following code: if (!require(PerformanceAnalytics)) install.packages("PerformanceAnalytics") library(PerformanceAnalytics) data(managers) Note: You may/may not need the following dependencies: lubridate package Q6 a) Find the standard deviation of HAM4 over the entire period given by the dataset. (Dataset period: 1996-01-30 to 2006-12-31) a. 5.32% b. 2.56% c. 0.25% d. 1.32% Answer: A. 5.32% Explanation: round(sd(managers$HAM4)*100,2) Homework 2, part 2, question 1; Midterm Q14 b) Find HAM4's (arithmetic) average return over the entire period given by the dataset? (Dataset period: 1996-01-30 to 2006-12-31) a. 2.3% b. 0.5% c. 1.1% d. 2.1% Answer: C 1.1 round(mean(managers$HAM4)*100,2) Homework 2, part 2, question 1; Midterm Q14 Commented [CA4]: There might be questions about if they should remove the na's in the data or not, please clarify t [Show More]
Last updated: 1 year ago
Preview 1 out of 17 pages
Buy this document to get the full access instantly
Instant Download Access after purchase
Add to cartInstant download
We Accept:

Also available in bundle (1)
MGT 6203 COMPLETE COURSE
MGT 6203 Homework 3- Questions & Answers | All Answers Correct Week 10 Self Assessment 6_ Data Analytics Business - MGT-6203-OAN MGT 6203 Homework 3- Questions & Answers | All Answers Correct...
By d.occ 2 years ago
$36
18
Reviews( 0 )
$8.00
Document information
Connected school, study & course
About the document
Uploaded On
Aug 03, 2021
Number of pages
17
Written in

Additional information
This document has been written for:
Uploaded
Aug 03, 2021
Downloads
1
Views
114