Business Administration > Capism > Capsim Simulation Report. Davenport University CAPS 795 (All)
Capsim Simulation Report. Davenport University CAPS 795
Document Content and Description Below
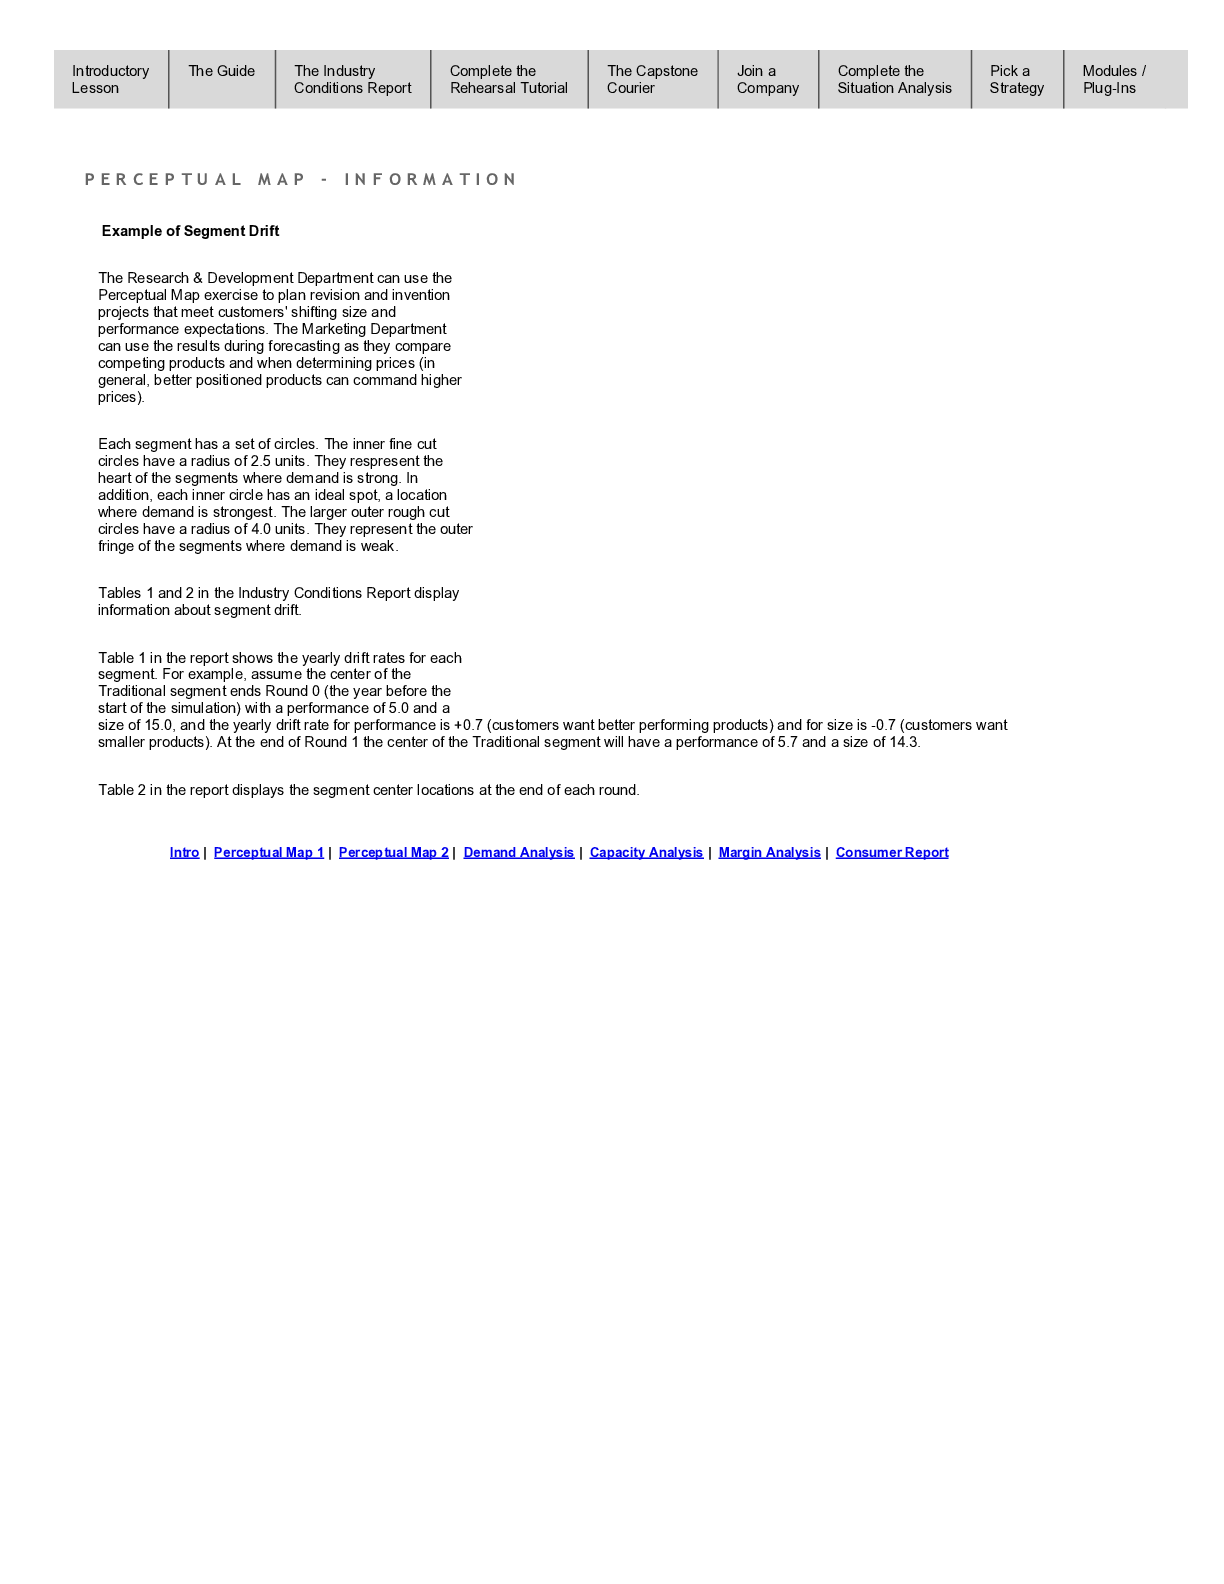
Capsim Simulation Report Situational Analysis/ Perpetual Map There are five areas the situation analysis in which provides us with insight into the status the market is during the simulation. The a... nalysis also shows us the anticipated direction of the market and what buyers are interested in. The perpetual map is the first part of the situational analysis. Customers’ expectations and needs are constantly changing which affects the size and performance margins. With these changes, the marketing department can study the results from the map within their forecasting schedule to best meet the needs of the customers. From a visual perspective (image below), the circles on the map help us indicate the strongest demand for the products. If you are looking at the image below, you will notice two different types of circles: dotted circle and a solid circle. The dotted circle is signaling a weaker demand where the solid circle is a much higher market demand. High ends will drift at a faster rate while the low ends drift much slower. Performance rates tend to fluctuate so it is important companies are aware and cognizant of these changes. [Show More]
Last updated: 1 year ago
Preview 1 out of 6 pages

Reviews( 0 )
Document information
Connected school, study & course
About the document
Uploaded On
Aug 22, 2022
Number of pages
6
Written in

Additional information
This document has been written for:
Uploaded
Aug 22, 2022
Downloads
0
Views
71
.png)


.png)
.png)