Programming > QUESTIONS & ANSWERS > University of California, Berkeley DATA MISC Homework 10: Linear Regression (All)
University of California, Berkeley DATA MISC Homework 10: Linear Regression
Document Content and Description Below
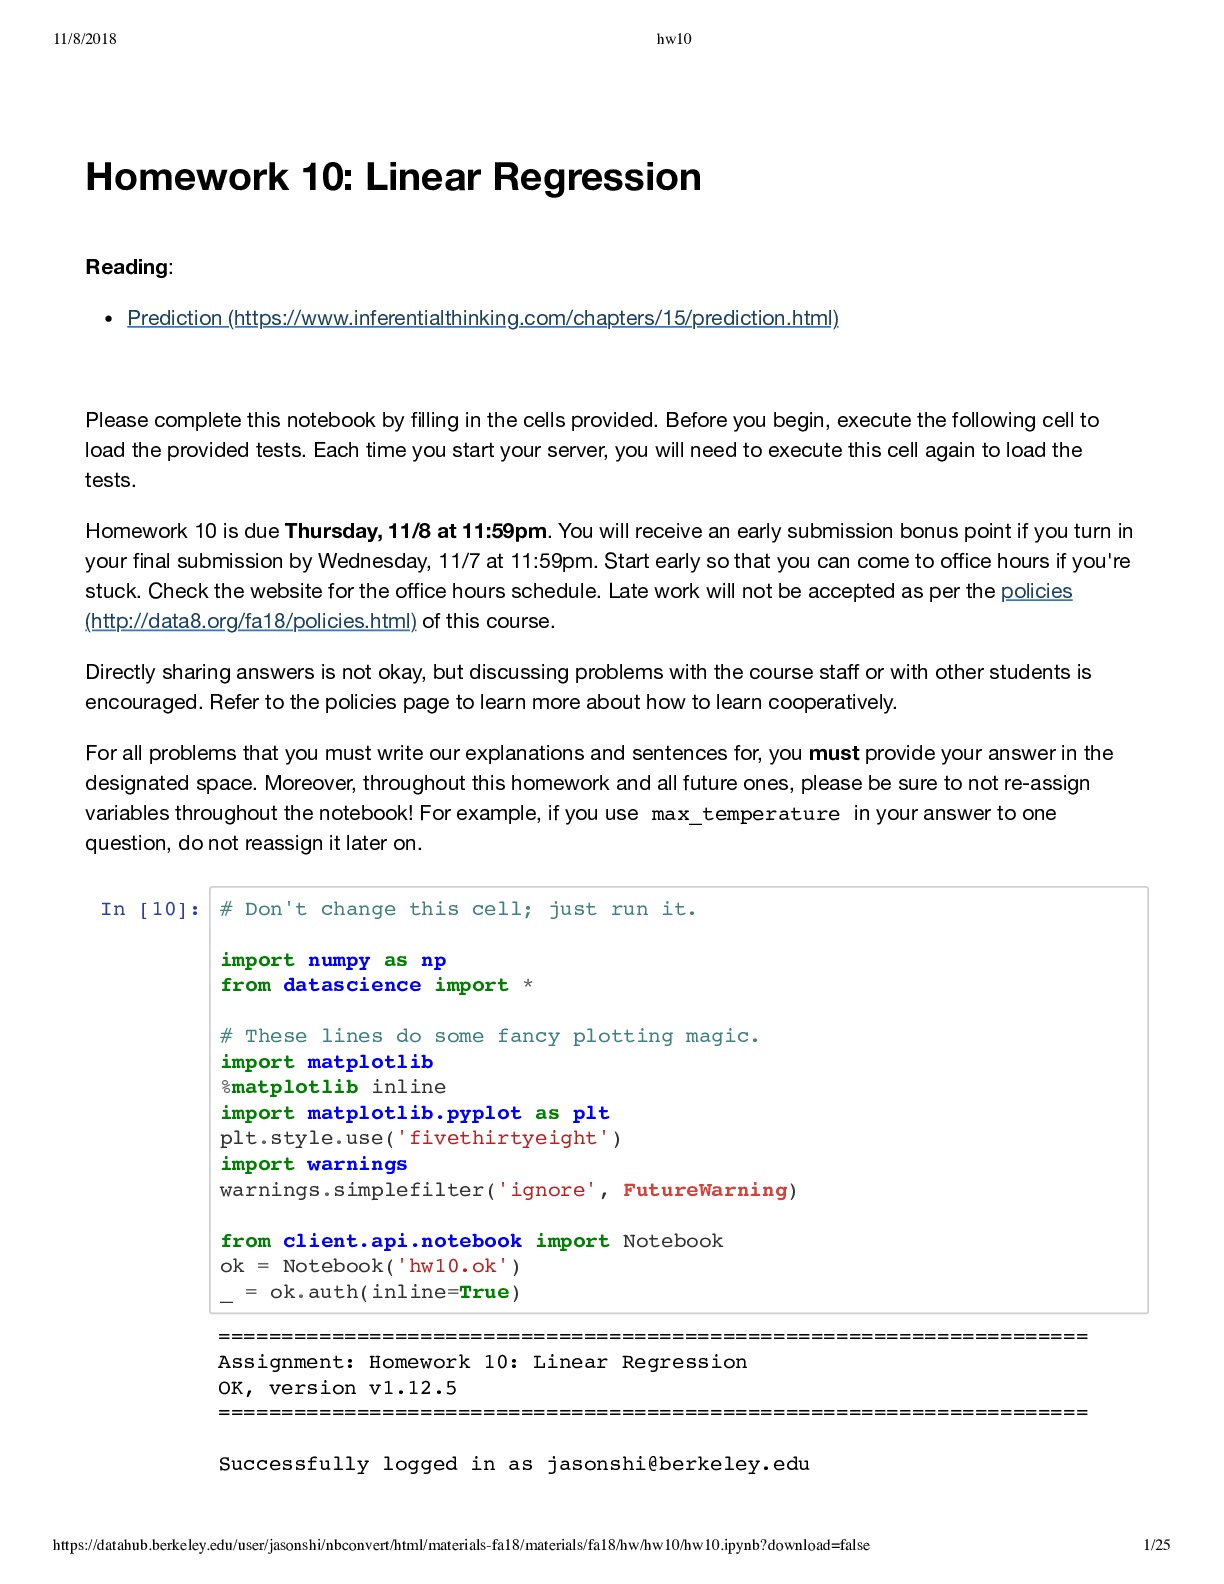
University of California, Berkeley DATA MISC Homework 10: Linear Regression Reading: Prediction (https://www.inferentialthinking.com/chapters/15/prediction.html) 1. Triple Jump Distances vs... . Vertical Jump Heights Does skill in one sport imply skill in a related sport? The answer might be different for different activities. Let us find out whether it's true for the triple jump (https://en.wikipedia.org/wiki/Triple_jump) (a horizontal jump similar to a long jump) and the vertical jump. Since we're learning about linear regression, we will look specifically for a linear association between skill level in the two sports. The following data was collected by observing 40 collegiate level soccer players. Each athlete's distances in both jump activities were measured in centimeters. Run the cell below to load the data. Question 1 Before running a regression, it's important to see what the data look like, because our eyes are good at picking out unusual patterns in data. Draw a scatter plot with the triple jump distances on the horizontal axis and the vertical jump heights on vertical axis that also shows the regression line. See the documentation on scatter here (http://data8.org/datascience/_autosummary/datascience.tables.Table.scatter.html#datascience.tables.Table.scatt for instructions on how to have Python draw the regression line automatically. Question 2 Does the correlation coefficient r look closest to 0, .5, or -.5? Explain. The correlation coefficient r looks closest to 0.5. The fitted line is trending up so r is positive, and the slope of the fitted line looks close to 0.5. Question 3 Create a function called regression_parameters . It takes as its argument a table with two columns. The first column is the x-axis, and the second column is the y-axis. It should compute the correlation between the two columns, then compute the slope and intercept of the regression line that predicts the second column from the first, in original units (centimeters). It should return an array with three elements: the correlation coefficient of the two columns, the slope of the regression line, and the intercept of the regression line. Question 4 Let's use parameters to predict what certain athletes' vertical jump heights would be given their triple jump distances. The world record for the triple jump distance is 18.29 meters by Johnathan Edwards. What's our prediction for what Edwards' vertical jump would be? Hint: Make sure to convert from meters to centimeters! Question 5 Do you expect this estimate to be accurate within a few centimeters? Why or why not? Hint: Compare Edwards' triple jump distance to the triple jump distances in jumps . Is it relatively similar to the rest of the data? No, because Edward's triple jump distance is much greater than any of the triple jump distances in the table. Because it is an outlier, estiamting his vertical jump distance using the data in the table will not be accurate within a few centimeters. 2. Cryptocurrencies ~~~~~~~~~~~~~~~~~~~~~~~~~~~~~~~~~~~~~~~~~~~~~~~~~~~~~~~~~~~~~~~~~~~~~ Running tests --------------------------------------------------------------------- Test summary Passed: 1 Failed: 0 [ooooooooook] 100.0% passed Saving notebook... Saved 'hw10.ipynb'. Backup... 100% complete Backup successful for user: [email protected] URL: https://okpy.org/cal/data8/fa18/hw10/backups/KZnENn NOTE: this is only a backup. To submit your assignment, use: python3 ok --submit 11/8/2018 hw10 https://datahub.berkeley.edu/user/jasonshi/nbconvert/html/materials-fa18/materials/fa18/hw/hw10/hw10.ipynb?download=false 7/25 Imagine you're an investor in December 2017. Cryptocurrencies, online currencies backed by secure software, are becoming extremely valuable, and you want in on the action! The two most valuable cryptocurrencies are Bitcoin (BTC) and Ethereum (ETH). Each one has a dollar price attached to it at any given moment in time. For example, on December 1st, 2017, one BTC costs 10859.56 and one ETH costs 424.64. You want to predict the price of ETH at some point in time based on the price of BTC. Below, we load (https://www.kaggle.com/jessevent/all-crypto-currencies/data) two tables called btc and eth . Each has 5 columns: date , the date open , the value of the currency at the beginning of the day close , the value of the currency at the end of the day market , the market cap or total dollar value invested in the currency day , the number of days since the start of our data Question 1 In the cell below, make one or two plots to investigate the opening prices of BTC and ETH as a function of time. Then comment on whether you think the values roughly move together. The values roughly moved together when they were lower in value, but started spreading out once they were higher in value. In all, they show a positive relationship Question 2 Now, calculate the correlation coefficient between the opening prices of BTC and ETH. Hint: It may be helpful to define and use the function std_units . Question 3 Regardless of your conclusions above, write a function eth_predictor which takes an opening BTC price and predicts the price of ETH. Again, it will be helpful to use the function regression_parameters that you defined earlier in this homework. Note: Make sure that your eth_predictor is using linear regression. Question 4 Now, using the eth_predictor you defined in the previous question, make a scatter plot with BTC prices along the x-axis and both real and predicted ETH prices along the y-axis. The color of the dots for the real ETH prices should be different from the color for the predicted ETH prices. Hints: An example of such a scatter plot is generated <a href= "https://www.inferentialthinking.com/chapters/15/2/regression-line.html (https://www.inferentialthinking.com/chapters/15/2/regression-line.html) "> here. </a> Think about the table that must be produced and used to generate this scatter plot. What data should the columns represent? Based on the data that you need, how many columns should be present in this table? Also, what should each row represent? Constructing the table will be the main part of this question; once you have this table, generating the scatter plot should be straightforward as usual. [Show More]
Last updated: 1 year ago
Preview 1 out of 25 pages
Reviews( 0 )
Document information
Connected school, study & course
About the document
Uploaded On
Oct 02, 2022
Number of pages
25
Written in

Additional information
This document has been written for:
Uploaded
Oct 02, 2022
Downloads
0
Views
34


.png)


.png)


.png)

.png)


.png)
