Statistics > QUESTIONS & ANSWERS > (answered) STAT 200 STAT200 LAB 7 COMMON DISTRIBUTIONS - PENN STATE (All)
(answered) STAT 200 STAT200 LAB 7 COMMON DISTRIBUTIONS - PENN STATE
Document Content and Description Below
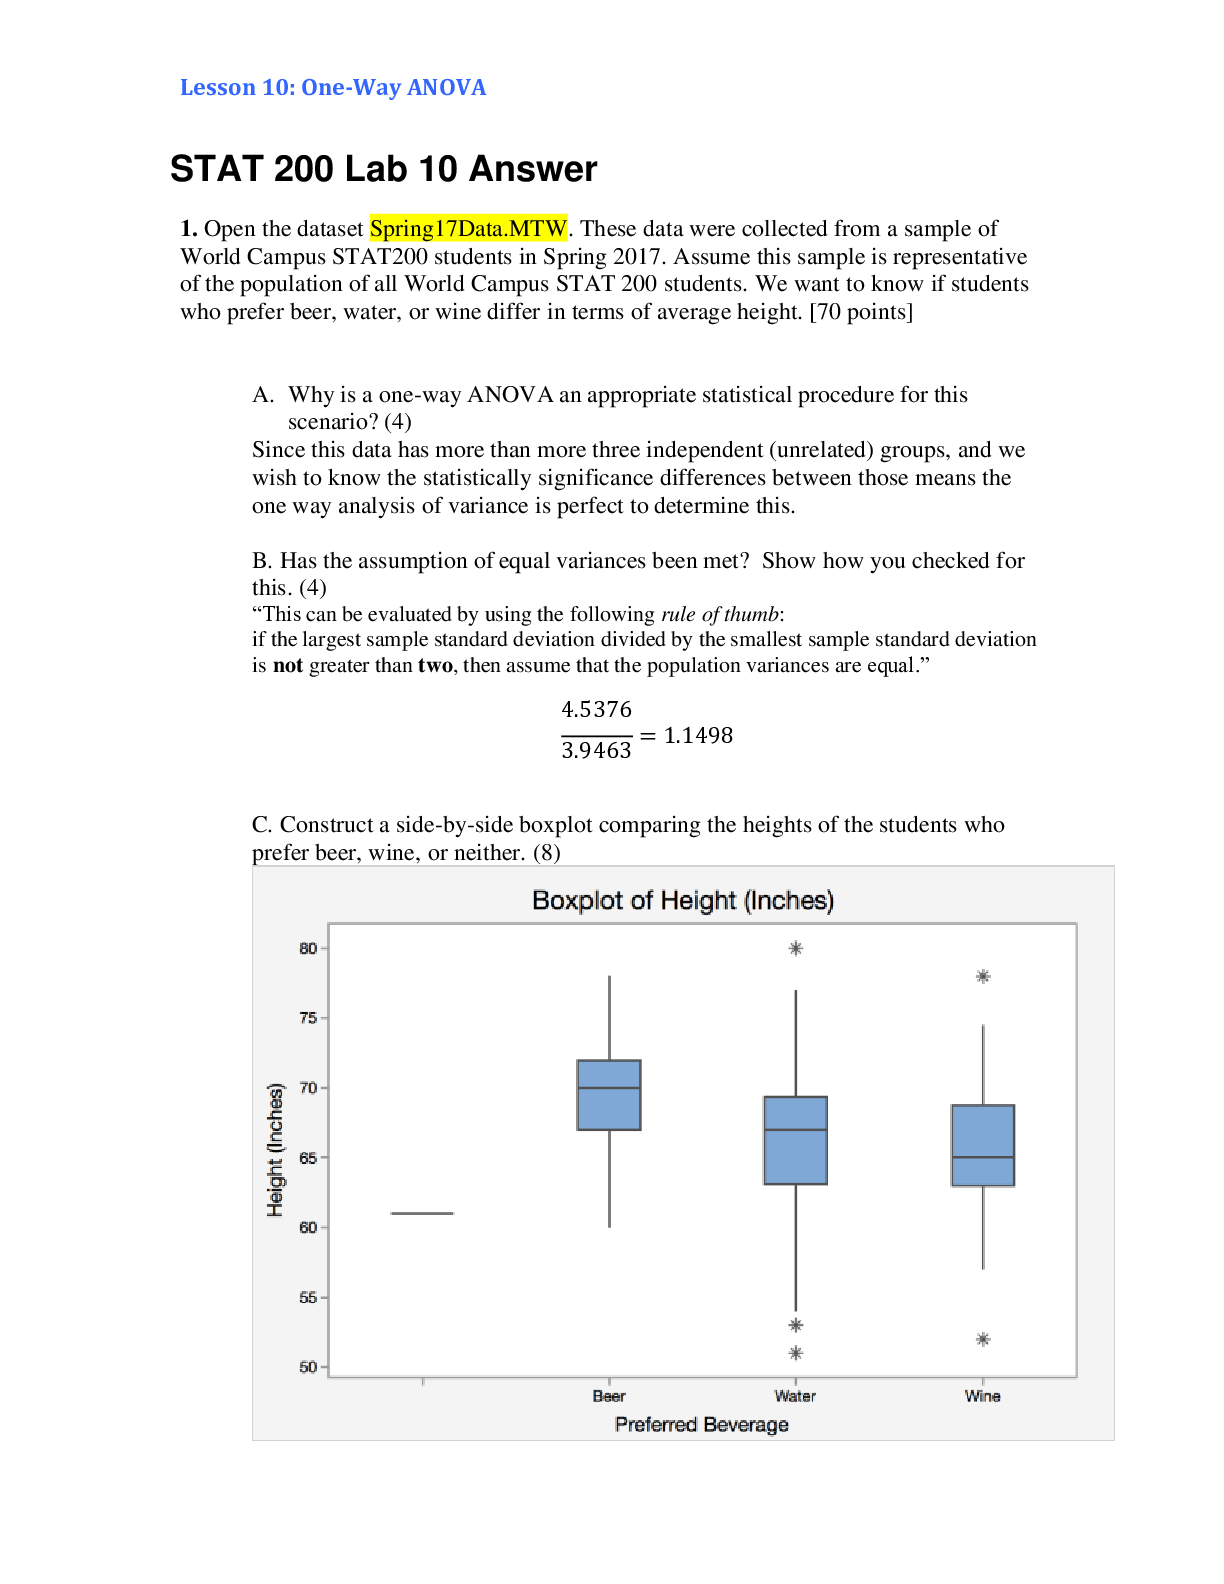
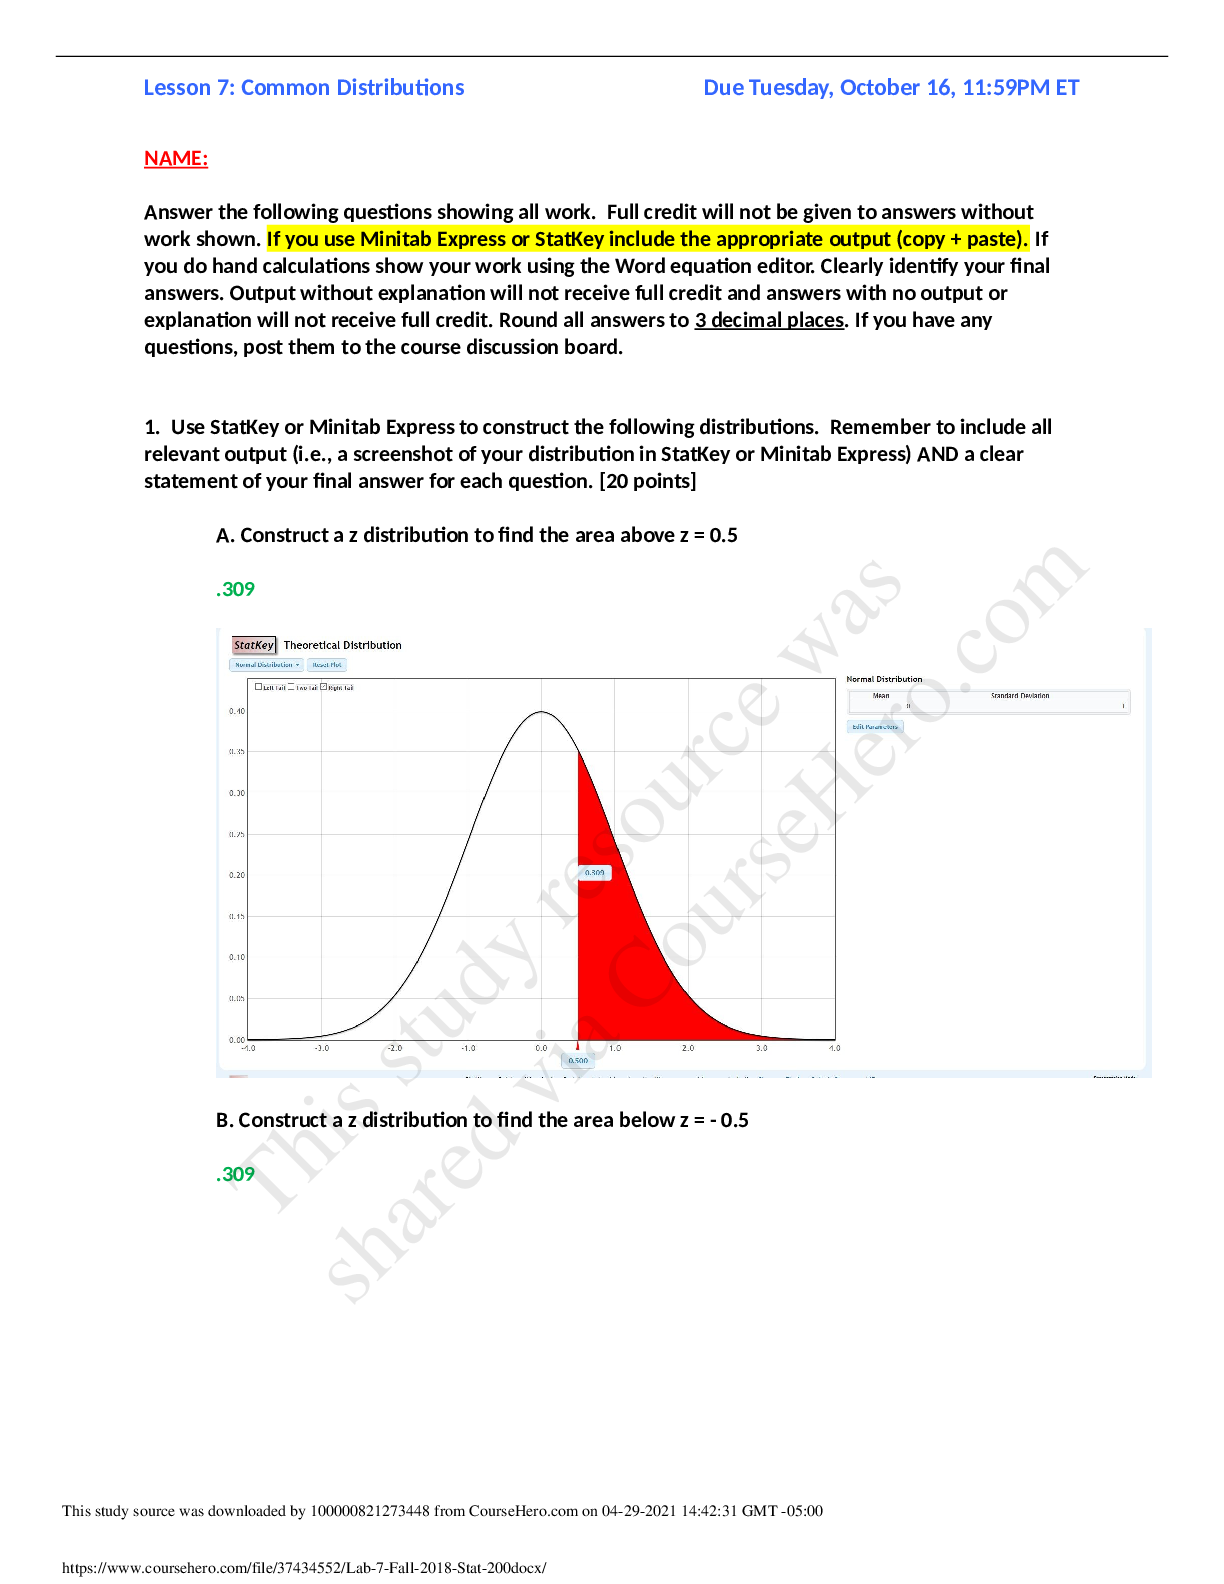
STAT 200 STAT200 LAB 7 COMMON DISTRIBUTIONS - PENN STATE NAME: Answer the following questions showing all work. Full credit will not be given to answers without work shown. If you use Minitab ... Express or StatKey include the appropriate output (copy + paste). If you do hand calculations show your work using the Word equation editor. Clearly identify your final answers. Output without explanation will not receive full credit and answers with no output or explanation will not receive full credit. Round all answers to 3 decimal places. If you have any questions, post them to the course discussion board. 1. Use StatKey or Minitab Express to construct the following distributions. Remember to include all relevant output (i.e., a screenshot of your distribution in StatKey or Minitab Express) AND a clear statement of your final answer for each question. [20 points] A. Construct a z distribution to find the area above z = 0.5 B. Construct a z distribution to find the area below z = - 0.5 C. Construct a normal distribution with a mean of 100 and standard deviation of 10 to find the area above x = 105 D. Explain why your answers to A, B, and C are all the same. 2. We want to test the alternative hypothesis that p > 0.60 using a sample of n=200. In that sample of 200, there were 133 successes. [45 points] Hint: Your answers for parts A, D, and F should be very similar. A. Use StatKey to conduct a randomization test. If you need a review, see Lesson 5. Step 1: Determine what type of test you need to conduct and write the hypotheses. Randomization Test for a Proportion Step 2: Construct a randomization distribution under the assumption that the null hypothesis is true. Take at least 5000 resamples. Step 3: Use the randomization distribution to find the p-value. Step 4: Decide if you should reject or fail to reject the null hypothesis. Step 5: State a real-world conclusion in relation to the original research question. B. Describe the shape of your randomization distribution. C. From your randomization distribution, what is the standard error? D. Model the randomization distribution with a normal distribution. To do this you will construct a normal distribution with a mean of 0.60 (null parameter) and standard deviation equal to this standard error that from part C. Find the p-value by finding the area to the right of the observed sample proportion in this normal distribution. Include a screenshot of your distribution here and clearly identify your p-value. E. Compute the standardized test statistic using the formula for the general form of a test statistic. Use the standard error from part C. F. Construct a z distribution (i.e., standard normal distribution) to find the area to the right of the test statistic in part E; this is the p-value. Include a screenshot of your distribution here and clearly identify your p-value. G. Different methods were used in parts A, D, and F, yet the p-values were all similar. Explain why these p-values are all similar even though different methods were used. 3. At the beginning of the Summer 2018 semester, a sample of 266 World Campus students were surveyed and asked if they were a first-generation college student. In the sample of 266, 139 said that they were first generation college students. We want to construct a 90% confidence interval to estimate the proportion of all World Campus students who are first generation students. [20 points] Hint: Your answers in parts A and C should be very similar. A. In StatKey, construct a bootstrap distribution and use the percentile method to find the 90% confidence interval using the data given. Include a screenshot of your distribution here and clearly identify your confidence interval. If you need a review of bootstrapping methods, see Lesson 4. B. Use StatKey or Minitab Express to construct a z distribution to identify the z* multiplier for a 90% confidence interval. Include a screenshot of your distribution here and clearly identify your z* multiplier. C. Use the formula from the online notes to construct the 90% confidence interval: . You can use the standard error from the distribution you constructed in part A and the z* multiplier that you found in part B. 4. A quiz has 5 multiple-choice questions. Each question has four answer options (A, B, C, and D). [15 points] A. Assuming that all students randomly guess on all questions, compute the expected mean and standard deviation of the distribution of quiz scores. B. A 60% is required to pass the quiz (i.e., 3 out of 5 questions correct). Assuming that a student is randomly guessing on all questions, what is the probability that they will get 3 or more questions correct? Include a screenshot of your distribution here and clearly identify your answer. C. D. Assuming that a student is randomly guessing on all questions, what is the probability that they will get all 5 questions correct? Include a screenshot of your distribution here and clearly identify your answer. [Show More]
Last updated: 1 year ago
Preview 1 out of 7 pages
Buy this document to get the full access instantly
Instant Download Access after purchase
Add to cartInstant download
We Accept:

Reviews( 0 )
$10.00
Document information
Connected school, study & course
About the document
Uploaded On
Apr 28, 2021
Number of pages
7
Written in

Additional information
This document has been written for:
Uploaded
Apr 28, 2021
Downloads
0
Views
33

.png)