Statistics > SOPHIA PATHWAY > MAT 300 Unit 2 - Introduction to Statistics Practice Milestone_2 - 2022/2023 | MAT300 Unit_2_Practic (All)
MAT 300 Unit 2 - Introduction to Statistics Practice Milestone_2 - 2022/2023 | MAT300 Unit_2_Practice Milestone_2_Graded A+
Document Content and Description Below
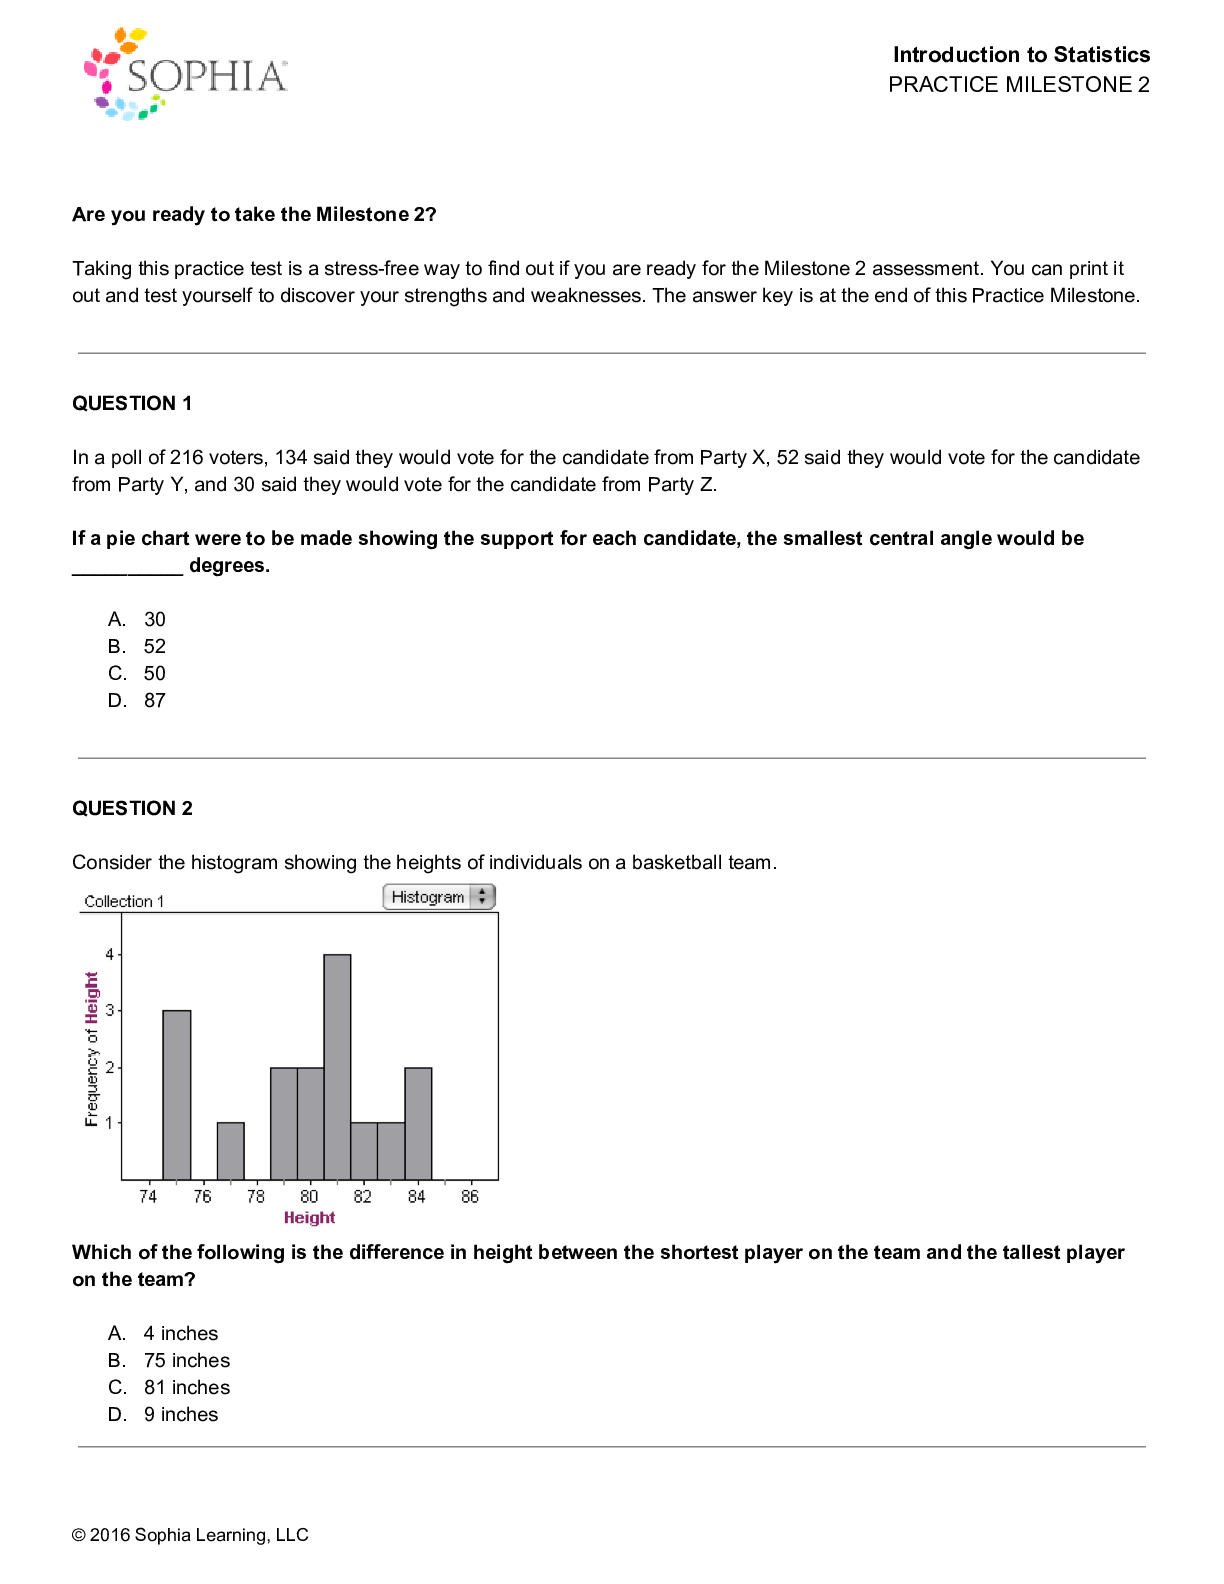
MAT 300 Unit_2_Milestone_2_ (2022) - Sophia University MAT300 Unit_2_Milestone_2_(2022) Introduction to Statistics PRACTICE MILESTONE 2 Are you ready to take the Milestone 2? Taking this practice... test is a stress-free way to find out if you are ready for the Milestone 2 assessment. You can print it out and test yourself to discover your strengths and weaknesses. The answer key is at the end of this Practice Milestone. QUESTION 1 In a poll of 216 voters, 134 said they would vote for the candidate from Party X, 52 said they would vote for the candidate from Party Y, and 30 said they would vote for the candidate from Party Z. If a pie chart were to be made showing the support for each candidate, the smallest central angle would be __________ degrees. A. 30 B. 52 C. 50 D. 87 QUESTION 2 Consider the histogram showing the heights of individuals on a basketball team. Which of the following is the difference in height between the shortest player on the team and the tallest player on the team? A. 4 inches B. 75 inches C. 81 inches D. 9 inches © 2016 Sophia Learning, LLCIntroduction to Statistics PRACTICE MILESTONE 2 QUESTION 3 The graph in the figure shows the Gross Domestic Product (GDP) from 2008-2011. The segment of the graph that corresponds to almost no GDP growth at all is __________. A. A B. B C. C D. D QUESTION 4 Consider the times (in seconds) that it took children and adults to solve a Rubik’s cube at a competition. What does the circled section represent? A. It took 7 children 21 seconds to complete the Rubik’s cube. B. Two children took over 70 seconds to solve the Rubik’s cube. C. It took 7 children 12 seconds to solve the Rubik’s cube. D. It took 21 children 7 seconds to solve the Rubik’s cube. © 2016 Sophia Learning, LLCIntroduction to Statistics PRACTICE MILESTONE 2 QUESTION 5 The data below shows the number of text messages received by a group of students in a day. How many students received 10 to 13 messages? A. 5 B. 9 C. 4 D. 6 QUESTION 6 A workplace gave an “Employee Culture Survey” in which 500 employees rated their agreement with the statement, “I feel respected by those I work for.” Rating Frequency Strongly Agree 156 Agree 114 Neutral 99 Disagree 88 Strongly Disagree 43 The relative frequency of people who strongly agree with the statement is __________%. A. 312 B. 54 C. 8.6 D. 16 © 2016 Sophia Learning, LLCIntroduction to Statistics PRACTICE MILESTONE 2 QUESTION 7 Sara wonders what percentage of her students answered at least half of the quiz questions incorrectly. The relative cumulative frequency of students who earned a score of 20 or lower on the quiz is __________%. A. 14 B. 34 C. 7 D. 68 QUESTION 8 A baseball scout recorded the type of pitch a pitcher threw during a game and whether it was thrown for a strike or a ball. Which of the following is a true statement about the stacked bar chart? A. Answer B. Answer C. Answer D. Answer © 2016 Sophia Learning, LLCIntroduction to Statistics PRACTICE MILESTONE 2 QUESTION 9 Katherine, Jonathan, and Ryan are very competitive friends who went bowling. Afterwards, two of them decided to make bar graphs to plot their scores. Who do you think made Graph 1 and why? A. Katherine, because she wanted to make the scores appear reasonably close. B. Jonathan, because he wanted to make the scores appear very different. C. Katherine, because she wanted to make the scores appear very different. D. Ryan, because he wanted to accurately show each person’s score. E. Jonathan, because he wanted to make the scores appear reasonably close. QUESTION 10 Match each term with its corresponding definition. 1. A number that describes the middle of a set of data A. Shape 2. A qualitative statement about how the data looks after it has been plotted B. Center 3. A number that describes how far the data is from the middle C. Spread © 2016 Sophia Learning, LLCIntroduction to Statistics PRACTICE MILESTONE 2 QUESTION 11 Determine if each graph is positively skewed, negatively skewed, or symmetrical. Positivity (Right) Skewed Negatively (Left) Skewed Symmetrical Distribution © 2016 Sophia Learning, LLCIntroduction to Statistics PRACTICE MILESTONE 2 QUESTION 12 Stan is looking at the statistics for his favorite baseball player, who has hit 25, 26, 32, 38, 43, 40, 28, 32, 34, and 42 home runs in ten seasons. Using this data set, match each value with the correct description. 1. Mean A. 32 2. Median B. 33 3. Mode C. 34 QUESTION 13 Joe is playing a game in which he has to roll two six-sided dice. In his past ten rolls, he has rolled a sum of one 2, two 5s, three 7s, two 8s, one 10, and one 12. The weighted mean of all of Joe’s dice rolls is __________. A. 7.3 B. 7.1 C. 7.5 D. 6.8 QUESTION 14 Which of the following statements correctly describes a measure of center? A. There can only be one mode in any given set of data. B. The median can be used to describe any qualitative data. C. The mean and median can be used to summarize any quantitative data. D. The mean is unaffected by extreme values in a small data set. E. The median is calculated by adding all of the values in a data set and then dividing by the total number of values. QUESTION 15 Which of the following two statements are true? A. The range is found by subtracting the minimum value from the maximum value. B. The interquartile range is better than the standard deviation to describe skewed data sets. C. The interquartile range covers the middle 75% of the data set. D. The range is found by subtracting the maximum value from the minimum value. © 2016 Sophia Learning, LLCIntroduction to Statistics PRACTICE MILESTONE 2 QUESTION 16 Which of the following statements correctly describes the variance of a data set? A. The variance has the same units as the standard deviation. B. The variance is the square of the standard deviation. C. The variance has the same units as the data set. D. The variance is the square root of the standard deviation. E. The variance is calculated using the median. QUESTION 17 The formula for standard deviation is sx =√N−11 i∑=N1(xi − x) 2 The standard deviation of the data set 2, 4, 4, 4, 5, 5, 5, 7, 9, which has a mean of 5, is __________. A. 0 B. 1 C. 2 D. 4 QUESTION 18 Using the box-and-whisker plot, match each description with the correct value. 1. First Quartile A. 52 2. Second Quartile B. 70 3. Third Quartile C. 33 D. 29 E. 40 © 2016 Sophia Learning, LLCIntroduction to Statistics PRACTICE MILESTONE 2 QUESTION 19 An outlier is which of the following? A. Any value in a data set that is larger than twice the median value B. A value in a data set that is only significantly lower than most of the values in the data set C. Any value in a data set that is larger than twice the mean value D. A value in a data set that is significantly higher or lower than most of the values in the data set E. A value in a data set that is the highest or lowest of the values in the data set QUESTION 20 Jenova has scored ten standardized tests with scores of 65, 88, 46, 72, 77, 90, 95, 59, 66, and 83. The standardized test score that represents the sixtieth percentile is __________. A. 65 B. 77 C. 66 D. 59 QUESTION 21 Which of the following statements is NOT true about the normal distribution? A. The normal distribution can be described as “bell-shaped.” B. We only need to know the mean and standard deviation in order to completely describe a normal distribution. C. The normal distribution is an example of a bimodal distribution. D. A large portion of the data is located near the center in a normal distribution. E. The normal distribution is symmetric about the mean. QUESTION 22 Rick is an engineer testing the stress required to break samples of steel. He measured the failure stress of 50 samples and found the mean failure stress to be 350 MPa, with a standard deviation of 25 MPa. If the distribution is normal, the percentage of the data that lies within two standard deviations of the mean is approximately __________. A. 95% B. 68% C. 99.7% D. 5% © 2016 Sophia Learning, LLCIntroduction to Statistics PRACTICE MILESTONE 2 QUESTION 23 Matt just received his test back. He scored a 78 out of a possible 90 points. His teacher told him the mean score on the test was a 70, with a standard deviation of 5. Matt’s z-score for the test was __________. A. -2.4 B. 2.4 C. -1.6 D. 1.6 QUESTION 24 Erica is performing an experiment that requires her to weigh multiple samples. The masses of her samples are found to be normally distributed with a mean of 157g and a standard deviation of 5.2g. If Erica wants to convert her data to a standard normal distribution, which of the following statements is true? A. The new mean would be 0, and the standard deviation would be 5. B. The new mean would be 1, and the standard deviation would be 5. C. The new mean would be 0, and the standard deviation would be 1. D. The new mean would be 1, and the standard deviation would be 0. QUESTION 25 Let x stand for the percentage of an individual student's math test score. 100 students were sampled at a time. The population mean is 75 percent and the population standard deviation is 12 percent. What are the mean and standard deviation of the sampling distribution of sample means? A. mean = 75, standard deviation = 12 B. mean = 75, standard deviation = 1.2 C. mean = 7.5, standard deviation = 1.2 D. mean = 7.5, standard deviation = 12 QUESTION 26 Which of the following statements is NOT true? A. The Central Limit Theorem is applicable only for data sets comprising 30 or more samples. B. According to the Central Limit Theorem, the mean of the sampling distribution is equal to the population mean. C. For a large enough sample size, the Central Limit Theorem states that the sample means of repeated samples of a population are normally distributed. D. For the Central Limit Theorem to be true, you must have a large sample, the underlying population must be normally distributed, and the standard deviation should not be finite [Show More]
Last updated: 1 year ago
Preview 1 out of 13 pages
Reviews( 2 )

by carra24 · 2 years ago
Thank you for the 5 stars, much appreciated and all the best in your studies. by Martin Freeman. 2 years ago
by Martin Freeman · 2 years ago
Thank you for the 5 stars, much appreciated and all the best in your studies.
Recommended For You
Statistics> SOPHIA PATHWAY > MAT 300 Unit 2 Practice Milestone 2_2022/2023 | MAT300 Unit 2 Practice Milestone 2_Graded A+ (All)
MAT 300 Unit 2 Practice Milestone 2_2022/2023 | MAT300 Unit 2 Practice Milestone 2_Graded A+
MAT 300 Unit_2_Practice_Milestone_2_(2022) - Sophia University MAT300 Unit_2_Practice_Milestone_2_(2022) UNIT 2 — PRACTICE MILESTONE 2 Download Practice Milestone PDF Score 23/26 You passed this...
By Martin Freeman , Uploaded: Sep 14, 2020
$14.5
Statistics> SOPHIA PATHWAY > MAT 300 Unit_2_Introduction to Statistics_Practice Milestone_2_(2021) | MAT300 Unit_2_Practice Milestone_2_Graded A LATEST 2021/2022 (All)

MAT 300 Unit_2_Introduction to Statistics_Practice Milestone_2_(2021) | MAT300 Unit_2_Practice Milestone_2_Graded A LATEST 2021/2022
MAT 300 Unit_2_Milestone_2_ (2021) - Sophia University MAT300 Unit_2_Milestone_2_(2020) Introduction to Statistics PRACTICE MILESTONE 2 Are you ready to take the Milestone 2? Taking this practice test...
By A+ Grades , Uploaded: Aug 04, 2021
$16
Statistics> SOPHIA PATHWAY > MAT 300 Unit_2_Introduction to Statistics_Practice Milestone_2_(2021) | MAT300 Unit_2_Practice Milestone_2_Graded A LATEST 2021/2022 (All)
MAT 300 Unit_2_Introduction to Statistics_Practice Milestone_2_(2021) | MAT300 Unit_2_Practice Milestone_2_Graded A LATEST 2021/2022
MAT 300 Unit_2_Milestone_2_ (2021) - Sophia University MAT300 Unit_2_Milestone_2_(2020) Introduction to Statistics PRACTICE MILESTONE 2 Are you ready to take the Milestone 2? Taking this practice test...
By Tutor Frankline , Uploaded: Aug 04, 2021
$16
Biology> SOPHIA PATHWAY > SOPHIA PATHWAYS Environmental Science Practice milestone Unit 2 - Milestone 2/SOPHIA PATHWAYS Visual Communications Unit 2 milestone 2 (All)
SOPHIA PATHWAYS Environmental Science Practice milestone Unit 2 - Milestone 2/SOPHIA PATHWAYS Visual Communications Unit 2 milestone 2
SOPHIA PATHWAYS Environmental Science Practice milestone Unit 2 - Milestone 2/Which of the terms listed below best describes the use of color in this sustainability poster? ✓ Monochromatic use of co...
By PROF , Uploaded: Apr 23, 2021
$10
Statistics> SOPHIA PATHWAY > MATH 1280 Practice Milestone UNIT 1 Introduction to Statistics (2020) – University of the People | MATH1280 Practice Milestone UNIT 1 Introduction to Statistics (2020) (All)
 – University of the People.png)
MATH 1280 Practice Milestone UNIT 1 Introduction to Statistics (2020) – University of the People | MATH1280 Practice Milestone UNIT 1 Introduction to Statistics (2020)
1 MATH 1280 Practice Milestone UNIT 1 Introduction to Statistics (2020) – University of the People Which of the following data types will be continuous? • Number of cars produced by a car c...
By Martin Freeman , Uploaded: Sep 14, 2020
$16.5
Statistics> SOPHIA PATHWAY > MATH 1280 Milestone 2_Introduction to Statistics (2020) – University of the People | MATH 1280 Milestone 2_Introduction to Statistics (2020) (All)
 – University of the People.png)
MATH 1280 Milestone 2_Introduction to Statistics (2020) – University of the People | MATH 1280 Milestone 2_Introduction to Statistics (2020)
1 MATH 1280 Milestone 2_Introduction to Statistics (2020) – University of the People Hannah noted the height of each student in her class and found that the mean height of the students is 56 i...
By Martin Freeman , Uploaded: Sep 14, 2020
$16.5
Statistics> SOPHIA PATHWAY > MATH 1280 Milestone 3_Introduction to Statistics (2020) – University of the People | MATH1280 Milestone 3_Introduction to Statistics (2020) (All)
 – University of the People.png)
MATH 1280 Milestone 3_Introduction to Statistics (2020) – University of the People | MATH1280 Milestone 3_Introduction to Statistics (2020)
1 MATH 1280 Milestone 3_Introduction to Statistics (2020) – University of the People Tracie spins the four-colored spinner shown below. She records the total number of times the spinner l...
By Martin Freeman , Uploaded: Sep 14, 2020
$16.5
Statistics> SOPHIA PATHWAY > MATH 1280 Milestone 4_Introduction to Statistics (2020) – University of the People | MATH1280 Milestone 4_Introduction to Statistics (2020) (All)
 – University of the People.png)
MATH 1280 Milestone 4_Introduction to Statistics (2020) – University of the People | MATH1280 Milestone 4_Introduction to Statistics (2020)
1 MATH 1280 Milestone 4_Introduction to Statistics (2020) – University of the People Which statement about correlation is FALSE? • The correlation of a data set can be positive, negativ...
By Martin Freeman , Uploaded: Sep 14, 2020
$16.5
Statistics> SOPHIA PATHWAY > Sophia Introduction to Statistics Milestone 1_(2020) – University of Maryland | Sophia Introduction to Statistics Milestone 1_(2020) (All)
 – University of Maryland.png)
Sophia Introduction to Statistics Milestone 1_(2020) – University of Maryland | Sophia Introduction to Statistics Milestone 1_(2020)
Sophia Introduction to Statistics Milestone 1_(2020) – University of Maryland 25 questions were answered correctly. 4 questions were answered incorrectly. 1 Cindy measured and recorded the tem...
By Martin Freeman , Uploaded: Sep 14, 2020
$14.5
Statistics> SOPHIA PATHWAY > MATH 1280 Milestone 1_Introduction to Statistics (2020) – University of the People | MATH1280 Milestone 1_Introduction to Statistics (2020) (All)
 – University of the People.png)
MATH 1280 Milestone 1_Introduction to Statistics (2020) – University of the People | MATH1280 Milestone 1_Introduction to Statistics (2020)
1 MATH 1280 Milestone 1_Introduction to Statistics (2020) – University of the People The administrator of a hospital conducted a survey among patients in the cardiology wing to determine servi...
By Martin Freeman , Uploaded: Sep 14, 2020
$16.5
Document information
Connected school, study & course
About the document
Uploaded On
Sep 14, 2020
Number of pages
13
Written in

Additional information
This document has been written for:
Uploaded
Sep 14, 2020
Downloads
2
Views
224