Statistics > SOPHIA PATHWAY > MATH 1280 Milestone 2_Introduction to Statistics (2020) – University of the People | MATH 1280 Mil (All)
MATH 1280 Milestone 2_Introduction to Statistics (2020) – University of the People | MATH 1280 Milestone 2_Introduction to Statistics (2020)
Document Content and Description Below
1 MATH 1280 Milestone 2_Introduction to Statistics (2020) – University of the People Hannah noted the height of each student in her class and found that the mean height of the students is 56... inches, with a standard deviation of 1.2 inches. The height of one of the students, James, is 59 inches. What is the z-score for James' height? • 2.5 • -2.5 • 3.6 • -3.6 RATIONALE Recall that the z-score can be calculated with the following formula: The given value is 59 inches, the mean is 56 inches, and the standard deviation is 1.2 inches. Plug these values in to get the following z-score: This also tells us that 59 is 2.5 z-scores or standard deviations above the mean. CONCEPT Standard Scores and Z-Scores 2 Which of the following is NOT a step used in calculating standard deviation? • Subtracting the value of each data set from the mean. • Dividing the sum of each value by the total number of values plus 1. • Calculating the mean of the data set. • Squaring the difference of x - u. RATIONALE Recall the standard deviation . So there is no addition of 1 to any values. CONCEPT Standard Deviation 3 In which of these cases should the median be used? • When the data has small variance • When the data has extreme values • When the data has nominal values • When data has no outliers RATIONALE Since the mean uses the actual values in the data, it is most affected by outliers and skewness. So, we only want to use the mean when the data is symmetric as a measure of centrality. When the data is skewed or has extreme values, the median is a better measure since it is not as sensitive to these values. CONCEPT Measures of Center 4 The average daily rainfall for the past week in the town of Hope Cove is normally distributed, with a mean rainfall of 2.1 inches and a standard deviation of 0.2 inches. If the distribution is normal, what percent of data lies between 1.9 inches and 2.3 inches of rainfall? • 95% • 34% • 99.7% • 68% RATIONALE Recall that if the data is normal, then the 68-95-99.7 rule applies which states that 68% of all data points fall within one standard deviation of the mean, 95% of all data points fall within two standard deviations of the mean, and 99.7% of all data points fall within three standard deviations of the mean. 1.9 inches and 2.3 inches are both 0.2 inches from the mean of 2.1 inches, which is the same as one standard deviation in either direction. This tells us that 68% of the data should lie between 1.9 inches to 2.3 inches. CONCEPT 68-95-99.7 Rule 5 Ralph records the time it takes for each of his classmates to run around the track one time. As he analyzes the data on the graph, he notices very little variation between his classmates’ times. Which component of data analysis is Ralph observing? • The overall spread of the data • The center of the data set • An outlier in the data set • The overall shape of the data RATIONALE Since Ralph is looking at the variation of data, this is examining the spread of the data. CONCEPT Data Analysis 6 Sara wonders what percentage of her students answered at least half of the quiz questions incorrectly. The relative cumulative frequency of students who earned a score of 21 or higher on the quiz is __________. • 18% • 68% • 16% • 32% RATIONALE To get the relative cumulative frequency of 21 or greater, we need to first find the cumulative number of 21 or more. We simply add up any bin that has the number 21 or more, such as the bin that shows scores of 21-25, 26-30, 31-35, and 36-40. This would be: To calculate relative cumulative frequency, we will take this cumulative number and divide it by the total number of students. CONCEPT Cumulative Frequency 7 At Jeremy's school, the final grade for his Human Biology course is weighted as follows: • Tests: 50% • Quizzes: 35% • Homework: 15% Jeremy has an average of 94% on his tests, 78% on his quizzes, and 62% on his homework. What is Jeremy's weighted average? • 83.6% • 74.8% • 75.6% • 78% RATIONALE In order to get the weighted average we use the following formula: CONCEPT Weighted Mean 8 Which of the following statements is true? • According to the Central Limit Theorem, the mean of the sampling distribution is greater than the population mean. • According to the Central Limit Theorem, the mean of the sampling distribution is greater than the standard deviation. • According to the Central Limit Theorem, the mean of the sampling distribution is equal to the population mean as long as the sample size is large enough. • According to the Central Limit Theorem, the mean of the sampling distribution is equal to the standard deviation. RATIONALE Recall that the central limit theorem states that as long as the sample size is large enough, then the sampling distribution will have a normal distribution that is centered at the true population mean. CONCEPT Shape of a Sampling Distribution 9 Consider this histogram showing the number of students in grade five who have one or more pets. What is the difference in the number of students with the most and least numbers of pets? • 9 • 2 • 10 • 4 RATIONALE The most number of pets is 10 and there is 1 person who has this many pets. The least number of pets is 1 and there are 5 people with 1 pet. So the difference in the number of people would be: CONCEPT Histograms 10 The formula for the standard deviation of a sample is: Select the true statement for the following data set that has a mean of 6.75: 4, 6, 7, 10 Answer choices are rounded to the hundredths place. • The variance is 2.50 and the standard deviation is 6.50. • The variance is 4.71 and the standard deviation is 2.17. • The variance is 6.75 and the standard deviation is 6.25. • The variance is 6.25 and the standard deviation is 2.50. RATIONALE We can first calculate the variance of the data, , by using the part of the formula under the square root: Next, we can find the standard deviation, , by simply taking the square root of the variance: We can also use the statistical functions in Excel to quickly find the variance and standard deviation. CONCEPT Standard Deviation 11 The midterm exam scores obtained by boys and girls in a class are listed in the table below. What does the circled section represent? • Two boys scored between 80 and 89 marks on the exam. • Twelve boys scored 8 marks on the exam. • Eight boys scored over 10 marks on the exam. • Eight boys scored 12 marks on the exam. RATIONALE If we recall that the stem and leaf can give us the actual values in the data set, then the circle corresponds to 81 and 82. We can then note that there are two scores from boys between 80 and 89. CONCEPT Stem-and-Leaf Plots 12 The school paper published the results of a survey among grade eight students with regards to their favorite subject. Which of the following statements about the stack plot is true? • Most of the students chose English as their favorite subject. • More girls than boys chose English as their favorite subject. • More than half the girls chose science as their favorite subject. • More boys chose math as their favorite subject than science. RATIONALE When examining English, we can see that the darker area (girls) is much larger than the boys. So it is true that more girls choose English as their favorite subject. In fact, in all subjects it appears that there are more girls relative to boys. CONCEPT Stack Plots 13 The difference between the standard deviation and the variance of a standard normal distribution is __________. • 0.5 • 1 • 2 • 0 RATIONALE Recall the variance and standard deviation of a standard normal are both 1, so the difference is 0. CONCEPT Standard Normal Distribution 14 Jerry, Stein, Johnson, and Mary had a competition to see who could profit the most off of their odd jobs during the summer. They discussed their earnings on the first day of school. Afterwards, each of them decided to make bar graphs to plot the different amounts they earned. Who made the above graph, and why? • Stein, because he wanted to make it look like he earned significantly more than the others. • Jerry, because he wanted to accurately show the amount made by each person. • Johnson, because he wanted to make the amount made by each person appear very different. • Mary, because she wanted to make the amount made by each person appear reasonably close. RATIONALE Since there was a competition, the person who most likely made this graph would want to represent themselves favorably. Since Stein has the most sales, it would probably be Stein. CONCEPT Misleading Graphical Displays 15 Select the statement that is TRUE. • The interquartile range (IQR) is the average value of a data set. • The interquartile range (IQR) is influenced by outliers. • The interquartile range (IQR) covers the middle 50% of a data set. • The interquartile range (IQR) is the middle value of a data set. RATIONALE Recall that the interquartile range is the difference of Q3 and Q1, or in other words, from the 75th percentile to the 25th percentile. So the IQR is the middle 50% of the data from the 25th to the 75th percentile. CONCEPT Range and Interquartile Range (IQR) 16 Which of the following statements about a positively skewed distribution is true? • The distribution of the data features two modes. • The distribution of the data tails to the right of the median. • The mean, median, and mode have the same values. • The distribution of the data tails to the left of the median. RATIONALE Skewness refers to how the data trends to the left or right. If a dataset is skewed, it is not symmetric. The direction of the tail of a distribution tells you which direction the skew lies. If there is positive skew, this implies the skew is to the right. If the distribution trends to the right, it will have a mean that is larger than the median due to those higher values. CONCEPT Shapes of Distribution 17 The dotplot below shows the height (in cm) of students in a class. How many students are taller than 140 centimeters? • 12 • 8 • 10 • 11 RATIONALE If we sum up the X's that represent a student who is taller than 140 centimeters, we need to include the number of students who are 141 cm tall, 142 cm tall, 143 cm tall, etc. This looks like: So 10 students are taller than 140 centimeters. CONCEPT Dot Plots 18 The third quartile (Q3) value from this box plot is __________. • 60 • 48 • 29 • 37 RATIONALE The value for Q3 is the right edge of the box, which in this figure is 48. CONCEPT Five Number Summary and Boxplots 19 The percent-change graph in the figure shows the change in Gross Domestic Product (GDP) from 2008-2012. Which segment of the graph indicates the greatest increase in GDP growth? • D • B • C • A RATIONALE Since the graph shows growth rate, the greatest growth rate will be the segment with the greatest slope that is positive. This is at segment B, where the growth rate increases from -0.5 to 2. CONCEPT Line Charts and Time-Series Diagrams 20 An outlier is which of the following? • A value that is significantly higher or lower than most of the values in the data set. • A value that is outside of the data set. • A value that is twice as large as the mean. • A value that is twice as small as the mean. RATIONALE Data that doesn't fit with the other data is considered an outlier. This would be values that are much smaller or larger than all the other data when considering 1 variable. CONCEPT Outliers and Modified Boxplots 21 Adam graded ten standardized tests with the following scores: 48, 65, 72, 86, 84, 52, 93, 97, 81, 80 Which standardized test score represents the 70th percentile? • 72 • 84 • 65 • 86 RATIONALE If we note that there are 10 values, so the 70th percentile can be found with the following calculation: This tells us that we need to find the 7th ordered value. The 7th value is 84. CONCEPT Percentiles 22 A fast-food restaurant gave a “Customer Satisfaction Survey” in which 1500 customers rated how satisfied they were with service. The results are shown below as a table. Rating Frequency Extremely Satisfied 234 Satisfied 443 Neutral 246 Dissatisfied 203 Extremely Dissatisfied 374 The relative frequency of people who were dissatisfied with the service is __________. • 29.5% • 13.5% • 38.5% • 20.3% RATIONALE To get the relative frequency, we take the frequency of the value and divide it by the total number. So in this case for strongly dissatisfied, the relative frequency would be: CONCEPT Frequency Tables 23 One week, Rachel earned $250. She spent $120 on food, $30 on miscellaneous items, and saved the rest. If Rachel makes a pie chart showing how she spends her money, the central angle for the food sector would be __________. • 144° • 187° • 90° • 173° RATIONALE Recall that to get the angle for something in a pie chart we use the following formula: So in this case, the central angle for the food sector would be: CONCEPT Bar Graphs and Pie Charts 24 Dave drives to work. While driving the car over nine days, he observes his daily average speed and lists it in the table below. Day Average Speed (MPH) 1 45 2 62 3 44 4 70 5 59 6 66 7 54 8 63 9 67 The median speed at which Dave drove to work was __________. • 59 miles per hour • 63 miles per hour • 62 miles per hour • 58.89 miles per hour RATIONALE To get the median we first order the data and take the middle value. The ordered values are: Since there are an odd number (n=9) of values we simply take the middle, which is 62 mph. CONCEPT Mean, Median, and Mode 25 Which of the following statements about a normal distribution is true? • A large portion of the data is located near the tails. • A large portion of the data is skewed to the right. • The normal distribution is an example of a bimodal distribution. • The normal distribution is single-peaked and symmetric. RATIONALE A normal distribution is a bell-shaped and symmetric distribution. So it has a single smooth peak, which tells us the mean and median are the same. CONCEPT Normal Distribution 26 Let x stand for the percentage of an individual student's math test score. 64 students were sampled at a time. The population mean is 78 percent and the population standard deviation is 14 percent. What is the standard deviation of the sampling distribution of sample means? • 0.22 • 1.75 • 64 • 14 RATIONALE The standard deviation of the sampling distribution, , is equal to the standard deviation of the original population, , divided by the square root of the sample size, . If the standard deviation of the population is 14 and the sample size is 64, then the standard deviation of the sampling distribution is: CONCEPT Center and Variation of a Sampling Distribution [Show More]
Last updated: 1 year ago
Preview 1 out of 23 pages
 – University of the People.png)
Reviews( 0 )
Document information
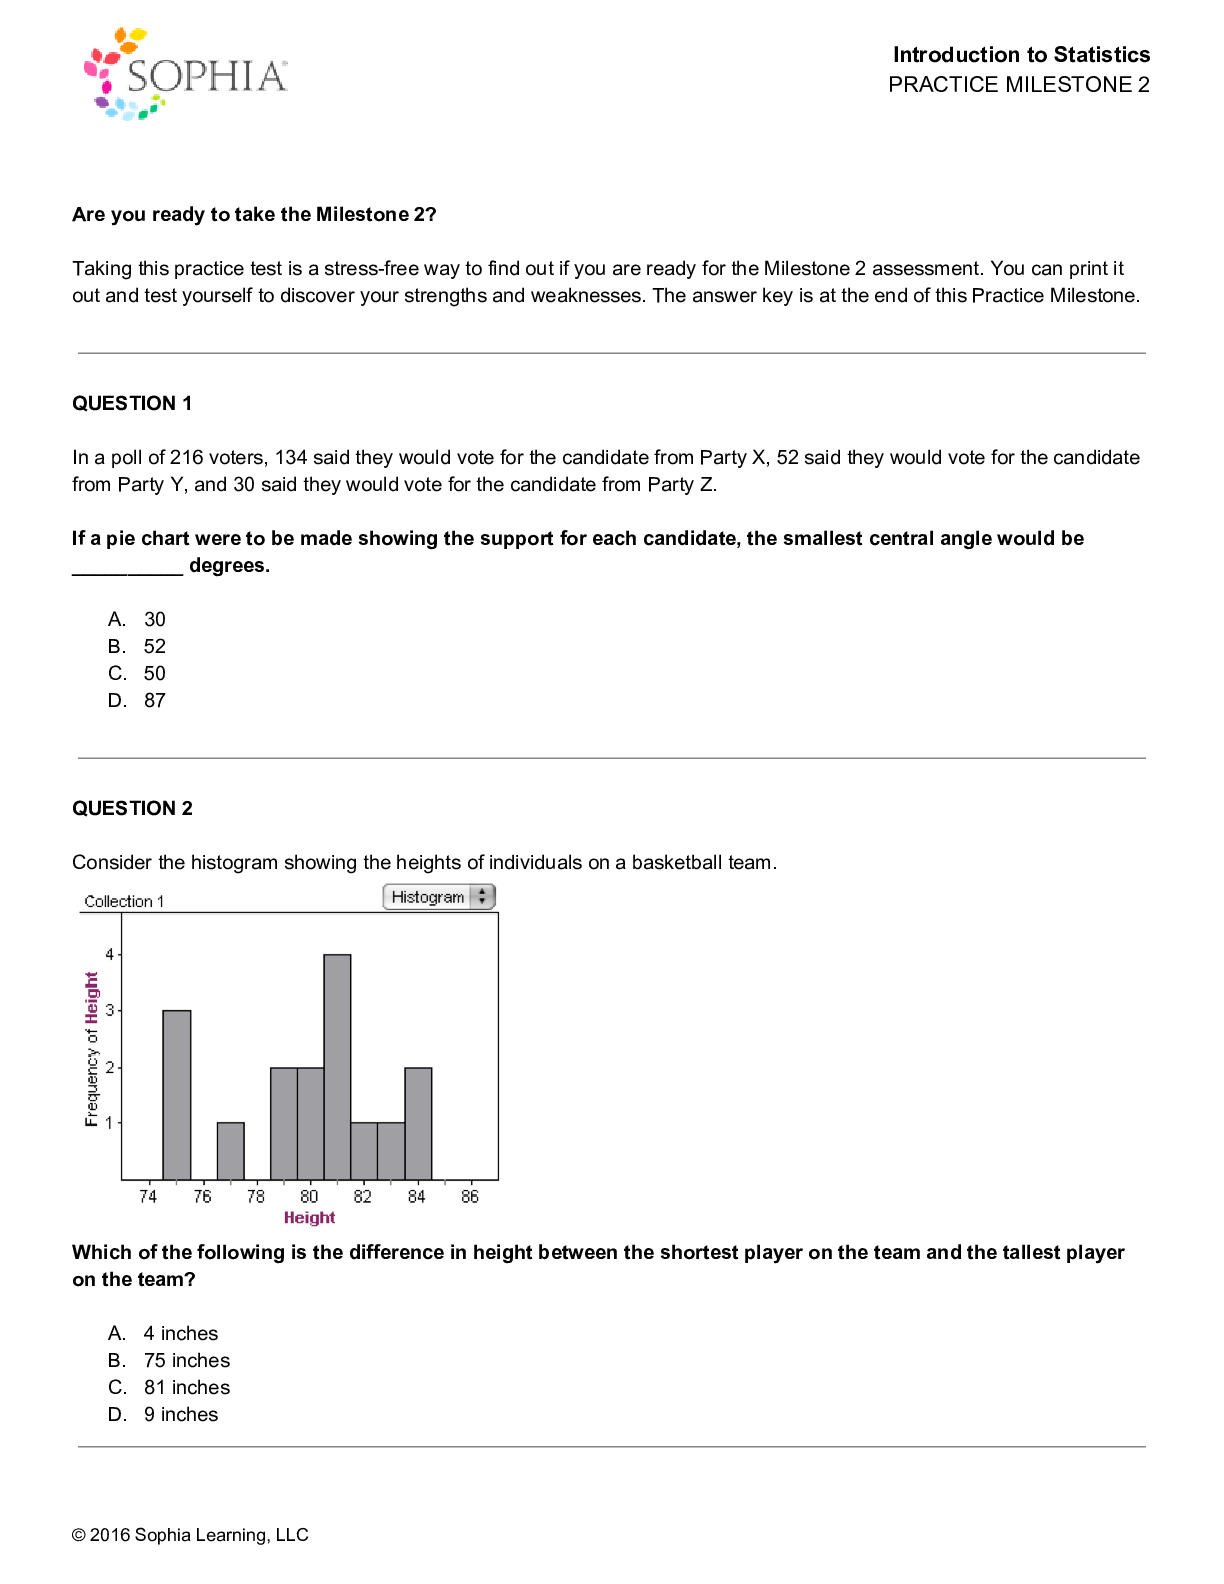
Connected school, study & course
About the document
Uploaded On
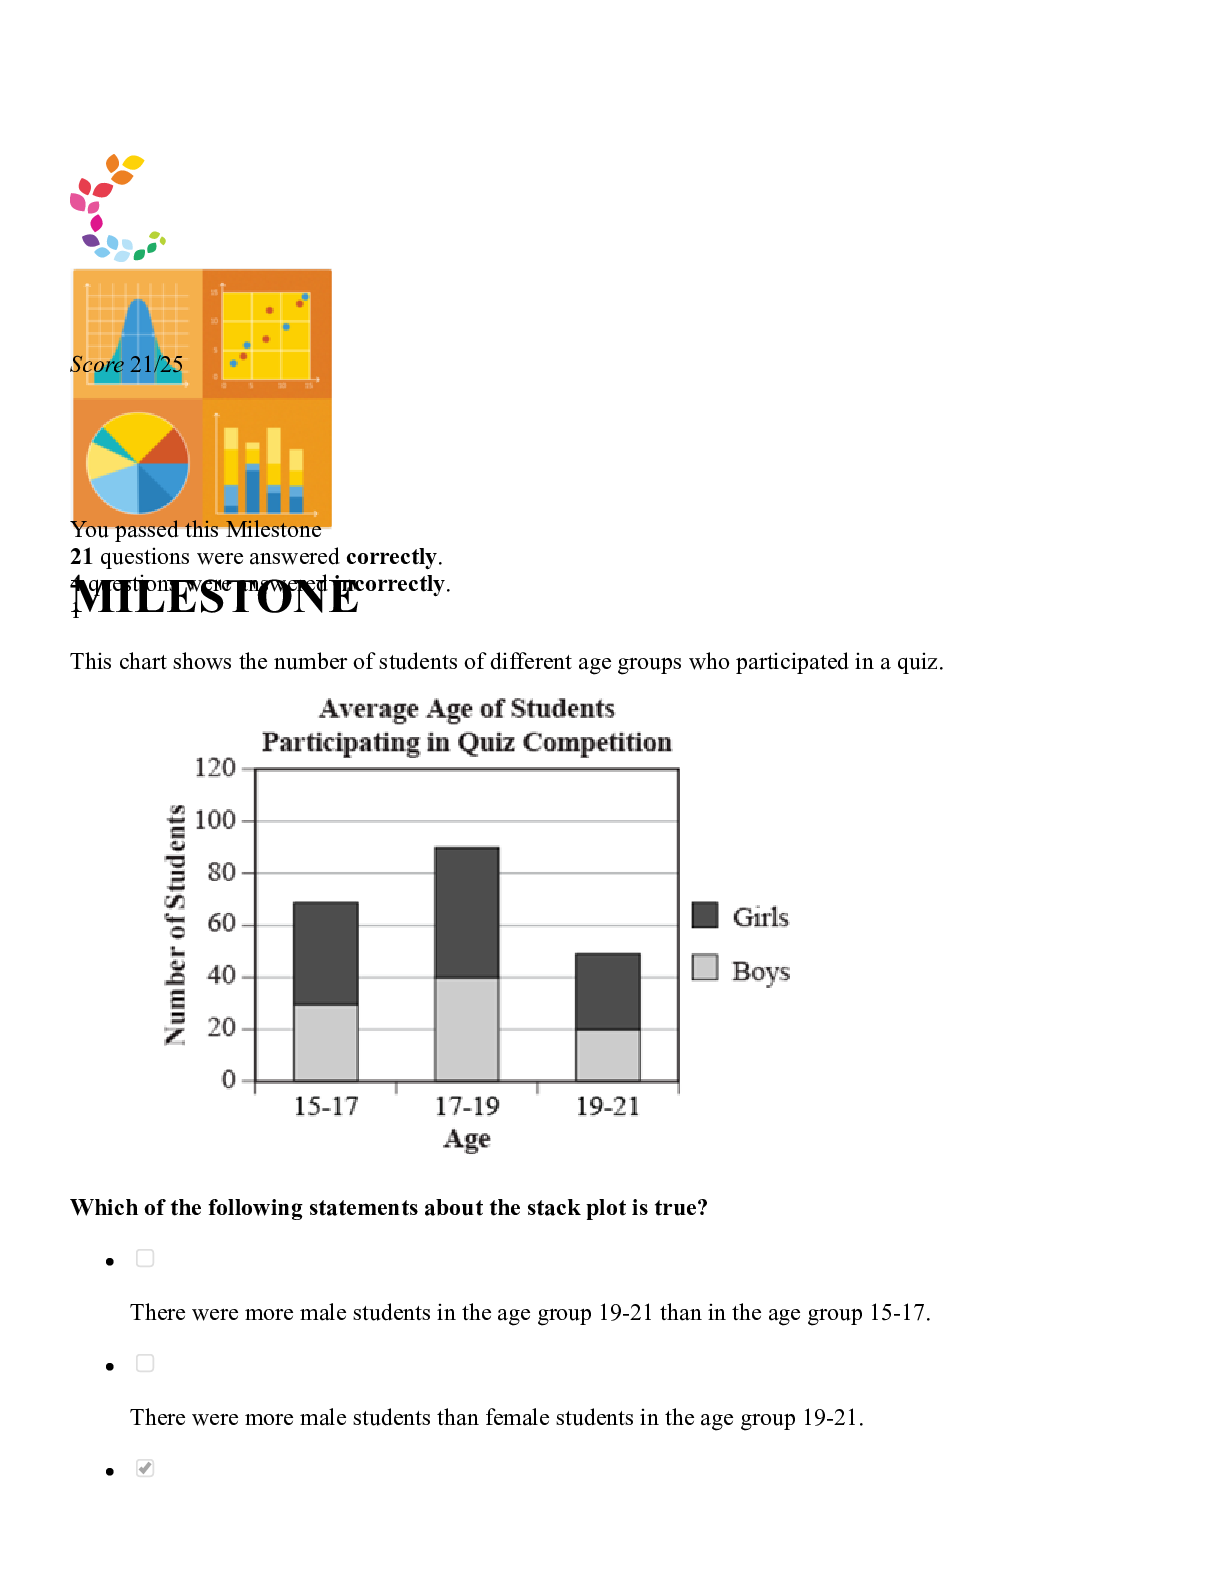
Sep 14, 2020
Number of pages
23
Written in

Additional information
This document has been written for:
Uploaded
Sep 14, 2020
Downloads
0
Views
77

 – University of the People.png)

 – University of Maryland.png)
 – University of the People.png)
 – University of the People.png)
 – University of the People.png)
 – University of the people.png)
.png)