Statistics > SOPHIA Milestone > SOPHIA STATISTICS UNIT 4 MILESTONE 4 (All)
SOPHIA STATISTICS UNIT 4 MILESTONE 4
Document Content and Description Below
SOPHIA_UNIT_4_STATISTICS_MILESTONE_2020 - University of Alabama SOPHIA_UNIT_4_STATISTICS_MILESTONE_2020 UNIT 4 — MILESTONE 4 Score 17/18 You passed this Milestone 17 questions were answered cor... rectly. 1 question was answered incorrectly. 1 This scatterplot shows the maintenance expense for a truck based on its years of service. The equation for least regression line to this data set is ŷ = 76.82x + 88.56. What is the predicted value (in dollars) for maintenance expenses when a truck is 7 years old? $626 $703 $473 $549 RATIONALE In order to get the predicted maintenance expense when the age of the truck is 7 years, we simply substitute the value 7 in our equation for x. So we can note that: CONCEPT Predictions from Best-Fit Lines 2 The scores of the quizzes of five students in both English and Science are: English Science Student 1 6 8 Student 2 5 5 Student 3 9 6 Student 4 4 7 Student 5 8 9 For English, the mean is 6.4 and the standard deviation is 2.0. For Science, the mean is 7 and the standard deviation is 1.6. Using the formula below or Excel, find the correlation coefficient, r, for this set of scores. Answer choices are rounded to the nearest hundredth. 0.50 0.42 0.05 0.23 RATIONALE In order to get the correlation, we can use the formula: Correlation can be quickly calculated by using Excel. Enter the values and use the function "=CORREL(". CONCEPT Correlation 3 For the plot below the value of r2 is 0.7783. Which of the following sets of statements is true? https://www.coursehero.com/file/64074421/SOPHIA-UNIT-4-STAT-MILESTONEpdf/ About 22% of the variation in ticket price can be explained by the distance flown. This study resource was shared via CourseHero.comThe correlation coefficient, r, is 0.606. About 78% of the variation in ticket price can be explained by the distance flown. The correlation coefficient, r, is 0.882. About 88% of the variation in ticket price can be explained by the distance flown. The correlation coefficient, r, is 0.882. About 78% of the variation in distance flown can be explained by the ticket price. The correlation coefficient, r, is 0.606. RATIONALE The coefficient of determination measures the percent of variation in the outcome, y, explained by the regression. So a value of 0.7783 tells us the regression with distance, x, can explain about 77.8% of the variation in cost, y. We can also note that r = . CONCEPT Coefficient of Determination/r^2 4 Which statement accurately describes the data's form, direction, and strength from the scatterplot below? Form: Linear Direction: Positive Strength: Weak Form: Linear Direction: Negative Strength: Weak Form: Linear Direction: Positive Strength: Moderate Form: Linear Direction: Negative Strength: Moderate RATIONALE If we look at the data, it looks as if a straight line captures the relationship, so the form is linear. The slope of the line is positive, so it is increasing. Finally, even though the direction is clear, the data points are less clustered in a line or curve, so the strength is moderate. CONCEPT Describing Scatterplots 5 The scatterplot below charts the performance of an electric motor. Which answer choice correctly indicates the explanatory variable and the response variable of the scatterplot? Explanatory variable: Voltage Response variable: Electric motor Explanatory variable: Rotation Response variable: Voltage Explanatory variable: Voltage Response variable: Rotation Explanatory variable: Rotation Response variable: Electric motor RATIONALE The explanatory variable is what is along the horizontal axis, which is voltage. The response variable is along the vertical axis, which is speed of rotation. CONCEPT Explanatory and Response Variables 6 Jesse takes two data points from the weight and feed cost data set to calculate a slope, or average rate of change. A rat weighs 3.5 pounds and costs $4.50 per week to feed, while a Beagle weighs 30 pounds and costs $9.20 per week to feed. Using weight as the explanatory variable, what is the slope of the line between these two points? Answer choices are rounded to the nearest hundredth. $0.18 / lb. $1.60 / lb. $0.31 / lb. $5.64 / lb. RA https://www.coursehero.com/file/64074421/SOPHIA-UNIT-4-STAT-MILESTONEpdf/ TIONALE This study resource was shared via CourseHero.comIn order to get slope, we can use the formula: s l o p e equals fraction numerator y 2 minus y 1 over denominator x 2 minus x 1 end fraction. Using the information provided, the two points are: (3.5 lb., $4.50) and (30 lb., $9.20). We can note that: CONCEPT Linear Equation Algebra Review 7 Which of the following scatterplots shows an outlier in the x-direction? RATIONALE To have an outlier in the x-direction the outlier must be in the range of y data but outside the range of x-data. CONCEPT Outliers and Influential Points 8 Data for length of the tail (in millimeters) and age (in days) of tadpoles is entered into a statistics software package and results in a regression equation of ŷ = 15 - 1.5x. What is the correct interpretation of the slope if the length of the tail is the response variable and the age is the explanatory variable? The length of the tail increases by 15 millimeters, on average, when the tadpole's age increases by 1 day. The length of the tail decreases by 15 millimeters, on average, when the tadpole's age increases by 1 day. The length of the tail increases by 1.5 millimeters, on average, when the tadpole's age increases by 1 day. The length of the tail decreases by 1.5 millimeters, on average, when the tadpole's age increases by 1 day. RATIONALE When interpreting the linear slope we generally substitute in a value of 1. So we can note that, in general, as x increases by 1 unit the slope tells us how the outcome changes. So for this equation we can note as x (age) increases by 1 day, the outcome (length) will decrease by 1.5 millimeters on average. CONCEPT Interpreting Intercept and Slope 9 A correlation coefficient between average temperature and ice cream sales is most likely to be __________. between 1 and 2 between 0 and –1 between 0 and 1 between –1 and –2 RATIONALE In general as temperature increases, tastes for ice cream goes up. So the correlation should be positive, which would be between 0 and 1. CONCEPT Positive and Negative Correlations 10 Brad reads a scatterplot that displays the relationship between the number of cars owned per household and the average number of citizens who have health insurance in neighborhoods across the country. The plot shows a strong positive correlation. Brad recalls that correlation does not imply causation. In this example, Brad sees that increasing the number of cars per household would not cause members of his community to purchase health insurance. Identify the lurking variable that is causing an increase in both the number of cars owned and the average number of citizens with health insurance. Average annual salary per household The number of citizens in the United States who do not have health insurance The number of different car brands Average health insurance costs in the United States RATIONALE Recall that a lurking variable is something that must be related to the outcome and explanatory variable that when considered can help explain a relationship between 2 variables. Since higher income is positively related to owning more cars and having health insurance, this variable would help explain why we see this association. CONCEPT Correlation and Causation 11 Shawna finds a study of American women that had an equation to predict weight (in pounds) from height (in inches): ŷ = -260 + 6.6x. Shawna’ https://www.coursehero.com/file/64074421/SOPHIA-UNIT-4-STAT-MILESTONEpdf/ s height was 64 inches and her weight was 150 pounds. This study resource was shared via CourseHero.comWhat is the value of the residual for Shawna's weight and height? 730 pounds -12.4 pounds 162.4 pounds 12.4 pounds RATIONALE Recall that to get the residual, we take the actual value - predicted value. So if the actual height of 64 inches and the resulting actual weight is 150 pounds, we simply need the predicted weight. Using the regression line, we can say: The predicted weight is 164.4 pounds. So the residual is: CONCEPT Residuals 12 Peter analyzed a set of data with explanatory and response variables x and y. He concluded the mean and standard deviation for x as 7.8 and 3.70, respectively. He also concluded the mean and standard deviation for y as 12.2 and 4.15, respectively. The correlation was found to be 0.964. Select the correct slope and y-intercept for the least-squares line. Answer choices are rounded to the hundredths place. Slope = 1.08 y-intercept = -3.78 Slope = -1.08 y-intercept = -3.78 Slope = 1.08 y-intercept = 3.78 Slope = -1.08 y-intercept = 3.78 RATIONALE We first want to get the slope. We can use the formula: To then get the intercept, we can solve for the y-intercept by using the following formula: y with hat on top equals b subscript 0 plus b subscript 1 x We know the slope, b subscript 1, and we can use the mean of x and the mean of y for the variables x and y with hat on top to solve for the y-intercept, b subscript 0. CONCEPT Finding the Least-Squares Line 13 Which of the following scatterplots shows a correlation affected by inappropriate grouping? RATIONALE Since this data has 4 distinct groups, by examining overall correlation by all the data, it will not capture how the data in each group is associated. So overall the correlation might not be very strong, but if we look at correlation inside each group, there would be a much stronger relationship. CONCEPT Cautions about Correlation 14 John, the owner of an ice-cream parlor, collects data for the daily sales of ice cream with respect to the daily temperature. If John were to create a scatterplot, all of the following will be characteristics of correlation EXCEPT ___________. https://www.coursehero.com/file/64074421/SOPHIA-UNIT-4-STAT-MILESTONEpdf/ This study resource was shared via CourseHero.comDegree of association between the daily sales and temperature Amount of daily sales at any given temperature Direction of association between the daily sales and temperature Strength of association between the daily sales and temperature RATIONALE If we recall that correlation gives us a sense of the strength and direction of a linear association, it doesn't say exactly how much x is related to y. We don't use it to make prediction. This is what a regression line can be used for. CONCEPT Correlation 15 Which of the following statements is TRUE? Only a correlation of 0 implies causation. High correlation always implies causation. High correlation does not always imply causation. Only a correlation of 1 implies causation. RATIONALE Recall that correlation doesn't imply causation. Causation is a direct change in one variable causing a change in some outcome. Correlation is simply a measure of association. It is required for causation, but alone does not mean something is causal. CONCEPT Correlation and Causation 16 A bank manager declares, with help of a scatterplot, that the number of health insurances sold may have some association with the number of inches it snows. How many policies were sold when it snowed 2 to 4 inches? 240 470 350 210 RATIONALE In order to find the total number of policies between 2 and 4 inches, we must add the three values of 10 in that interval. At 2 inches, there were 100 policies. At 3 inches, there were 110 policies. At 4 inches, there were 140 policies. So the total is 100 + 110 + 140 = 350 policies. CONCEPT Scatterplot 17 Thomas was interested in learning more about the salary of a teacher. He believed as a teacher increases in age, the annual earnings also increases. The age (in years) is plotted against the earnings (in dollars) as shown below. Using the best-fit line, approximately how much money would a 45-year-old teacher make? $58,000 $55,000 $48,000 $50,000 RATIONALE To get a rough estimate of the salary of a 45 year-old, we go to the value of 45 on the horizontal axis and then see where it falls on the best-fit line. This looks to be about $50,000. CONCEPT Best-Fit Line and Regression Line 18 Which of the following is a guideline for establishing causality? Do not consider other possible causes. The experiment performed should be controlled and randomized. Check if the effect is present or absent when the response variable is present or absent. Look for cases where correlation does not exist between the variables. RA https://www.coursehero.com/file/64074421/SOPHIA-UNIT-4-STAT-MILESTONEpdf/ TIONALE This study resource was shared via CourseHero.comFinding an association inside an experimental design controls for many other outside influences and helps to ensure that an explanatory variable always precedes the response. This helps to support, with strong confidence, that the association is causal. CONCEPT Establishing Causality © 2020 SOPHIA Learning, LLC. SOPHIA is a registered trademark of SOPHIA Learning, LLC. About Contact Us Privacy Policy Terms of Use https://www.coursehero.com/file/64074421/SOPHIA-UNIT-4-STAT-MILESTONEpdf/ This study resource was shared via CourseHero.com Powered by TCPDF (www.tcpdf.org) [Show More]
Last updated: 8 months ago
Preview 1 out of 6 pages

Reviews( 4 )

by anitra mcknight · 3 years ago
Many thanks for the rating by Martin Freeman. 3 years ago
Thanks for the review. all the best in your studies by Martin Freeman. 3 years ago
Thanks by Martin Freeman. 3 years ago
by Martin Freeman · 3 years ago
Many thanks for the rating
by Martin Freeman · 3 years ago
Thanks for the review. all the best in your studies
by Martin Freeman · 3 years ago
Thanks
Recommended For You
Statistics> SOPHIA Milestone > SOPHIA Statistics Unit 4 Milestone. Questions/Answers & Rationale (All)
SOPHIA Statistics Unit 4 Milestone. Questions/Answers & Rationale
Sophia Statistics Unit 4 Milestone. Questions/Answers & Rationale
By Expert1 , Uploaded: Jul 30, 2020
$9.5
Financial Accounting> SOPHIA Milestone > ACC 100_Unit 4 Milestone 4. SOPHIA ACCOUNTING Unit 4 Milestone 4. 100% Score. (All)
ACC 100_Unit 4 Milestone 4. SOPHIA ACCOUNTING Unit 4 Milestone 4. 100% Score.
ACC100: Unit 4 Milestone 4 With Answers You passed this Milestone 1 Unearned revenue is a(n) __________ account and carries a normal __________ balance. • liability; credit • revenue; credit...
By QuizMaster , Uploaded: Aug 12, 2020
$10.5
Information Technology> SOPHIA Milestone > IT 100 Intro to IT Sophia UNIT 4 Milestone 4. Score 15/15 (All)
IT 100 Intro to IT Sophia UNIT 4 Milestone 4. Score 15/15
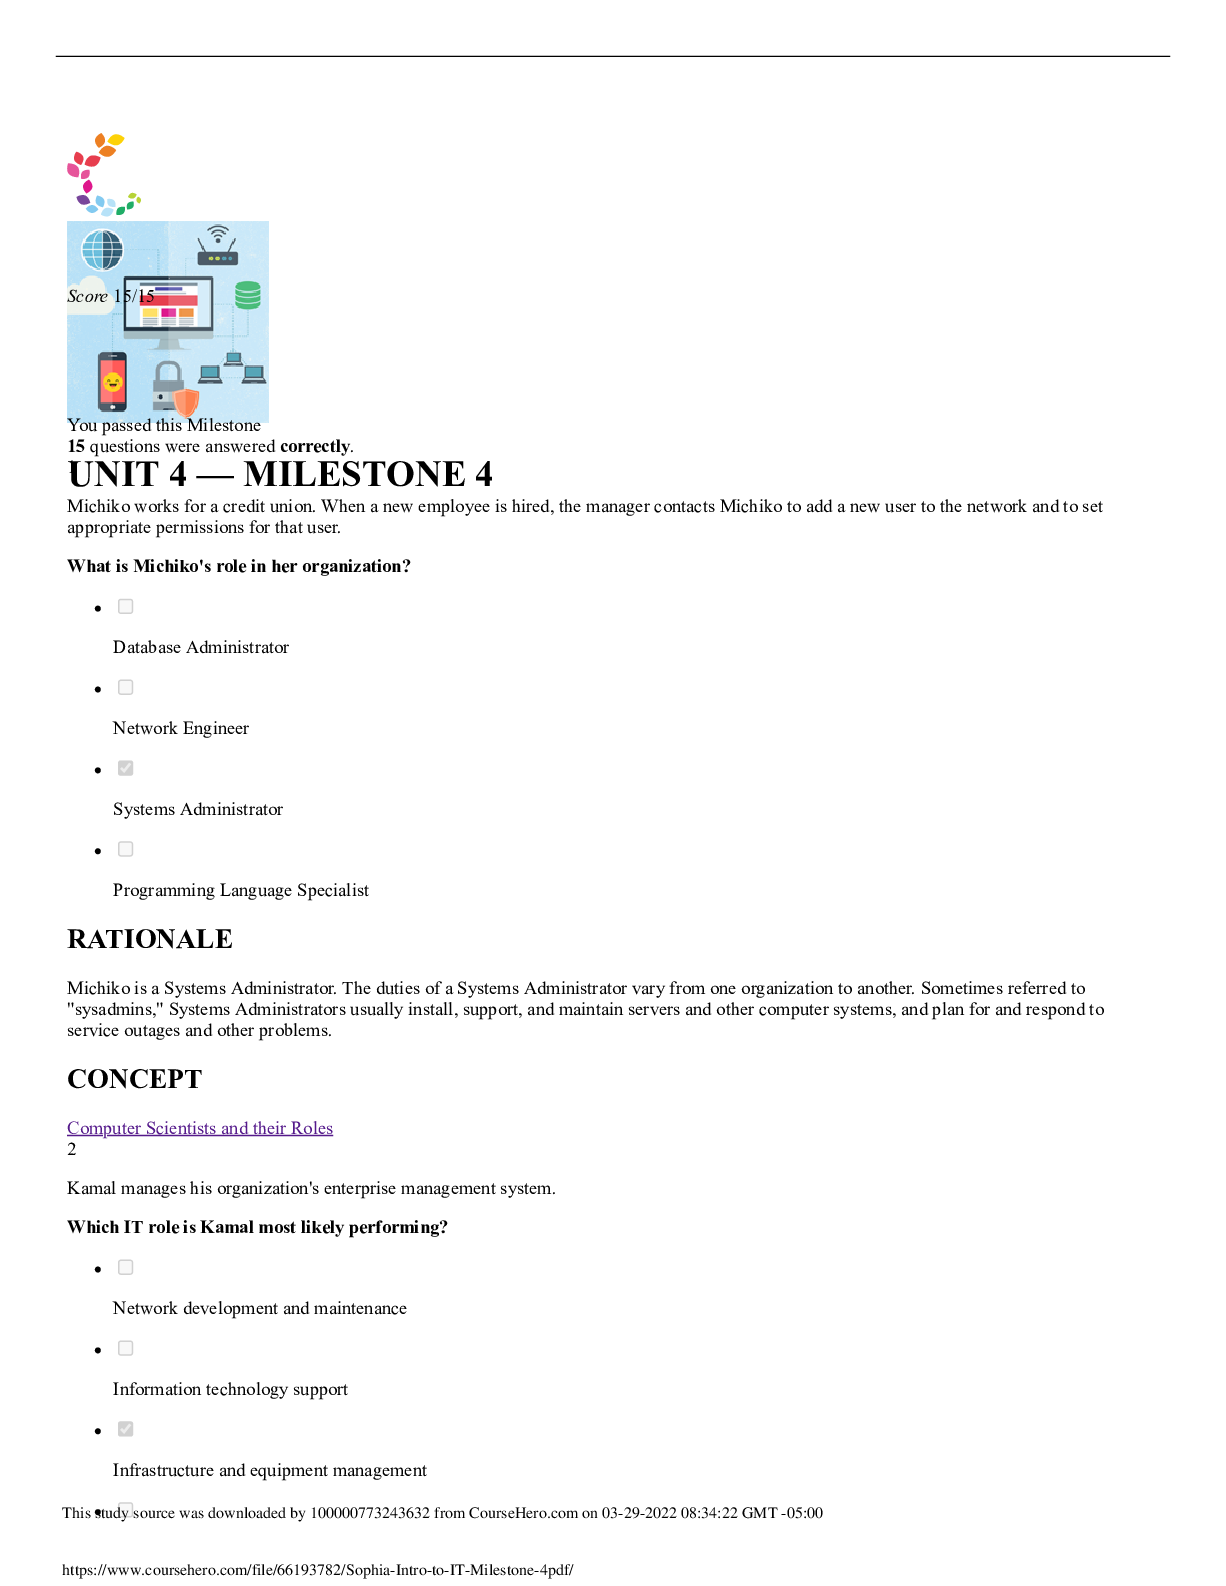
UNIT 4 — MILESTONE 4 Score 15/15 15 questions were answered correctly. 1 Michiko works for a credit union. When a new employee is hired, the manager contacts Michiko to add a new user to the netwo...
By Expert1 , Uploaded: Aug 14, 2020
$10.5
*NURSING> SOPHIA Milestone > Sophia - Environmental Science - Unit 4 Milestone 4,100% CORRECT (All)
Sophia - Environmental Science - Unit 4 Milestone 4,100% CORRECT
Sophia - Environmental Science - Unit 4 Milestone 4
By Nolan19 , Uploaded: Jan 05, 2022
$15
Statistics> SOPHIA Milestone > Sophia Statistics Unit 4 Milestone, questions/Answers/Rationale, Latest Summer 2020 (All)

Sophia Statistics Unit 4 Milestone, questions/Answers/Rationale, Latest Summer 2020
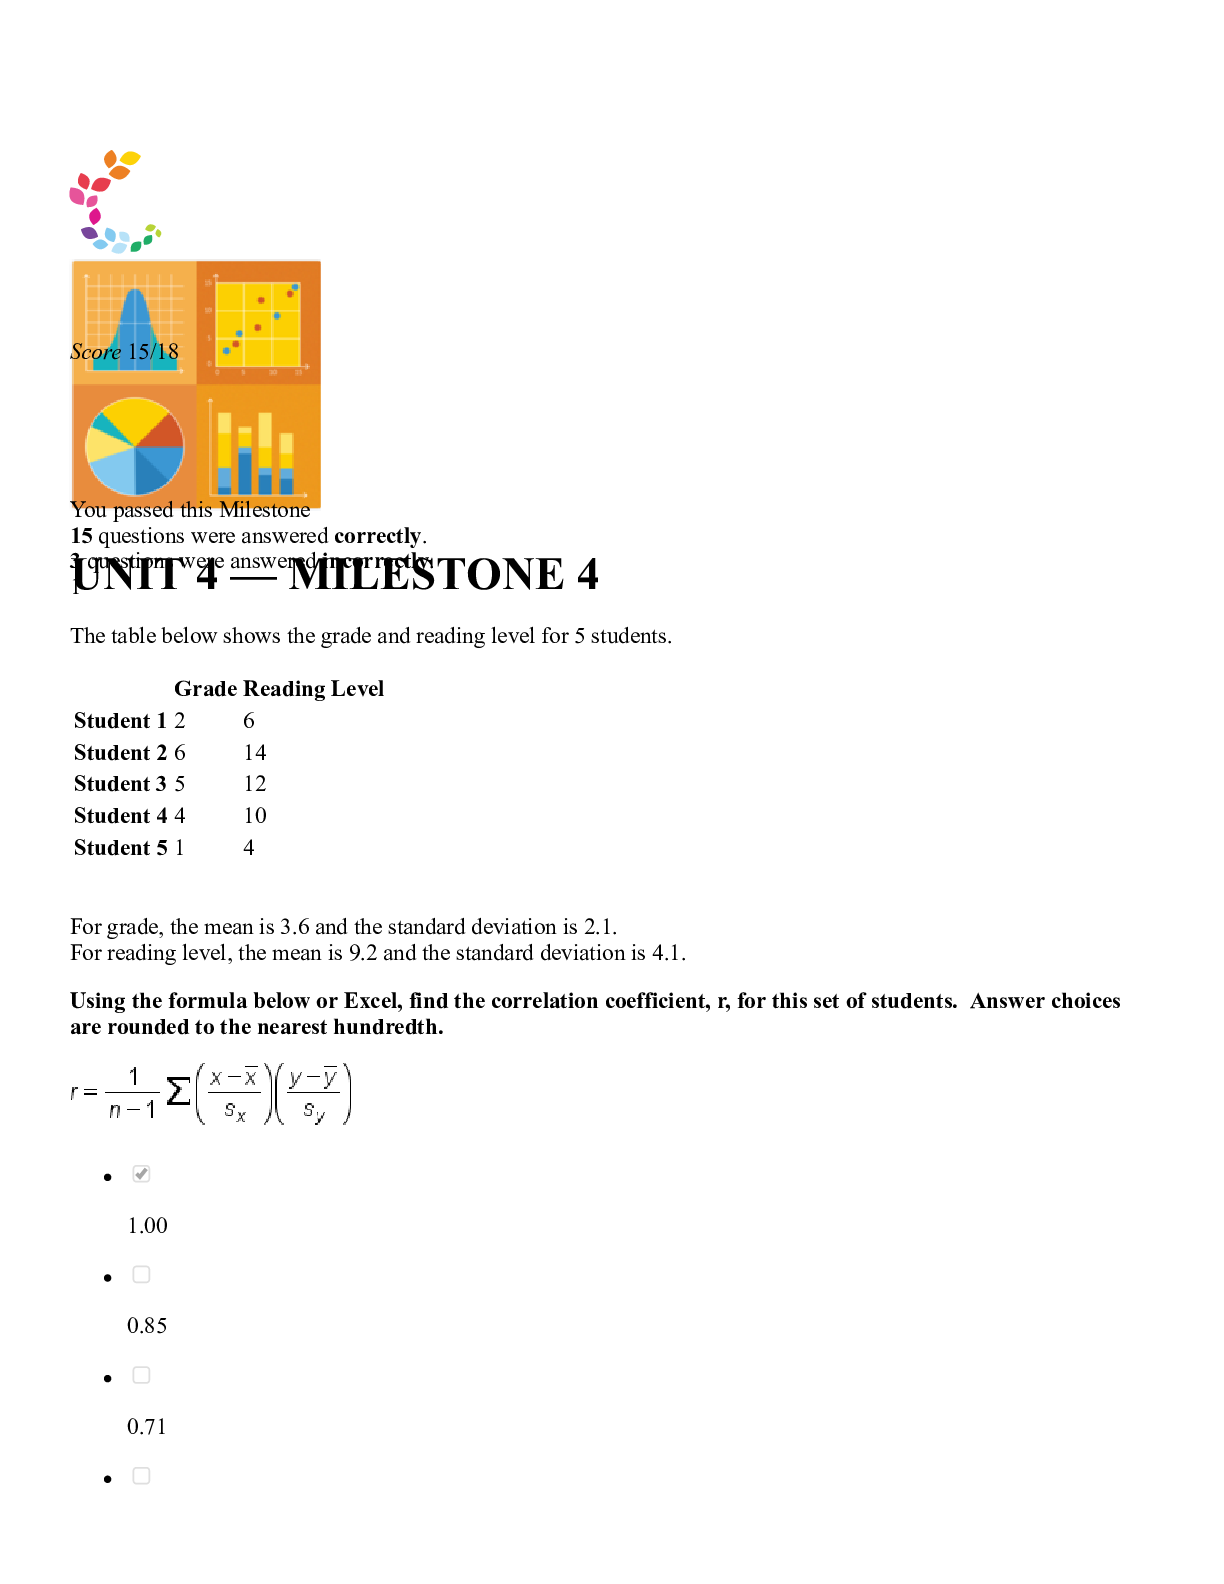
The table below shows the grade and reading level for 5 students. Grade Reading Level Student 1 2 6 Student 2 6 14 Student 3 5 12 Student 4 4 10 Student 5 1 4 For grade, the mean is 3.6 and the...
By Book Worm, Certified , Uploaded: Jun 12, 2022
$12
*NURSING> SOPHIA Milestone > Sophia Conflict Resolution Unit 4 Milestone 4 (All)
Sophia Conflict Resolution Unit 4 Milestone 4
Sophia Conflict Resolution Unit 4 Milestone 4
By Ellen Ronald , Uploaded: Jun 11, 2022
$12
Economics> SOPHIA Milestone > FINC 306 Sophia __ Microeconomics Unit 4 Milestone 4. Score 17/20. Passed this Milestone. (All)

FINC 306 Sophia __ Microeconomics Unit 4 Milestone 4. Score 17/20. Passed this Milestone.
UNIT 4 — MILESTONE 4 Score 17/20 You passed this Milestone 17 questions were answered correctly. 3 questions were answered incorrectly. 1 Which of the following always occurs when a tax is impos...
By Kirsch , Uploaded: Jan 29, 2021
$10
Environmental Science> SOPHIA Milestone > Sophia - Environmental Science - Unit 4 Milestone 4.docx. QUESTIONS WITH ANSWERRS. RATED A+ (All)
Sophia - Environmental Science - Unit 4 Milestone 4.docx. QUESTIONS WITH ANSWERRS. RATED A+
Choose the statement about renewable and nonrenewable energy sources that is NOT true. There has been little to no recent growth in renewable energy use due to a lack of environmental concerns wi...
By A grade master , Uploaded: Mar 31, 2022
$8
Environmental Science> SOPHIA Milestone > Unit 4 Milestone 4 with answers.docx. questions with accurate answers. GRADED A+ (All)
Unit 4 Milestone 4 with answers.docx. questions with accurate answers. GRADED A+
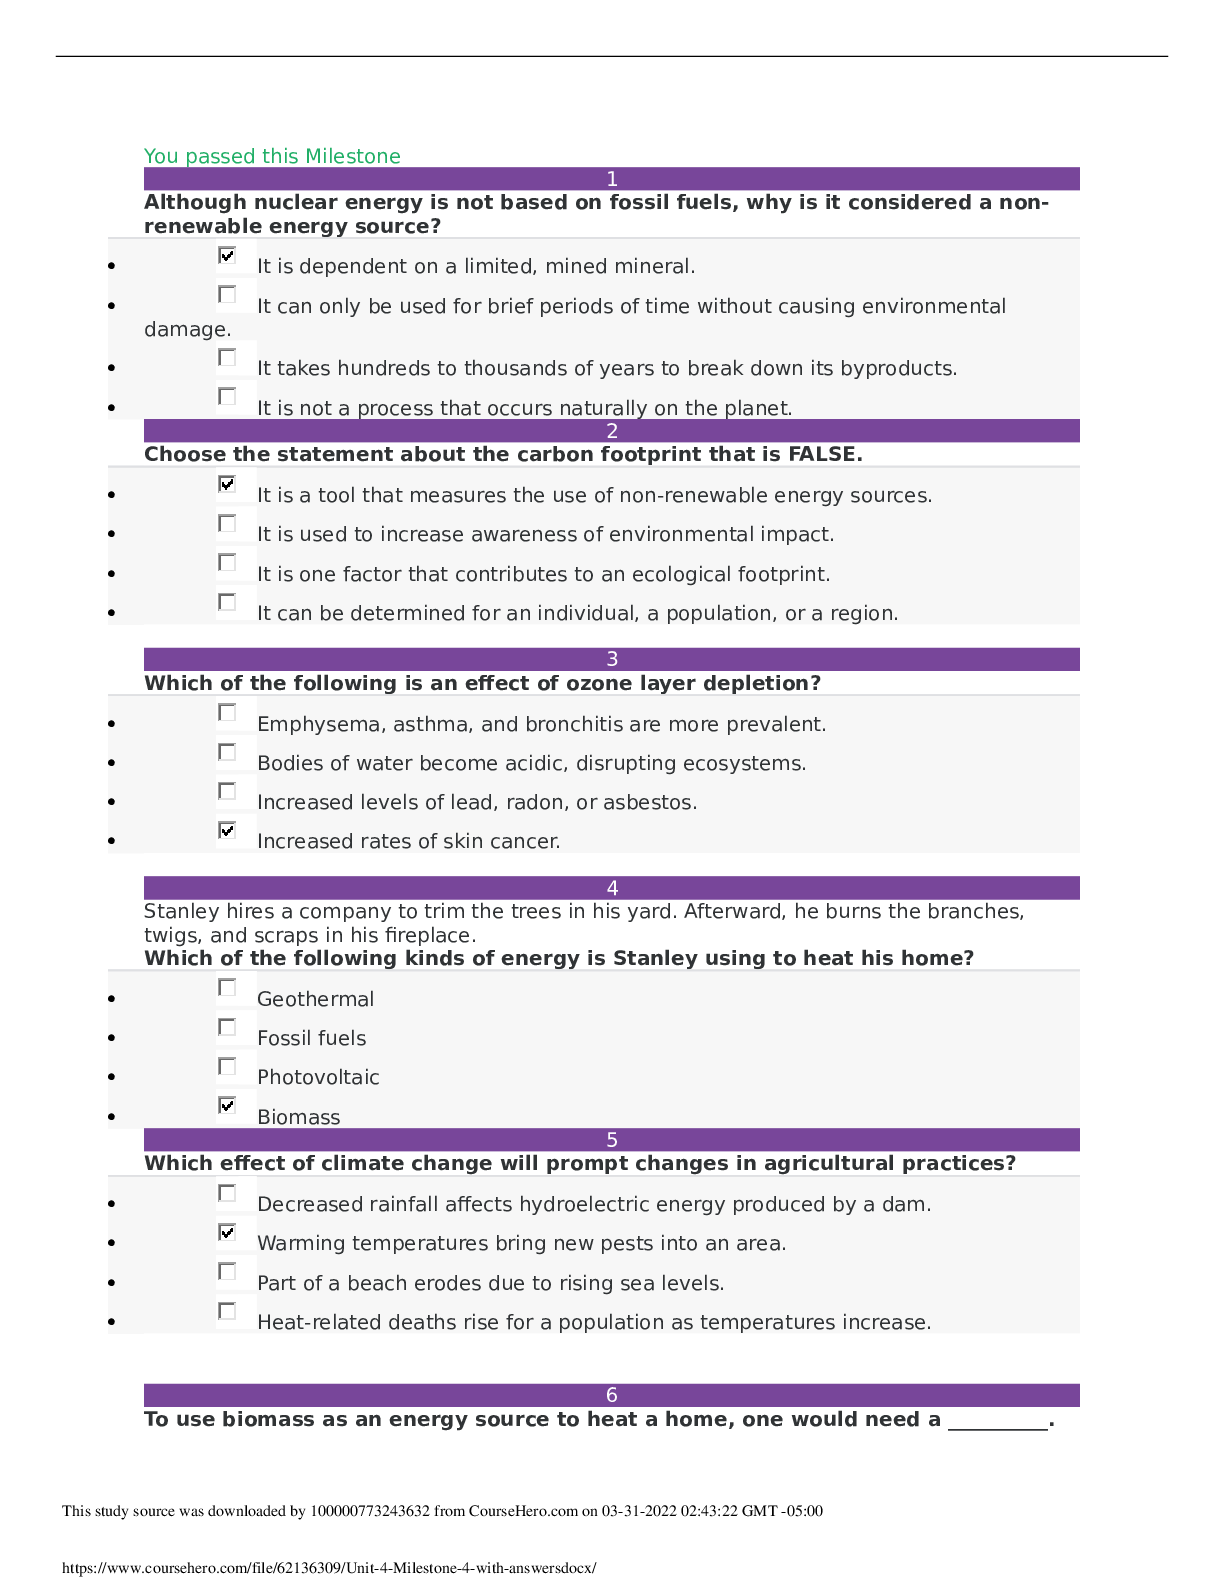
Although nuclear energy is not based on fossil fuels, why is it considered a nonrenewable energy source? It is dependent on a limited, mined mineral. It can only be used for brief periods of tim...
By A grade master , Uploaded: Mar 31, 2022
$8
Statistics> SOPHIA Milestone > Sophia __ Intro to Stats Unit 4 Milestone 4.pdf. Questions with accurate answers. RATED A+ (All)

Sophia __ Intro to Stats Unit 4 Milestone 4.pdf. Questions with accurate answers. RATED A+
16 questions were answered correctly. 2 questions were answered incorrectly. 1 For ten students, a teacher records the following scores of two assessments, Quiz 1 and Test. Quiz 1 (x) Test (y) 15...
By A grade master , Uploaded: Mar 30, 2022
$7
Document information
Connected school, study & course
About the document
Uploaded On
Sep 15, 2020
Number of pages
6
Written in

Additional information
This document has been written for:
Uploaded
Sep 15, 2020
Downloads
1
Views
250