Statistics > SOPHIA Milestone > Sophia Statistics Unit 4 Milestone, questions/Answers/Rationale, Latest Summer 2020 (All)
Sophia Statistics Unit 4 Milestone, questions/Answers/Rationale, Latest Summer 2020
Document Content and Description Below
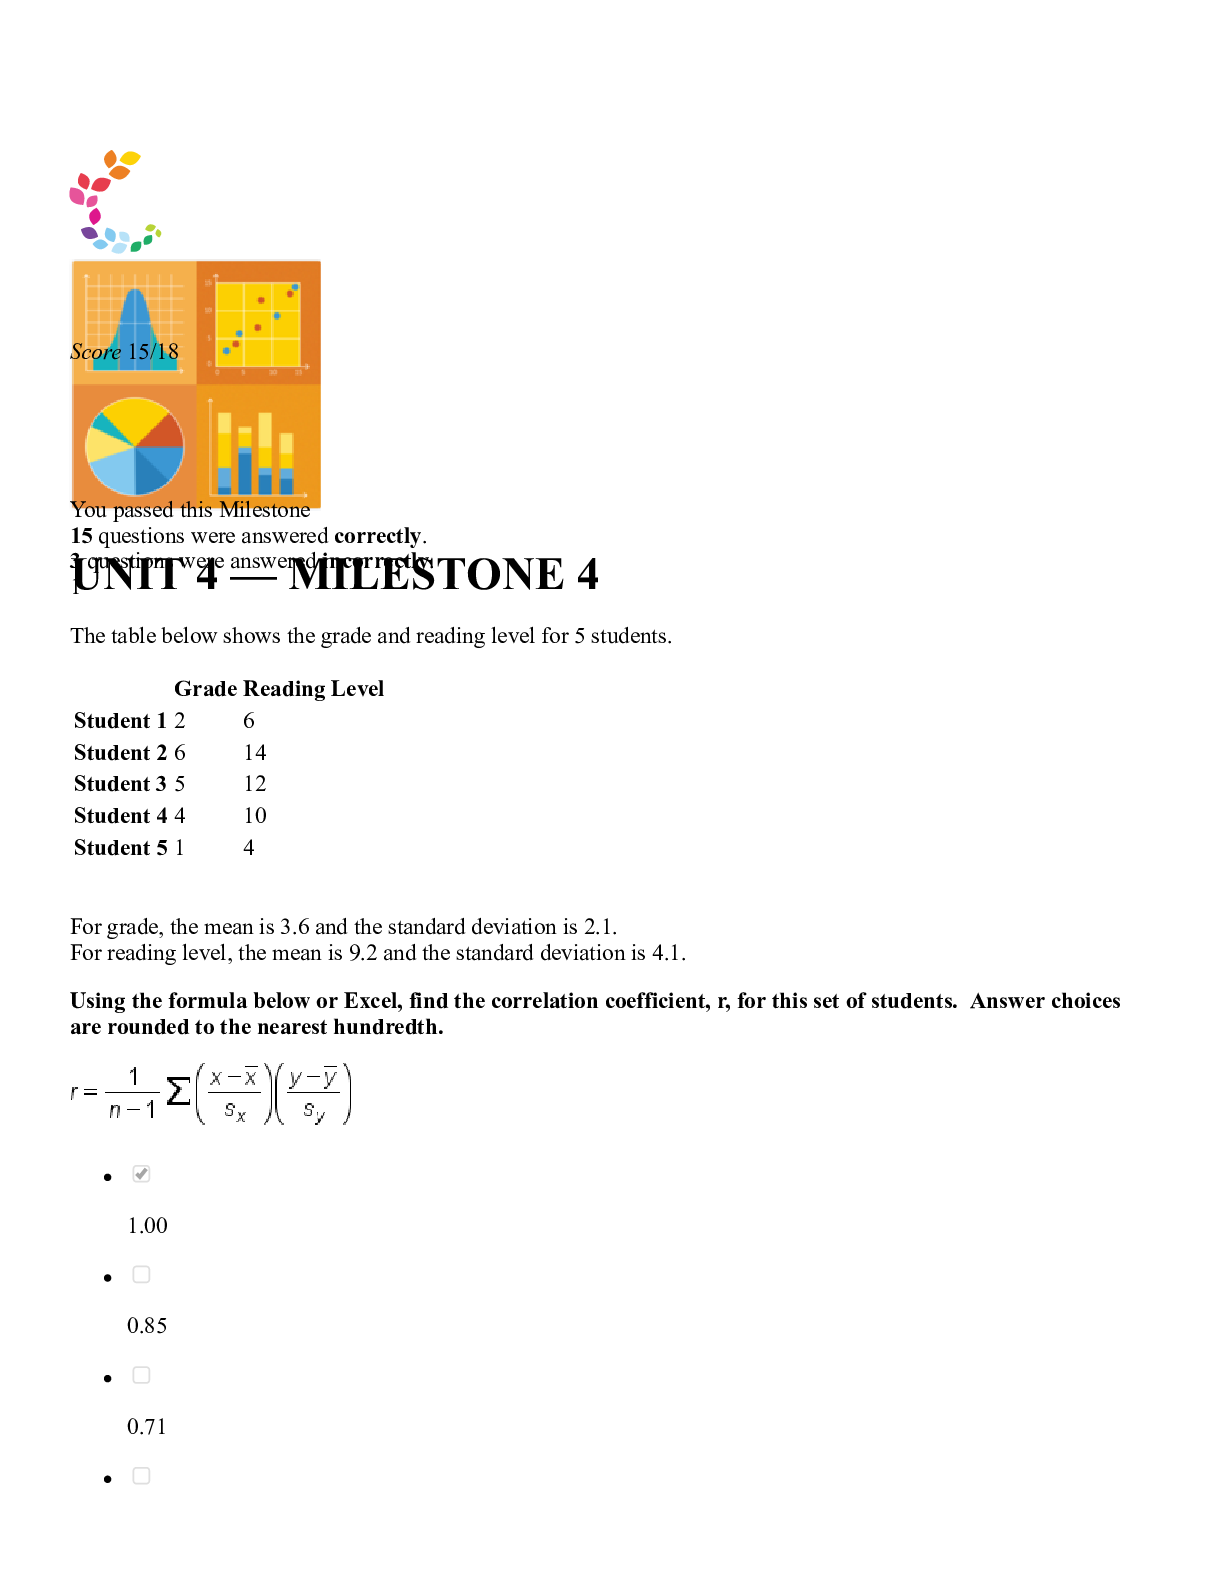
The table below shows the grade and reading level for 5 students. Grade Reading Level Student 1 2 6 Student 2 6 14 Student 3 5 12 Student 4 4 10 Student 5 1 4 For grade, the mean is 3.6 and the... standard deviation is 2.1. For reading level, the mean is 9.2 and the standard deviation is 4.1. Using the formula below or Excel, find the correlation coefficient, r, for this set of students. Answer choices are rounded to the nearest hundredth. 1.00 0.85 0.71 0.92 RATIONALE In order to get the correlation, we can use the formula: Correlation can be quickly calculated by using Excel. Enter the values and use the function "=CORREL(". CONCEPT Correlation I need help with this question 2 This scatterplot shows the maintenance expense for a truck based on its years of service. The equation for least regression line to this data set is ŷ = 76.82x + 88.56. What is the predicted value (in dollars) for maintenance expenses when a truck is 7 years old? $549 $473 $626 $703 RATIONALE In order to get the predicted maintenance expense when the age of the truck is 7 years, we simply substitute the value 7 in our equation for x. So we can note that: CONCEPT Predictions from Best-Fit Lines I need help with this question 3 Raoul lives in Minneapolis and he is planning his spring break trip. He creates the scatterplot below to assess how much his trip will cost. Which answer choice correctly indicates the explanatory and response variables for the scatterplot? Explanatory variable: Distance Response variable: Cost Explanatory variable: Minneapolis Response variable: Miles flown Explanatory variable: Miles flown Response variable: Minneapolis Explanatory variable: Cost Response variable: Distance RATIONALE The explanatory variable is what is along the horizontal axis, which is distance. The response variable is along the vertical axis, which is cost. CONCEPT Explanatory and Response Variables I need help with this question 4 Which of the following scatterplots shows a correlation affected by an influential point? RATIONALE An influential point will influence correlation that doesn't lie in the range of the other data. This graphs shows an outlier that is above the other data and lower in the x-direction. CONCEPT Cautions about Correlation I need help with this question 5 Peter analyzed a set of data with explanatory and response variables x and y. He concluded the mean and standard deviation for x as 7.8 and 3.70, respectively. He also concluded the mean and standard deviation for y as 12.2 and 4.15, respectively. The correlation was found to be 0.964. Select the correct slope and y-intercept for the least-squares line. Answer choices are rounded to the hundredths place. Slope = -1.08 y-intercept = 3.78 [Show More]
Last updated: 1 year ago
Preview 1 out of 18 pages
Reviews( 0 )
Document information
Connected school, study & course
About the document
Uploaded On
Jun 12, 2022
Number of pages
18
Written in

Additional information
This document has been written for:
Uploaded
Jun 12, 2022
Downloads
0
Views
135
_removed.png)
