Statistics > EXAM > MAT 150 Test Questions & Answers Test 1-6,100% CORRECT (All)
MAT 150 Test Questions & Answers Test 1-6,100% CORRECT
Document Content and Description Below
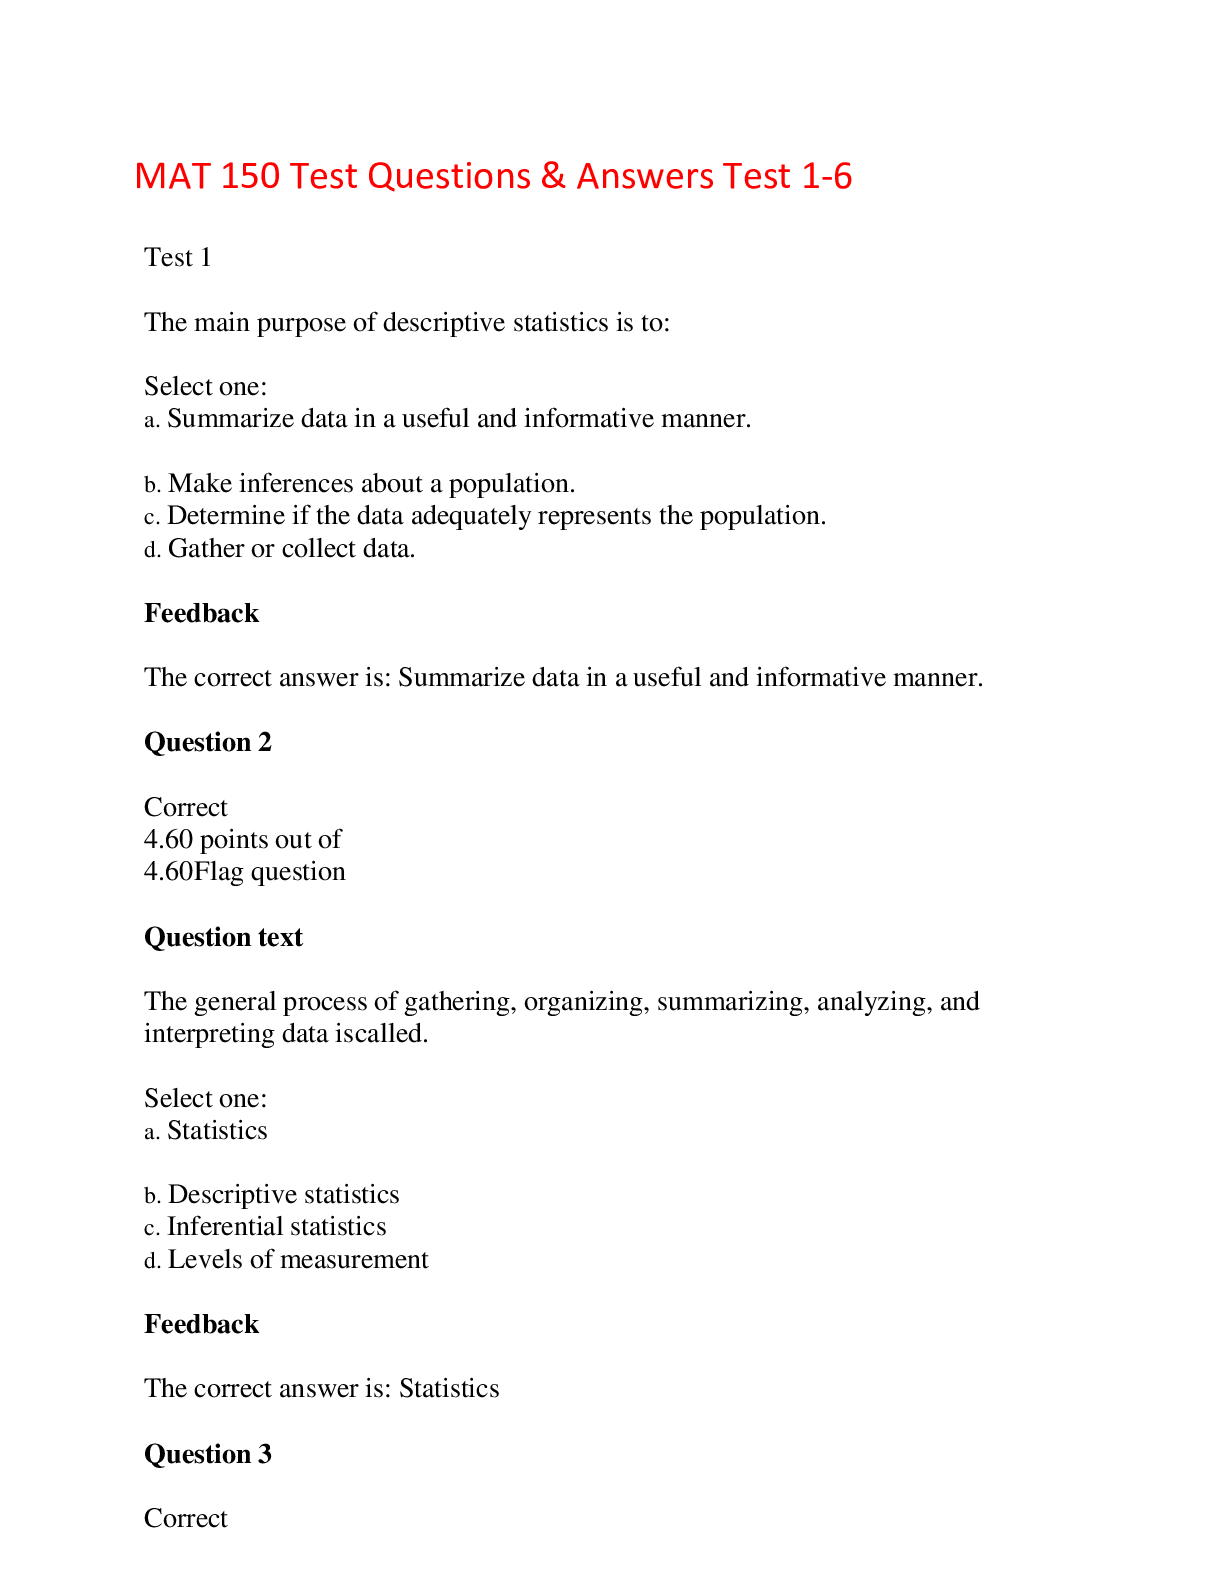
MAT 150 Test Questions & Answers Test 1-6 Test 1 The main purpose of descriptive statistics is to: Select one: a. Summarize data in a useful and informative manner. b. Make inferences abo... ut a population. c. Determine if the data adequately represents the population. d. Gather or collect data. Feedback The correct answer is: Summarize data in a useful and informative manner. Question 2 Correct 4.60 points out of 4.60 Flag question Question text The general process of gathering, organizing, summarizing, analyzing, and interpreting data is called . Select one: a. Statistics b. Descriptive statistics c. Inferential statistics d. Levels of measurement Feedback The correct answer is: Statistics Question 3 Correct 4.60 points out of 4.60 Flag question Question text Which word is NOT part of the definition of descriptive statistics? Select one: a. Organizing b. Analyzing c. Presenting d. Predicting Feedback The correct answer is: Predicting Question 4 Incorrect 0.00 points out of 4.60 Flag question Question text The Nielsen Ratings break down the number of people watching a particular television show by age. What level of measurement is age? Select one: a. Nominal b. Ordinal c. Interval d. Ratio Feedback The correct answer is: Ratio Question 5 Correct 4.60 points out of 4.60 Flag question Question text The names of the positions in a corporation, such as chief operating officer or controller, are examples of what type of variable? Select one: a. Qualitative b. Quantitative c. Interval d. Ratio Feedback The correct answer is: Qualitative Question 6 Correct 4.60 points out of 4.60 Flag question Question text If Gallup, Harris, and other pollsters asked people to indicate their political party affiliation as Democrat, Republican, or Independent, the data gathered would be an example of which scale of measurement? Select one: a. Nominal b. Ordinal c. Interval d. Ratio Feedback The correct answer is: Nominal Question 7 Incorrect 0.00 points out of 4.60 Flag question Question text Respondents were asked, "Do you now earn more than or less than you did five years ago?" What is this level of measurement? Select one: a. Interval b. Ratio c. Nominal d. Ordinal Feedback The correct answer is: Ordinal Question 8 Correct 4.60 points out of 4.60 Flag question Question text A survey includes a question regarding marital status that has the following responses: single, married, divorced, separated, or widowed. What is the scale of measurement for this question? Select one: a. Ratio b. Interval c. Ordinal d. Nominal Feedback The correct answer is: Nominal Question 9 Correct 4.60 points out of 4.60 Flag question Question text Shoe style is an example of what level of measurement? Select one: a. Nominal b. Ordinal c. Interval d. Ratio Feedback The correct answer is: Nominal Question 10 Correct 4.60 points out of 4.60 Flag question Question text What type of variable is the number of robberies reported in your city? Select one: a. Attribute b. Continuous c. Quantitative d. Qualitative Feedback The correct answer is: Quantitative Question 11 Correct 4.60 points out of 4.60 Flag question Question text What type of variable is "pounds of popcorn" served at a movie theater? Select one: a. Interval b. Ratio c. Discrete d. Continuous Feedback The correct answer is: Continuous Question 12 Correct 4.60 points out of 4.60 Flag question Question text A portion or part of a population is called a Select one: a. Random survey b. Sample c. Tally d. Frequency distribution Feedback The correct answer is: Sample Question 13 Correct 4.60 points out of 4.60 Flag question Question text The mean, as a measure of central location, would be inappropriate for which one of the following? Select one: a. Ages of adults at a senior citizen center b. Incomes of lawyers c. Number of pages in textbooks on statistics d. Marital status of college students at a particular university Feedback The correct answer is: Marital status of college students at a particular university Question 14 Correct 4.60 points out of 4.60 Flag question Question text Sometimes, a data set has two values that have the highest and equal frequencies. In this case, the distribution of the data can best be described as . Select one: a. Symmetric b. Bimodal (having two modes) c. Positively skewed d. Negatively skewed Feedback The correct answer is: Bimodal (having two modes) Question 15 Correct 4.60 points out of 4.60 Flag question Question text Over the last six months, the following numbers of absences have been reported: 6, 0, 10, 14, 8, and 0. What is the median number of monthly absences? Select one: a. 6 b. 7 c. 8 d. 3 Feedback The correct answer is: 7 Question 16 Correct 4.60 points out of 4.60 Flag question Question text A stockbroker placed the following order for a customer: • 50 shares of Kaiser Aluminum at $104 a share • 100 shares of GTE at $25.25 a share • 20 shares of Boston Edison at $9.125 a share What is the weighted arithmetic mean price per share? Select one: a. $25.25 b. $79.75 c. $103.50 d. $46.51 Feedback The correct answer is: $46.51 Question 17 Correct 4.60 points out of 4.60 Flag question Question text A disadvantage of using an arithmetic mean to summarize a set of data is that . Select one: a. The arithmetic mean sometimes has two values b. It can be used for interval and ratio data c. It is always different from the median d. It can be biased by one or two extremely small or large values Feedback The correct answer is: It can be biased by one or two extremely small or large values Question 18 Correct 4.60 points out of 4.60 Flag question Question text A sample of the paramedical fees charged by clinics revealed these amounts: $55, $49, $50, $45, $52, and $55. What is the median charge? Select one: a. $47.50 b. $51.00 c. $52.00 d. $55.00 Feedback The correct answer is: $51.00 Question 19 Correct 4.60 points out of 4.60 Flag question Question text The times (in minutes) that several underwriters took to review applications for similar insurance coverage are 50, 230, 52, and 57. What is the median length of time required to review an application? Select one: a. 54.5 b. 141.0 c. 97.25 d. 109.0 Feedback The correct answer is: 54.5 Question 20 Correct 4.60 points out of 4.60 Flag question Question text The following are the weekly amounts of welfare payments made by the federal government to a sample of six families: $139, $136, $130, $136, $147, and $136. What is the range? Select one: a. $0 b. $14 c. $52 d. $17 Feedback The correct answer is: $17 Question 21 Correct 4.60 points out of 4.60 Flag question Question text A sample of the personnel files of eight male employees revealed that, during a six-month period, they were absent the following number of days: 2, 0, 6, 3, 10, 4, 1, and 2. What is the mean deviation (in days)? Select one: a. 1 b. 0 c. 3.125 d. 2.375 Feedback The correct answer is: 2.375 Question 22 Incorrect 0.00 points out of 4.60 Flag question Question text The distribution of a sample of the outside diameters of PVC pipes approximates a symmetrical, bell-shaped distribution. The arithmetic mean is 14.0 inches, and the standard deviation is 0.1 inches. About 68% of the outside diameters lie between what two amounts? Select one: a. 13.5 and 14.5 inches b. 13.0 and 15.0 inches c. 13.9 and 14.1 inches d. 13.8 and 14.2 inches Feedback The correct answer is: 13.9 and 14.1 inches Question 23 Incorrect 0.00 points out of 4.60 Flag question Question text If the variance of the "number of daily parking tickets issued is 100, the standard deviation is defined as the . Select one: a. "Number of daily parking tickets" b. "Number of daily parking tickets" squared. c. Absolute value of the variance of the "number of daily parking tickets" d. Square root of the variance of the "number of daily parking tickets" Feedback The correct answer is: Square root of the variance of the "number of daily parking tickets" Question 24 Correct 4.60 points out of 4.60 Flag question Question text The weights (in thousands of kilograms) of seven shipping containers are 9.5, 10.3, 11.0, 10.4, 10.5, 11.2, and 9.2. What is the mean deviation? Select one: a. 0.543 kg b. 0.625 kg c. 0.53 kg d. 5.50 kg Feedback The correct answer is: 0.543 kg Question 25 Correct 4.60 points out of 4.60 Flag question Question text For a sample of similar sized all-electric homes, the March electric bills were (to the nearest dollar): $212, $191, $176, $129, $106, $92, $108, $109, $103, $121, $175, and $194. What is the range? Select one: a. $100 b. $130 c. $120 d. $112 Feedback The correct answer is: $120 Test 2 Quartiles divide a distribution into . Select one: a. 2 equal parts b. 4 equal parts c. 10 equal parts d. 100 equal parts Feedback The correct answer is: 4 equal parts Question 2 Correct 4.60 points out of 4.60 Flag question Question text In the following set of data: what are the first, second, and third quartiles? Select one: a. 1, 6, and 100 b. 3, 5, and 9 c. 3, 6, and 9 d. 1, 5, and 100 Feedback The correct answer is: 3, 6, and 9 Question 3 Correct 4.60 points out of 4.60 Flag question Question text A dot plot is best applied for a data set with . Select one: a. 1,000 observations b. 50 observations c. More than one variable d. One mode Feedback The correct answer is: 50 observations Question 4 Correct 4.60 points out of 4.60 Flag question Question text Percentiles divide a distribution into . Select one: a. 2 equal parts b. 4 equal parts c. 10 equal parts d. 100 equal parts Feedback The correct answer is: 100 equal parts Question 5 Correct 4.60 points out of 4.60 Flag question Question text In a distribution, the second quartile corresponds with the . Select one: a. Mean b. Median c. Mode d. Variance Feedback The correct answer is: Median Question 6 Correct 4.60 points out of 4.60 Flag question Question text A dot plot can be used to show . Select one: a. The mean, median, and mode b. The general shape of a distribution for a nominal qualitative variable c. The distribution for a quantitative variable d. The interquartile range Feedback The correct answer is: The distribution for a quantitative variable Question 7 Correct 4.60 points out of 4.60 Flag question Question text What does the interquartile range describe? Select one: a. The range of the lower 50% of the observations b. The range of the middle 50% of the observations c. The range of the upper 50% of the observations d. The ranges of the lower 25% and the upper 25% of the observations Feedback The correct answer is: The range of the middle 50% of the observations Question 8 Correct 4.60 points out of 4.60 Flag question Question text If the coefficient of skewness is equal to zero, the shape of the distribution is . Select one: a. Negatively skewed b. Symmetric c. Positively skewed d. Unknown Feedback The correct answer is: Symmetric Question 9 Correct 4.60 points out of 4.60 Flag question Question text The following graph is . Select one: a. Positively skewed b. Negatively skewed c. Symmetric d. Uniformly distributed Feedback The correct answer is: Positively skewed Question 10 Correct 4.60 points out of 4.60 Flag question Question text What is the possible range of values for Pearson's coefficient of skewness? Select one: a. -1 and +1 b. -3 and +3 c. 0% and 100% d. Unlimited values Feedback The correct answer is: -3 and +3 Question 11 Correct 4.60 points out of 4.60 Flag question Question text A sample of experienced typists revealed that their mean typing speed is 87 words per minute and the median typing speed is 73 words per minute. The standard deviation of typing speed is 16.9 words per minute. What is the Pearson coefficient of skewness? Select one: a. -2.5 b. -4.2 c. +4.2 d. +2.5 Feedback The correct answer is: +2.5 Question 12 Correct 4.60 points out of 4.60 Flag question Question text A large oil company is studying the number of gallons of gasoline purchased per customer at self-service pumps. The mean number of gallons is 10.0, with a standard deviation of 3.0 gallons. The median is 10.75 gallons. What is Pearson's coefficient of skewness in this instance? Select one: a. -1.00 b. -0.75 c. +0.75 d. +1.00 Feedback The correct answer is: -0.75 Question 13 Correct 4.60 points out of 4.60 Flag question Question text In a contingency table, we describe the relationship between . Select one: a. Two variables measured at the ordinal or nominal level b. Two variables, one measured as an ordinal variable and the other as a ratio variable c. Two variables measured at the interval or ratio level d. A variable measure on the interval or ratio level and time Feedback The correct answer is: Two variables measured at the ordinal or nominal level Question 14 Incorrect 0.00 points out of 4.60 Flag question Question text A group of employees of Unique Services will be surveyed about a new pension plan. In-depth interviews with each employee selected in the sample will be conducted. The employees are classified as follows. What is the probability that the first person selected is a supervisor and in management? Select one: a. 0.00 b. 0.06 c. 0.15 d. 0.21 Feedback The correct answer is: 0.00 Question 15 Correct 4.60 points out of 4.60 Flag question Question text A gumball machine is filled with 50 black, 150 white, 100 red, and 100 yellow gumballs that have been thoroughly mixed. Sue and Jim each purchased one gumball. What is the likelihood both Sue and Jim get red gumballs? Select one: a. 0.50 b. 0.062 c. 0.33 d. 0.75 Feedback The correct answer is: 0.062 Question 16 Incorrect 0.00 points out of 4.60 Flag question Question text What does the complement rule state? Select one: a. P(A) = P(A) - P(B) b. P(A) = 1 - P(not A) c. P(A) = P(A) × P(B) d. P(A) = P(A)X + P(B) Feedback The correct answer is: P(A) = 1 - P(not A) Question 17 Correct 4.60 points out of 4.60 Flag question Question text A supplier delivers an order for 20 electric toothbrushes to a store. By accident, three of the electric toothbrushes are defective. What is the probability that the first two electric toothbrushes sold will be returned because they are defective? Select one: a. 3/20 or 0.15 b. 3/17 or 0.176 c. ¼ or 0.25 d. 3/190 or 0.01579 Feedback The correct answer is: 3/190 or 0.01579 Question 18 Correct 4.60 points out of 4.60 Flag question Question text When an event's probability depends on the likelihood of another event, the probability is a(n) . Select one: a. Conditional probability b. Empirical probability c. Joint probability d. Mutually exclusive probability Feedback The correct answer is: Conditional probability Question 19 Correct 4.60 points out of 4.60 Flag question Question text When applying the special rule of addition for mutually exclusive events, the joint probability is . Select one: a. 1 b. .5 c. 0 d. Unknown Feedback The correct answer is: 0 Question 20 Incorrect 0.00 points out of 4.60 Flag question Question text A sales representative calls on four hospitals in Westchester County. It is immaterial what order he calls on them. How many different arrangements can be made with the 4? Select one: a. 4 b. 24 c. 120 d. 37 Feedback The correct answer is: 24 Question 21 Correct 4.60 points out of 4.60 Flag question Question text The numbers 0 through 9 are used in code groups of four to identify an item of clothing. Code 1083 might identify a blue blouse, size medium. The code group 2031 might identify a pair of pants, size 18, and so on. Repetitions of numbers are not permitted—in other words, the same number cannot be used more than once in a total sequence. As examples, 2256, 2562, or 5559 would not be permitted. How many different code groups can be designed? Select one: a. 5,040 b. 620 c. 10,200 d. 120 Feedback The correct answer is: 5,040 Question 22 Correct 4.60 points out of 4.60 Flag question Question text What does equal? Select one: a. 640 b. 36 c. 10 d. 120 Feedback The correct answer is: 10 Question 23 Correct 4.60 points out of 4.60 Flag question Question text Six basic colors are used in decorating a new condominium. They are applied to a unit in groups of four colors. One unit might have gold as the principal color, blue as a complementary color, red as the accent color, and touches of white. Another unit might have blue as the principal color, white as the complementary color, gold as the accent color, and touches of red. If repetitions are permitted, how many different units can be decorated? Select one: a. 7,825 b. 25 c. 125 d. 1,296 Feedback The correct answer is: 1,296 Question 24 Correct 4.60 points out of 4.60 Flag question Question text A lamp manufacturer designed five lamp bases and four lampshades that could be used together. How many different arrangements of base and shade can be offered? Select one: a. 5 b. 10 c. 15 d. 20 Feedback The correct answer is: 20 Question 25 Correct 4.60 points out of 4.60 Flag question Question text An electronics firm sells four models of stereo receivers, three amplifiers, and six speaker brands. When the four types of components are sold together, they form a "system." How many different systems can the electronics firm offer? Select one: a. 36 b. 18 c. 72 d. 144 Feedback The correct answer is: 72 Test 3 The production department has installed a new spray machine to paint automobile doors. As is common with most spray guns, unsightly blemishes often appear because of improper mixture or other problems. A worker counted the number of blemishes on each door. Most doors had no blemishes; a few had one; a very few had two; and so on. The average number was 0.5 per door. The distribution of blemishes followed the Poisson distribution. Out of 10,000 doors painted, about how many would have no blemishes? Select one: a. About 6,065 b. About 3,935 c. About 5,000 d. About 500 Feedback The correct answer is: About 6,065 Question 2 Correct 4.60 points out of 4.60 Flag question Question text A new car was put into production. It involved many assembly tasks. Each car was inspected at the end of the assembly line and the number of defects per unit was recorded. For the first 100 cars produced, there were 40 defective cars. Some of the cars had no defects, a few had one defect, and so on. The distribution of defects followed a Poisson distribution. Based on the first 100 cars produced, about how many out of every 1,000 cars assembled should have one or more defects? Select one: a. About 660 b. About 165 c. About 630 d. About 330 Feedback The correct answer is: About 330 Question 3 Correct 4.60 points out of 4.60 Flag question Question text Which of the following is correct about a probability distribution? Select one: a. The sum of all possible outcomes must equal 1.0. b. Outcomes must be mutually exclusive. c. The probability of each outcome must be between 0.0 and 1.0 inclusive. d. All apply. Feedback The correct answer is: All apply. Question 4 Correct 4.60 points out of 4.60 Flag question Question text For the following distribution: What is the mean of the distribution? Select one: a. 2.1 b. 1.5 c. 0.441 d. 2 Feedback The correct answer is: 2.1 Question 5 Correct 4.60 points out of 4.60 Flag question Question text For the following distribution: What is the variance of the distribution? Select one: a. 2.1 b. 0.132 c. 0.364 d. 1.000 Feedback The correct answer is: 0.132 Question 6 Correct 4.60 points out of 4.60 Flag question Question text The following is a Poisson probability distribution with µ = 0.1. The variance of the distribution is . Select one: a. 1.0 b. 0.9046 c. 3.0 d. 0.1 Feedback The correct answer is: 0.1 Question 7 Correct 4.60 points out of 4.60 Flag question Question text For a binomial distribution, the mean is 4.0 and n = 8. What is π for this distribution? Select one: a. 0.5 b. 1.00 c. 4.0 d. 0.1 Feedback The correct answer is: 0.5 Question 8 Correct 4.60 points out of 4.60 Flag question Question text A listing of all possible outcomes of an experiment and their corresponding probabilities of occurrence is called a . Select one: a. Random variable b. Probability distribution c. Subjective probability d. Frequency distribution Feedback The correct answer is: Probability distribution Question 9 Correct 4.60 points out of 4.60 Flag question Question text Which of the following is true regarding the normal distribution? Select one: a. The mean, median, and mode are all equal. b. It has two modes. c. It is asymmetrical. d. The points of the curve meet the x-axis at z = -3 and z = 3. Feedback The correct answer is: The mean, median, and mode are all equal. Question 10 Correct 4.60 points out of 4.60 Flag question Question text The annual commissions per salesperson employed by a retailer of mobile communication devices averaged $40,000, with a standard deviation of $5,000. What percent of the salespersons earn between $32,000 and $42,000? Select one: a. 60.06% b. 39.94% c. 34.13% d. 81.66% Feedback The correct answer is: 60.06% Question 11 Correct 4.60 points out of 4.60 Flag question Question text The distribution of the annual incomes of a group of middle management employees approximated a normal distribution with a mean of $37,200 and a standard deviation of $800. About 68% of the incomes lie between what two incomes? Select one: a. $30,000 and $40,000 b. $36,400 and $38,000 c. $34,800 and $39,600 d. $35,600 and $38,800 Feedback The correct answer is: $36,400 and $38,000 Question 12 Correct 4.60 points out of 4.60 Flag question Question text The time to fly between New York City and Chicago is uniformly distributed with a minimum of 120 minutes and a maximum of 150 minutes. What is the distribution's mean? Select one: a. 120 minutes b. 150 minutes c. 135 minutes d. 270 minutes Feedback The correct answer is: 135 minutes Question 13 Correct 4.60 points out of 4.60 Flag question Question text The time to fly between New York City and Chicago is uniformly distributed with a minimum of 120 minutes and a maximum of 150 minutes. What is the probability that a flight is between 125 and 140 minutes? Select one: a. 1.00 b. 0.50 c. 0.33 d. 10.00 Feedback The correct answer is: 0.50 Question 14 Correct 4.60 points out of 4.60 Flag question Question text A national manufacturer of unattached garages discovered that the distribution of the time for two construction workers to erect the Red Barn model is normally distributed with a mean of 32 hours and a standard deviation of 2 hours. What percent of the garages take between 32 and 34 hours to erect? Select one: a. 16.29% b. 76.71% c. 3.14% d. 34.13% Feedback The correct answer is: 34.13% Question 15 Correct 4.60 points out of 4.60 Flag question Question text The upper and lower limits of a uniform probability distribution are . Select one: a. Positive and negative infinity b. Plus and minus three standard deviations c. 0 and 1 d. The maximum and minimum values of the random variable Feedback The correct answer is: The maximum and minimum values of the random variable Question 16 Correct 4.60 points out of 4.60 Flag question Question text The mean amount spent by a family of four on food is $500 per month with a standard deviation of $75. Assuming that the food costs are normally distributed, what is the probability that a family spends less than $410 per month? Select one: a. 0.2158 b. 0.8750 c. 0.0362 d. 0.1151 Feedback The correct answer is: 0.1151 Question 17 Correct 4.60 points out of 4.60 Flag question Question text When dividing a population into subgroups so that a random sample from each subgroup can be collected, what type of sampling is used? Select one: a. Simple random sampling b. Systematic sampling c. Stratified random sampling d. Cluster sampling Feedback The correct answer is: Stratified random sampling Question 18 Incorrect 0.00 points out of 4.60 Flag question Question text A marketing firm is studying consumer preferences for winter fashions in four different months. From a population of women 18-21 years of age, a random sample of 100 women was selected in January. Another random sample of 100 women was selected in March. Another random sample of 100 women was selected in June. Another random sample of 100 women was selected in September. What is the number of samples? Select one: a. 4 b. 100 c. 400 d. 1 Feedback The correct answer is: 4 Question 19 Correct 4.60 points out of 4.60 Flag question Question text To study the population of consumer perceptions of new technology, sampling of the population is preferred over surveying the population because . Select one: a. Sampling is more accurate b. We can compute z-scores c. It is quicker d. Sampling methods are simple Feedback The correct answer is: It is quicker Question 20 Correct 4.60 points out of 4.60 Flag question Question text Sampling error is defined as . Select one: a. b. σ c. σ/n d. N - n Feedback The correct answer is: Question 21 Correct 4.60 points out of 4.60 Flag question Question text The true sampling error is usually not known because . Select one: a. µ is unknown b. µ is a random variable c. σ2 is unknown d. The sample mean cannot be computed Feedback The correct answer is: µ is unknown Question 22 Correct 4.60 points out of 4.60 Flag question Question text What is the difference between a sample mean and the population mean called? Select one: a. Standard error of the mean b. Sampling error c. Interval estimate d. Point estimate Feedback The correct answer is: Sampling error Question 23 Incorrect 0.00 points out of 4.60 Flag question Question text According to the central limit theorem, . Select one: a. Sample size is important when the population is not normally distributed b. Increasing sample size decreases the dispersion of the sampling distribution c. The sampling distribution of the sample means is uniform d. The sampling distribution of the sample means will be skewed Feedback The correct answer is: Sample size is important when the population is not normally distributed Question 24 Correct 4.60 points out of 4.60 Flag question Question text According to the central limit theorem, . Select one: a. The population mean and the mean of all sample means are equal b. Increasing sample size decreases the dispersion of the sampling distribution c. The sampling distribution of the sample means is approximately normally distributed d. The sampling distribution of the sample means will be skewed Feedback The correct answer is: The sampling distribution of the sample means is approximately normally distributed Question 25 Incorrect 0.00 points out of 4.60 Flag question Question text Bones Brothers & Associates prepare individual tax returns. Over prior years, Bones Brothers has maintained careful records regarding the time to prepare a return. The mean time to prepare a return is 90 minutes and the standard deviation of this distribution is 14 minutes. Suppose 100 returns from this year are selected and analyzed regarding the preparation time. What is the probability that the mean time for the sample of 100 returns for this year is greater than 92? Select one: a. Approximately zero b. 0.0832 c. 0.4168 d. 0.0764 Feedback The correct answer is: 0.0764 Test 4 Mileage tests were conducted on a randomly selected sample of 100 newly developed automobile tires. The results showed that the mean tread life was 50,000 miles, with a standard deviation of 3,500 miles. What is the best estimate of the mean tread life in miles for the entire population of these tires? Select one: a. 50,000 b. 3,500 c. 500 d. 35 Feedback The correct answer is: 50,000 Question 2 Correct 4.60 points out of 4.60 Flag question Question text University officials say that at least 70% of the voting student population supports a fee increase. If the 95% confidence interval estimating the proportion of students supporting the fee increase is [0.75, 0.85], what conclusion can be drawn? Select one: a. 70% is not in the interval, so another sample is needed. b. 70% is not in the interval, so assume it will not be supported. c. The interval estimate is above 70%, so infer that it will be supported. d. Since this was not based on population, we cannot make a conclusion. Feedback The correct answer is: The interval estimate is above 70%, so infer that it will be supported. Question 3 Correct 4.60 points out of 4.60 Flag question Question text A random sample of 85 supervisors revealed that they worked an average of 6.5 years before being promoted. The population standard deviation was 1.7 years. Using the 0.95 degree of confidence, what is the confidence interval for the population mean? Select one: a. 6.99 and 7.99 b. 4.15 and 7.15 c. 6.14 and 6.86 d. 6.49 and 7.49 Feedback The correct answer is: 6.14 and 6.86 Question 4 Correct 4.60 points out of 4.60 Flag question Question text Knowing the population standard deviation, a 95% confidence interval infers that the population mean . Select one: a. Is between 0 and 100% b. Is within ±1.96 standard deviations of the sample mean c. Is within ±1.96 standard errors of the sample mean d. Is too large Feedback The correct answer is: Is within ±1.96 standard errors of the sample mean Question 5 Correct 4.60 points out of 4.60 Flag question Question text A survey of an urban university (population of 25,450) showed that 750 of 1,100 students sampled attended a home football game during the season. Using the 90% level of confidence, what is the confidence interval for the proportion of students attending a football game? Select one: a. [0.7510, 0.8290] b. [0.6569, 0.7031] c. [0.6659, 0.6941] d. [0.6795, 0.6805] Feedback The correct answer is: [0.6569, 0.7031] Question 6 Correct 4.60 points out of 4.60 Flag question Question text A survey of an urban university (population of 25,450) showed that 870 of 1,100 students sampled supported a fee increase to fund improvements to the student recreation center. Using the 95% level of confidence, what is the confidence interval for the proportion of students supporting the fee increase? Select one: a. [0.767, 0.815] b. [0.759, 0.822] c. [0.771, 0.811] d. [0.714, 0.866] Feedback The correct answer is: [0.767, 0.815] Question 7 Correct 4.60 points out of 4.60 Flag question Question text Suppose 1,600 of 2,000 registered voters sampled said they planned to vote for the Republican candidate for president. Using the 0.95 degree of confidence, what is the interval estimate for the population proportion (to the nearest 10th of a percent)? Select one: a. 78.2% to 81.8% b. 69.2% to 86.4% c. 76.5% to 83.5% d. 77.7% to 82.3% Feedback The correct answer is: 78.2% to 81.8% Question 8 Correct 4.60 points out of 4.60 Flag question Question text A student wanted to construct a 95% confidence interval for the mean age of students in her statistics class. She randomly selected nine students. Their average age was 19.1 years with a sample standard deviation of 1.5 years. What is the best point estimate for the population mean? Select one: a. 2.1 years b. 1.5 years c. 19.1 years d. 9 years Feedback The correct answer is: 19.1 years Question 9 Correct 4.60 points out of 4.60 Flag question Question text An electronics retailer believes that, at most, 40% of their cell phone inventory was sold during November. The retailer surveyed 80 dealers and found that 38% of the inventory was sold. Since 38% is less than 40%, is this difference of 2 percentage points sampling error or a significant difference? Test at the 0.05 level. The computed z = -0.37. Select one: a. The 2% is a significant difference. b. We cannot determine if the 2% is a significant difference. c. There is not enough information to reach a conclusion. d. None Apply. Feedback The correct answer is: We cannot determine if the 2% is a significant difference. Question 10 Incorrect 0.00 points out of 4.60 Flag question Question text Based on the Nielsen ratings, the local CBS affiliate claims its 11 p.m. newscast reaches 41% of the viewing audience in the area. In a survey of 100 viewers, 36% indicated that they watch the late evening news on this local CBS station. What is the z test statistic? Select one: a. 1.02 b. 1.22 c. -1.02 d. -1.22 Feedback The correct answer is: -1.02 Question 11 Correct 4.60 points out of 4.60 Flag question Question text For a two-tailed test with a 0.05 significance level, where is the rejection region when n is large and the population standard deviation is known? Select one: a. Between ±1.960 b. Between ±1.645 c. Greater than +1.960 and less than -1.960 d. Greater than +1.645 and less than -1.645 Feedback The correct answer is: Greater than +1.960 and less than -1.960 Question 12 Correct 4.60 points out of 4.60 Flag question Question text What is another name for the alternate hypothesis? Select one: a. Null hypothesis b. Hypothesis of no difference c. Rejected hypothesis d. Research hypothesis Feedback The correct answer is: Research hypothesis Question 13 Incorrect 0.00 points out of 4.60 Flag question Question text In hypothesis testing, what is the level of significance? Select one: a. The risk of rejecting the null hypothesis when it is true. b. A value symbolized by the Greek letter α. c. A value between 0 and 1. d. It is selected before a decision rule can be formulated. e. All apply. Feedback The correct answer is: All apply. Question 14 Correct 4.60 points out of 4.60 Flag question Question text Define the level of significance. Select one: a. It is the probability of a Type II error. b. It is the probability of a Type I error. c. It is a z value of 1.96. d. It is the beta error. Feedback The correct answer is: It is the probability of a Type I error. Question 15 Correct 4.60 points out of 4.60 Flag question Question text A hypothesis regarding the weight of newborn infants at a community hospital is that the mean is 6.6 pounds. A sample of seven infants is randomly selected and their weights at birth are recorded as 9.0, 7.3, 6.0, 8.8, 6.8, 8.4, and 6.6 pounds. What is the alternate hypothesis? Select one: a. H1: µ = 6.6 b. H1: µ ≠ 6.6 c. H1: µ ≥ 6.6 d. H1: µ > 7.6 Feedback The correct answer is: H1: µ ≠ 6.6 Question 16 Correct 4.60 points out of 4.60 Flag question Question text For an alternative hypothesis: µ > 6,700, where is the rejection region for the hypothesis test located? Select one: a. In both tails b. In the left or lower tail c. In the right or upper tail d. In the center Feedback The correct answer is: In the right or upper tail Question 17 Correct 4.60 points out of 4.60 Flag question Question text A sample of 250 adults tried the new multigrain cereal "Wow!" A total of 187 rated it as excellent. In a sample of 100 children, 66 rated it as excellent. Using the 0.1 significance level, the researcher wishes to show that adults like the cereal better than children. Which of the following is the alternate hypothesis? Select one: a. H1: πA = πC b. H1: πA < πC c. H1: πA > πC d. H1: πA ≠ πC Feedback The correct answer is: H1: πA > πC Question 18 Incorrect 0.00 points out of 4.60 Flag question Question text A national manufacturer of ball bearings is experimenting with two different processes for producing precision ball bearings. It is important that the diameters be as close as possible to an industry standard. The output from each process is sampled and the average error from the industry standard is measured in millimeters. The results are presented next. The researcher is interested in determining whether there is evidence that the two processes yield different average errors. The population standard deviations are unknown but assumed equal. What is the alternate hypothesis? Select one: a. H1: µA = µB b. H1: µA ≠ µB c. H1: µA ≤ µB d. H1: µA > µB Feedback The correct answer is: H1: µA ≠ µB Question 19 Correct 4.60 points out of 4.60 Flag question Question text Two samples, one of size 14 and the second of size 13, are selected to test the difference between two population means. How many degrees of freedom are used to find the critical value? Assume the population standard deviations are equal. Select one: a. 27 b. 26 c. 25 d. 14 Feedback The correct answer is: 25 Question 20 Incorrect 0.00 points out of 4.60 Flag question Question text A recent study focused on the amount of money single men and women save monthly. The information is summarized next. Assume that the population standard deviations are equal. At the .01 significance level, what is the conclusion about the way women and men save? Select one: a. Reject the null hypothesis and conclude that women save more than men. b. Reject the null hypothesis and conclude that women and men save the same amount. c. Fail to reject the null hypothesis. d. Fail to reject the null hypothesis and conclude the means are different. Feedback The correct answer is: Fail to reject the null hypothesis. Question 21 Correct 4.60 points out of 4.60 Flag question Question text A company is researching the effectiveness of a new website design to decrease the time to access a website. Five website users were randomly selected, and their times (in seconds) to access the website with the old and new designs were recorded. To compare the times, they computed (new website design time - old website design time). The results follow. For a 0.01 significance level, what is the critical value? Select one: a. 2.256 b. 1.895 c. 3.747 d. 2.447 Feedback The correct answer is: 3.747 Question 22 Incorrect 0.00 points out of 4.60 Flag question Question text When is it appropriate to use the paired difference t-test? Select one: a. When four samples are compared at once b. When any two samples are compared c. When two independent samples are compared d. When two dependent samples are compared Feedback The correct answer is: When two dependent samples are compared Question 23 Correct 4.60 points out of 4.60 Flag question Question text If the null hypothesis that two means are equal is true, where will 97% of the computed z values lie between? Select one: a. ±2.58 b. ±2.33 c. ±2.17 d. ±2.07 Feedback The correct answer is: ±2.17 Question 24 Correct 4.60 points out of 4.60 Flag question Question text A recent study focused on the number of times men and women send a Twitter message in a day. The information is summarized next. At the .01 significance level, is there a difference in the mean number of times men and women send a Twitter message in a day? What is the value of the test statistic for this hypothesis test? Select one: a. 2.668 b. 2.672 c. 2.58 d. 2.40 Feedback The correct answer is: 2.40 Question 25 Incorrect 0.00 points out of 4.60 Flag question Question text A recent study focused on the amount of money single men and women save monthly. The information is summarized next. Assume that the population standard deviations are equal. At the .01 significance level, do women save more money than men? What is the test statistic for this hypothesis? Select one: a. z-statistic b. t-statistic c. p-statistic d. df-statistic Feedback The correct answer is: t-statistic Test 5 Suppose that an automobile manufacturer designed a radically new lightweight engine and wants to recommend the grade of gasoline that will have the best fuel economy. The four grades are regular, economy, premium, and super premium. The test car made three trial runs on the test track using each of the four grades. The miles per gallon were recorded for each grade. At the 0.05 level, what is the critical value of F used to test the hypothesis that the miles per gallon for each fuel are the same? Select one: a. 1.96 b. 4.07 c. 2.33 d. 12.00 Feedback The correct answer is: 4.07 Question 2 Correct 4.60 points out of 4.60 Flag question Question text Several employees have submitted different methods of assembling a subassembly. Sample data for each method are: How many treatments are there? Select one: a. 3 b. 4 c. 12 d. 0 Feedback The correct answer is: 4 Question 3 Incorrect 0.00 points out of 4.60 Flag question Question text The annual dividend rates for a random sample of 16 companies in three different industries, utilities, banking, and insurance were recorded. The ANOVA comparing the mean annual dividend rate among three industries rejected the null hypothesis that the dividend rates were equal. The Mean Square Error (MSE) was 3.36. The following table summarized the results: Based on the comparison between the mean annual dividend rate for companies in utilities and banking, the 95% confidence interval shows an interval of 1.28 to 6.28 for the difference. This result indicates that . Select one: a. There is no significant difference between the two rates b. The interval contains a difference of 5.00 c. The annual dividend rate in the utilities industry is significantly less than the annual dividend rate in the banking industry d. The annual dividend rate in the banking industry is significantly less than the annual dividend rate in the utilities industry Feedback The correct answer is: The annual dividend rate in the utilities industry is significantly less than the annual dividend rate in the banking industry Question 4 Incorrect 0.00 points out of 4.60 Flag question Question text When testing for differences between treatment means, the t statistic is based on . Select one: a. The treatment degrees of freedom b. The total degrees of freedom c. The error degrees of freedom d. The ratio of treatment and error degrees of freedom Feedback The correct answer is: The error degrees of freedom Question 5 Correct 4.60 points out of 4.60 Flag question Question text A random sample of 40 companies with assets over $10 million was surveyed and asked to indicate their industry and annual computer technology expense. The ANOVA comparing the average computer technology expense among three industries rejected the null hypothesis. The Mean Square Error (MSE) was 195. The following table summarized the results: Based on the comparison between the mean annual computer technology expense for companies in the education and tax services industries, . Select one: a. A confidence interval shows that the mean annual computer technology expenses are not significantly different b. The ANOVA results show that the mean annual computer technology expenses are significantly different c. A confidence interval shows that the mean annual computer technology expenses are significantly different d. The ANOVA results show that the mean annual computer technology expenses are not significantly different Feedback The correct answer is: A confidence interval shows that the mean annual computer technology expenses are significantly different Question 6 Correct 4.60 points out of 4.60 Flag question Question text Three different fertilizers were applied to a field of celery. In computing F, how many degrees of freedom are there in the numerator? Select one: a. 0 b. 1 c. 2 d. 3 Feedback The correct answer is: 2 Question 7 Correct 4.60 points out of 4.60 Flag question Question text A manufacturer of automobile transmissions uses three different processes. Management ordered a study of the production costs to see if there is a difference among the three processes. A summary of the findings is shown next. In an ANOVA table, what are the degrees of freedom for the treatment source of variation? Select one: a. 2 b. 3 c. 10 d. 27 Feedback The correct answer is: 2 Question 8 Correct 4.60 points out of 4.60 Flag question Question text Two accounting professors decided to compare the variance of their grading procedures. To accomplish this, they each graded the same 10 exams, with the following results: At the 5% level of significance, what is the decision regarding the null hypothesis? Select one: a. Reject the null hypothesis and conclude the variances are different. b. Fail to reject the null hypothesis and conclude no significant difference in the variances. c. Reject the null hypothesis and conclude the variances are the same. d. Fail to reject the null hypothesis and conclude the variances are the same. Feedback The correct answer is: Reject the null hypothesis and conclude the variances are different. Question 9 Correct 4.60 points out of 4.60 Flag question Question text Two accounting professors decided to compare the variance of their grading procedures. To accomplish this, they each graded the same 10 exams, with the following results: The calculated F ratio is . Select one: a. 3.484 b. 1.867 c. 3.18 d. 5.35 Feedback The correct answer is: 3.484 Question 10 Correct 4.60 points out of 4.60 Flag question Question text Two accounting professors decided to compare the variance of their grading procedures. To accomplish this, they each graded the same 10 exams, with the following results: What is the critical value of F at the 0.01 level of significance? Select one: a. 5.85 b. 5.35 c. 6.51 d. 4.03 Feedback The correct answer is: 5.35 Question 11 Incorrect 0.00 points out of 4.60 Flag question Question text Two accounting professors decided to compare the variance of their grading procedures. To accomplish this, they each graded the same 10 exams, with the following results: At the 1% level of significance, what is the decision? Select one: a. Reject the null hypothesis and conclude the variances are different. b. Fail to reject the null hypothesis and conclude the variances are different. c. Reject the null hypothesis and conclude the variances are the same. d. Fail to reject the null hypothesis and conclude the variances are the same. Feedback The correct answer is: Fail to reject the null hypothesis and conclude the variances are the same. Question 12 Incorrect 0.00 points out of 4.60 Flag question Question text Two accounting professors decided to compare the variance of their grading procedures. To accomplish this, they each graded the same 10 exams, with the following results: What is the critical value of F at the 0.05 level of significance? Select one: a. 5.85 b. 5.35 c. 3.18 d. 4.03 Feedback The correct answer is: 3.18 Question 13 Correct 4.60 points out of 4.60 Flag question Question text Two accounting professors decided to compare the variance of their grading procedures. To accomplish this, they each graded the same 10 exams, with the following results: What are the degrees of freedom for the denominator of the F ratio? Select one: a. 20 b. 18 c. 10 d. 9 Feedback The correct answer is: 9 Question 14 Correct 4.60 points out of 4.60 Flag question Question text The regression equation is Ŷ = 29.29 - 0.96X, the sample size is 8, and the standard error of the slope is 0.22. What is the critical value to test the significance of the slope at the 0.01 significance level? Select one: a. z = +2.576 b. t = +3.707 c. t = +3.355 d. t = ±3.707 Feedback The correct answer is: t = ±3.707 Question 15 Correct 4.60 points out of 4.60 Flag question Question text If we reject the null hypothesis, H0: , what can we conclude about the population correlation coefficient? Select one: a. It is zero. b. It could be zero. c. It is not zero. d. It equals the computed sample correlation. Feedback The correct answer is: It is not zero. Question 16 Incorrect 0.00 points out of 4.60 Flag question Question text Using the following information: What is the correlation coefficient? Select one: a. 0.9184 b. 0.9583 c. -0.9583 d. 0.9004 Feedback The correct answer is: 0.9583 Question 17 Correct 4.60 points out of 4.60 Flag question Question text A regression analysis yields the following information: ; n = 10; sy∙x = 1.66; ΣX = 32; ΣX2 = 134; Compute the 95% confidence interval when X = 4. Select one: a. 0.0, 4.05 b. 4.15, 12.25 c. 2.67, 5.33 d. 6.842, 9.497 Feedback The correct answer is: 6.842, 9.497 Question 18 Incorrect 0.00 points out of 4.60 Flag question Question text A sales manager for an advertising agency believes there is a relationship between the number of contacts that a salesperson makes and the amount of sales dollars earned. A regression analysis shows the following results: = 33.4. = 2814.4. The 95% prediction interval for a particular person making 30 calls is . Select one: a. 55.8, 51.5 b. 51.4, 55.9 c. 46.7, 60.6 d. 31.1, 76.2 Feedback The correct answer is: 31.1, 76.2 Question 19 Correct 4.60 points out of 4.60 Flag question Question text A sales manager for an advertising agency believes that there is a relationship between the number of contacts that a salesperson makes and the amount of sales dollars earned. A regression ANOVA shows the following results: What is the value of the coefficient of correlation? Select one: a. +0.6317 b. +0.9754 c. -0.9754 d. +0.9513 Feedback The correct answer is: +0.9754 Question 20 Correct 4.60 points out of 4.60 Flag question Question text Using the following information: What is the standard error of the estimate? Select one: a. 136.8552 b. 1094.842 c. 11.6985 d. 13418.4 Feedback The correct answer is: 11.6985 Question 21 Incorrect 0.00 points out of 4.60 Flag question Question text The regression equation is Ŷ = 30 + 2.56X, the sample size is 14, and the standard error of the slope is 0.97. What is the critical value to test the significance of the slope at the 0.05 significance level? Select one: a. z = ±1.96 b. t = ±2.179 c. t = ±2.145 d. t = +2.145 Feedback The correct answer is: t = ±2.179 Question 22 Correct 4.60 points out of 4.60 Flag question Question text The Pearson product-moment correlation coefficient, r, requires that variables be measured with . Select one: a. An interval or ratio scale. b. An ordinal or ratio scale. c. A nominal or ordinal scale. d. A nominal or ratio scale. Feedback The correct answer is: An interval or ratio scale. Question 23 Correct 4.60 points out of 4.60 Flag question Question text What are the degrees of freedom used to test the significance of the slope in a simple linear regression equation? Select one: a. n - 1 b. n - 2 c. n - 1, n - 2 d. (n - 1)(n - 2) Feedback The correct answer is: n - 2 Question 24 Correct 4.60 points out of 4.60 Flag question Question text If the correlation coefficient between two variables, X and Y, equals zero, what can be said of the variables X and Y? Select one: a. The variables are not related. b. The variables are dependent on each other. c. The variables are highly related. d. X causes Y. Feedback The correct answer is: The variables are not related. Question 25 Correct 4.60 points out of 4.60 Flag question Question text What is the chart called when the paired data (the dependent and independent variables) are plotted? Select one: a. A scatter diagram b. A bar chart c. A pie chart d. A histogram Feedback The correct answer is: A scatter diagram Test 6 Which statistic is used to test hypotheses about individual regression coefficients? Select one: a. t-statistic b. z-statistic c. Χ2 (chi-square statistic) d. F Feedback The correct answer is: t-statistic Question 2 Incorrect 0.00 points out of 4.60 Flag question Question text All other things being held constant, what is the change in the dependent variable for a unit change in X1 for the multiple regression equation: Ŷ = 5.2 + 6.3X1 - 7.1 X2? Select one: a. -7.1 b. +6.3 c. +5.2 d. +4.4 Feedback The correct answer is: +6.3 Question 3 Correct 4.60 points out of 4.60 Flag question Question text In multiple regression, a dummy variable is significantly related to the dependent variable when . Select one: a. The global test of the regression equation is rejected b. The test of the dummy variable's regression coefficient is rejected c. The dummy variable is correlated with other independent variables d. The dummy variable is coded as 2 or 3 Feedback The correct answer is: The test of the dummy variable's regression coefficient is rejected Question 4 Correct 4.60 points out of 4.60 Flag question Question text The best example of an alternate hypothesis for a global test of a multiple regression model is . Select one: a. H1: β1 = β2 = β3 = β4 = 0 b. H1: β1 ≠ β2 ≠ β3 ≠ β4 ≠ 0 c. H1: Not all the β's are equal to 0. d. If F is less than 20.00, then fail to reject. Feedback The correct answer is: H1: Not all the β's are equal to 0. Question 5 Incorrect 0.00 points out of 4.60 Flag question Question text The following correlations were computed as part of a multiple regression analysis that used education, job, and age to predict income. Which independent variable has the strongest association with the dependent variable? Select one: a. Income b. Age c. Education d. Job Feedback The correct answer is: Education Question 6 Incorrect 0.00 points out of 4.60 Flag question Question text In multiple regression analysis, a dummy variable is . Select one: a. An additional quantitative variable b. A nominal variable with three or more values c. A nominal variable with only two values d. A new regression coefficient Feedback The correct answer is: A nominal variable with only two values Question 7 Correct 4.60 points out of 4.60 Flag question Question text Multiple regression analysis is applied when analyzing the relationship between . Select one: a. An independent variable and several dependent variables b. A dependent variable and several independent variables c. Several dependent variables and several independent variables d. Several regression equations and a single sample Feedback The correct answer is: A dependent variable and several independent variables Question 8 Correct 4.60 points out of 4.60 Flag question Question text In multiple regression analysis, when the independent variables are highly correlated, this situation is called . Select one: a. Autocorrelation b. Multicollinearity c. Homoscedasticity d. Curvilinearity Feedback The correct answer is: Multicollinearity Question 9 Incorrect 0.00 points out of 4.60 Flag question Question text In an ANOVA table for a multiple regression analysis, the global test of significance is based on the . Select one: a. Treatment mean square divided by the error variation b. Block and error variation c. Treatment mean square and block mean square d. Regression mean square divided by the mean square error Feedback The correct answer is: Regression mean square divided by the mean square error Question 10 Correct 4.60 points out of 4.60 Flag question Question text The coefficient of determination measures the proportion of . Select one: a. Explained variation relative to total variation b. Variation due to the relationship among variables c. Error variation relative to total variation d. Variation due to regression Feedback The correct answer is: Explained variation relative to total variation Question 11 Incorrect 0.00 points out of 4.60 Flag question Question text A manager at a local bank analyzed the relationship between monthly salary and three independent variables: length of service (measured in months), gender (0 = female, 1 = male) and job type (0 = clerical, 1 = technical). The following ANOVA summarizes the regression results: Based on the hypothesis tests for the individual regression coefficients, . Select one: a. All the regression coefficients are not equal to zero b. "Job" is the only non-significant variable in the model c. The intercept is the only significant variable in the model d. "Service" is the only significant variable in the model Feedback The correct answer is: "Job" is the only non-significant variable in the model Question 12 Incorrect 0.00 points out of 4.60 Flag question Question text The following correlations were computed as part of a multiple regression analysis that used education, job, and age to predict income. Which is the dependent variable? Select one: a. Income b. Age c. Education d. Job Feedback The correct answer is: Income Question 13 Incorrect 0.00 points out of 4.60 Flag question Question text A recent study of the relationship between social activity and education for a sample of corporate executives showed the following results. The null hypothesis for the analysis is . Select one: a. There is no relationship between social activity and education. b. The correlation between social activity and education is zero. c. As social activity increases, education increases. d. The mean of social activity equals the mean of education. Feedback The correct answer is: There is no relationship between social activity and education. Question 14 Incorrect 0.00 points out of 4.60 Flag question Question text Recently, students in a marketing research class were interested in the driving behavior of students. Specifically, the marketing students were interested in finding out if exceeding the speed limit was related to gender. They collected the following responses from 100 randomly selected students: The null hypothesis for the analysis is . Select one: a. There is no relationship between gender and speeding b. The correlation between driving behavior and gender is zero c. As driving behavior increases, gender increases d. The mean of driving behavior equals the mean of gender Feedback The correct answer is: There is no relationship between gender and speeding Question 15 Correct 4.60 points out of 4.60 Flag question Question text Three new colors have been proposed for the Jeep Grand Cherokee vehicle. They are silvered- blue, almond, and willow green. The null hypothesis for a goodness-of-fit test would be . Select one: a. That willow green is preferred over the other colors b. That there is no preference between the colors c. That any one color is preferred over the other colors d. Impossible to determine Feedback The correct answer is: That there is no preference between the colors Question 16 Correct 4.60 points out of 4.60 Flag question Question text Recently, students in a marketing research class were interested in the driving behavior of students. Specifically, the marketing students were interested in finding out if exceeding the speed limit was related to social activity. They collected the following responses from 100 randomly selected students: What is the value of the test statistic? Select one: a. 83.67 b. 9.890 c. 50 d. 4.94 Feedback The correct answer is: 9.890 Question 17 Correct 4.60 points out of 4.60 Flag question Question text A frequency distribution has a mean of 200 and a standard deviation of 20. The class limits for one class are 220 up to 240. Based on the normal distribution, what is the probability that an observation would be in this class? Select one: a. 0.1359 b. 0.3413 c. 0.4772 d. 0.8185 Feedback The correct answer is: 0.1359 Question 18 Correct 4.60 points out of 4.60 Flag question Question text Which of the following statements is correct regarding the chi-square distribution? Select one: a. The distribution is negatively skewed. b. Chi-square is based on two sets of degrees of freedom, one for the numerator and one for the denominator. c. The shape of the distribution is based on the degrees of freedom. d. The variance of the distribution is equal to one. Feedback The correct answer is: The shape of the distribution is based on the degrees of freedom. Question 19 Incorrect 0.00 points out of 4.60 Flag question Question text What is the decision regarding the differences between the observed and expected frequencies if the critical value of chi-square is 9.488 and the computed chi-square value is 6.079? Select one: a. Fail to reject the null hypothesis; the difference is probably due to sampling error. b. Reject the null hypothesis. c. Fail to reject the alternate hypothesis. d. Too close; reserve judgment. Feedback The correct answer is: Fail to reject the null hypothesis; the difference is probably due to sampling error. Question 20 Correct 4.60 points out of 4.60 Flag question Question text The computed chi-square value is positive because the difference between the observed and expected frequencies is . Select one: a. Squared b. Linear c. Uniform d. Always positive Feedback The correct answer is: Squared Question 21 Correct 4.60 points out of 4.60 Flag question Question text A personnel manager is concerned about absenteeism. She decides to sample employee records to determine if absenteeism is distributed evenly throughout the six-day workweek. The null hypothesis is: Absenteeism is distributed evenly throughout the week. The 0.01 level is to be used. The sample results are: What is the expected frequency? Select one: a. 9 b. 10 c. 11 d. 12 Feedback The correct answer is: 10 Question 22 Incorrect 0.00 points out of 4.60 Flag question Question text Recently, students in a marketing research class were interested in the driving behavior of students. Specifically, the marketing students were interested in finding out if exceeding the speed limit was related to social activity. They collected the following responses from 100 randomly selected students: The degrees of freedom for the analysis are . Select one: a. 1 b. 2 c. 3 d. 4 Feedback The correct answer is: 1 Question 23 Incorrect 0.00 points out of 4.60 Flag question Question text To test if an observed frequency distribution with five classes is normally distributed, we compute probabilities for each class based on a(n) . Select one: a. Standard normal distribution b. Chi-square distribution c. Student's t distribution d. F distribution Feedback The correct answer is: Standard normal distribution Question 24 Incorrect 0.00 points out of 4.60 Flag question Question text A sample of 100 production workers is obtained. The workers are classified by gender (male, female) and by age (under 20, 20-29, 30-39, and 40 or over). How many degrees of freedom are there? Select one: a. 0 b. 3 c. 6 d. 5 Feedback The correct answer is: 3 Question 25 Correct 4.60 points out of 4.60 Flag question Question text A recent study of the relationship between social activity and education for a sample of corporate executives showed the following results. What is the value of the chi-square test statistic? Select one: a. 100 b. 83.67 c. 50 d. 4.94 Feedback The correct answer is: 83.67 Finish review Skip Quiz navigation [Show More]
Last updated: 1 year ago
Preview 1 out of 151 pages
Instant download
Buy this document to get the full access instantly
Instant Download Access after purchase
Add to cartInstant download
Reviews( 0 )
Document information
Connected school, study & course
About the document
Uploaded On
Nov 13, 2021
Number of pages
151
Written in

Additional information
This document has been written for:
Uploaded
Nov 13, 2021
Downloads
0
Views
183