Chemistry > EXAM > ECET220 Lab 6 –Filters and Oscillators 2020 solution docx university of berkely california (All)
ECET220 Lab 6 –Filters and Oscillators 2020 solution docx university of berkely california
Document Content and Description Below
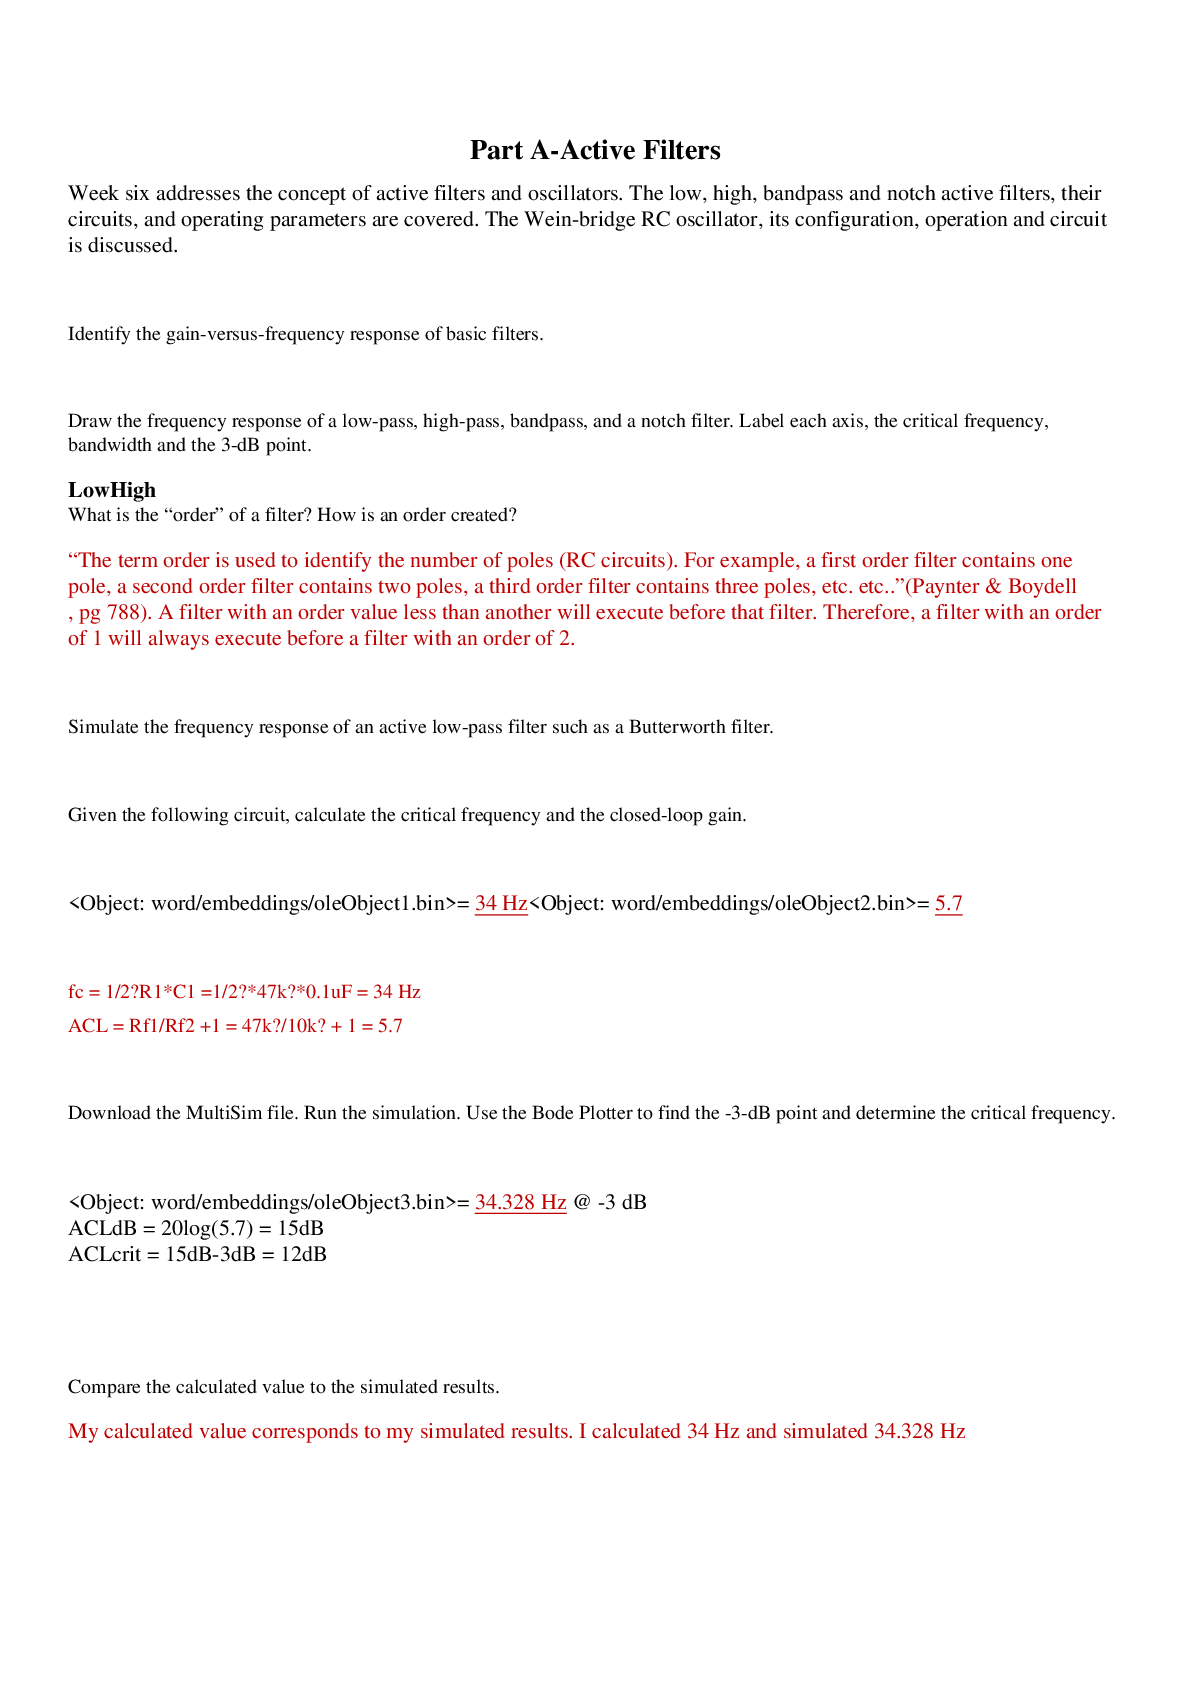
ECET220 Lab 6 –Filters and Oscillators 2020 solution docx university of berkely california Part A-Active Filters Week six addresses the concept of active filters and oscillators. The low, hig... h, bandpass and notch active filters, their circuits, and operating parameters are covered. The Wein-bridge RC oscillator, its configuration, operation and circuit is discussed. A. Identify the gain-versus-frequency response of basic filters. a. Draw the frequency response of a low-pass, high-pass, bandpass, and a notch filter. Label each axis, the critical frequency, bandwidth and the 3-dB point. Low High b. What is the “order” of a filter? How is an order created? B. Simulate the frequency response of an active low-pass filter such as a Butterworth filter. a. Given the following circuit, calculate the critical frequency and the closed-loop gain. = = b. Download the MultiSim file. Run the simulation. Use the Bode Plotter to find the -3-dB point and determine the critical frequency. = @ -3 dB ACLdB = 20log(5.7) = 15dB ACLcrit = 15dB-3dB = 12dB c. Compare the calculated value to the simulated results. C. Prototype the active single-pole low-pass filter and measure and sketch its frequency response, compare and contrast the simulated and measured results. a. Prototype the active single-pole low-pass filter in the diagram above using a LM741 op-amp. b. Connect a frequency generator to the input of the filter. Set the frequency generator’s output to a sine wave at 100 mV peak and as close to 0 Hz as possible. c. Connect channel 1 of an oscilloscope to the input and channel 2 to the output of the filter. d. Vary the input frequency according to the chart below and record the input and output voltage in the table. Calculate the other values. Frequency (Hz) Input Voltage (peak) Output Voltage (peak) Gain Gain dB 1 10 100 1k 10k 100k 500k e. Using the Graph Paper.doc file located in Doc Sharing, week 6, plot the frequency response of the circuit. f. Locate for the filter. Compare its value to the calculated and simulate results. D. Simulate the frequency response of an active single-pole high-pass filter such as a Butterworth filter. a. Given the following circuit, calculate the critical frequency and the closed-loop gain. = = b. Download the MultiSim file. Run the simulation. Use the Bode Plotter to find the -3-dB point and determine the critical frequency. = @ -3 dB ACLdB = 20log(2) = 6dB ACLcrit = 6dB-3dB = 3dB c. Compare the calculated value to the simulated results. E. Prototype the active single-pole high-pass filter. Measures and sketch its frequency response. Compare and contrast the simulated and measured results. a. Prototype the active single-pole high-pass filter in the diagram above using a LM741 op-amp. b. Connect a frequency generator to the input of the filter. Set the frequency generator’s output to a sine wave at 100 mV peak and as close to 0 Hz as possible. c. Connect channel 1 of an oscilloscope to the input and channel 2 to the output of the filter. d. Vary the input frequency according to the chart below and record the input and output voltage in the table. Calculate the other values. Frequency (Hz) Input Voltage (peak) Output Voltage (peak) Gain Gain dB 1 10 100 1k 10k 100k 500k e. Using the Graph Paper.doc file located in Doc Sharing, week 6, plot the frequency response of the circuit. f. Locate for the filter. Compare its value to the calculated and simulate results. F. The active two-pole band-pass filter below consists of a low-pass and a high-pass filter. Predict the critical frequencies. a. Given the following circuit, calculate the critical frequencies and the closed-loop gain. = = = b. Download the MultiSim file and run the simulation. Use the Bode Plotter to find the -3-dB point and determine the critical frequencies. = @ -3 dB; = @-3dB ACLdB = 20log(1.6) = 4dB 4dB*4dB = 16dB Fc1 Fc2 Center Frequency c. Compare the calculated value to the simulated results. G. Prototype the active two-pole band-pass filter consisting of a low-pass and a high-pass filter and predict the critical frequencies. Compare the results with the simulated values. a. Prototype the active single-pole band-pass filter in the diagram above using a LM741 op-amp. b. Connect a frequency generator to the input of the filter. Set the frequency generator’s output to a sine wave at 100 mV peak and as close to 0 Hz as possible. c. Connect channel 1 of an oscilloscope to the input and channel 2 to the output of the filter. d. Vary the input frequency according to the chart below and record the input and output voltage in the table. Calculate the other values. Frequency (Hz) Input Voltage (peak) Output Voltage (peak) Gain Gain dB 1 10 100 1k 10k 100k 500k e. Using the Graph Paper.doc file located in Doc Sharing, week 6, plot the frequency response of the circuit. f. Determine , , and the bandwidth for the filter. Compare its value to the calculated and simulate results. H. Explain the operation of a notch filter. a. Explain the operation of a notch filter. b. Draw the frequency response curve for a notch filter. Part B- Oscillators A. Relate the principles of an oscillator using a block diagram and explain Barkhausen criteria. a. Draw a block diagram of an oscillator. b. Explain the relationship between feedback, phase shift and oscillation c. What is Barkhausen criterion? d. What three conditions must be met for oscillation to occur? B. Calculate and analyze the operation of an oscillator using RC feedback, such as a Wien-bridge oscillator. a. Given the Wien-bridge oscillator in the diagram below, calculate the resonant frequency. Assume = 0. = _ b. Determine the closed-loop gain. = C. Simulate an RC feedback oscillator, such as a Wien-bridge. Record the oscillation frequency and compare the results with the calculated values. a. Download the MultiSim file. Run the simulation. Use the oscilloscope to determine the resonant frequency. Adjust if necessary to obtain oscillation. = b. Compare the calculated value to the simulated results. D. Prototype the RC feedback oscillator, such as a Wien-bridge. Measure the frequency of oscillation and compare the results with the calculated and simulated results. a. Prototype the Wien-bridge oscillator in the diagram above using a LM741 op-amp. b. Connect an oscilloscope to the output. Apply power and measure the resonant frequency. Adjust as necessary to obtain oscillation. c. Compare the measured values to the calculated and simulated results. d. Connect a speaker to the output and observe the results. e. Substitute different values for and/or and observer the results. Part C-Filters and Oscillator Simulations 1. The circuit below is a two-pole high-pass Butterworth filter. The upper critical frequency should be 1.12kHz. Find the required value for R4 and the closed loop gain. Verify the circuit operation in Multisim. Make the necessary changes to the circuit and verify its operations. The R4 value should be; Acl = 2. Given the following circuit. What is the frequency of oscillation? What is the closed loop gain? = 1.06kHz = 14 At what value of does the output begin to clip?75% & 50Kohms= 28kOhms At what value of does oscillation stop? 29% it still sats 50K = 14.5kOhms Example Bandwidth calculations The bandwidth is defined as the: Power- ½ power points Voltage- .707 *Vmax Current- .707*Imax db- 3 db down from the max db level f (Hz) Gain Gain(Db) 1 56mV 320mV 5.71 15.1 10 64mV 320mV 5 14 100 112mV 1.28V 11.42 21.15 1k 112mV 1.28V 11.42 21.15 10k 160mV 1.20V 7.5 17.5 100k 3 9.54 If the above data were taken the bandwidth would be at: Since these are voltage gains .707*Vmax 11.42 *.707 = 8.1 After plotting the graph we need to go below 100 Hz and read the frequency that the gain is 8.1. This is f1 Then go above 1k until the gain is 8.1 and read that frequency. This is f2 Bandwidth = f2-f1 If it is in Db then the bandwidth would be at the 21.15DB-3Db or 18.15Db This should be the same points: Semilog Point Plotting Example This is semi log paper, note the bottom horizontal scale is frequency, and always gets 10 times larger on the next decade. There are no zeros on the graph. 10^0 = 1 so that is the first number, 10^1 = 10 so we jump from counting 1’s to counting 10’s, for example 1,2,3,4,5,6,7,8,9,10, 20,30 etc. The vertical scale is gain in decibels and uses a linear scale. The point plotted is a frequency of 10 hertz and a gain of 7 db. [Show More]
Last updated: 1 year ago
Preview 1 out of 17 pages
Reviews( 0 )
Document information
Connected school, study & course
About the document
Uploaded On
Oct 22, 2020
Number of pages
17
Written in
Additional information
This document has been written for:
Uploaded
Oct 22, 2020
Downloads
0
Views
58






.png)
