Mathematics > Solutions Guide > University of California, Los Angeles LIFESCIENC 30A. Homework 4 solutions (All)
University of California, Los Angeles LIFESCIENC 30A. Homework 4 solutions
Document Content and Description Below
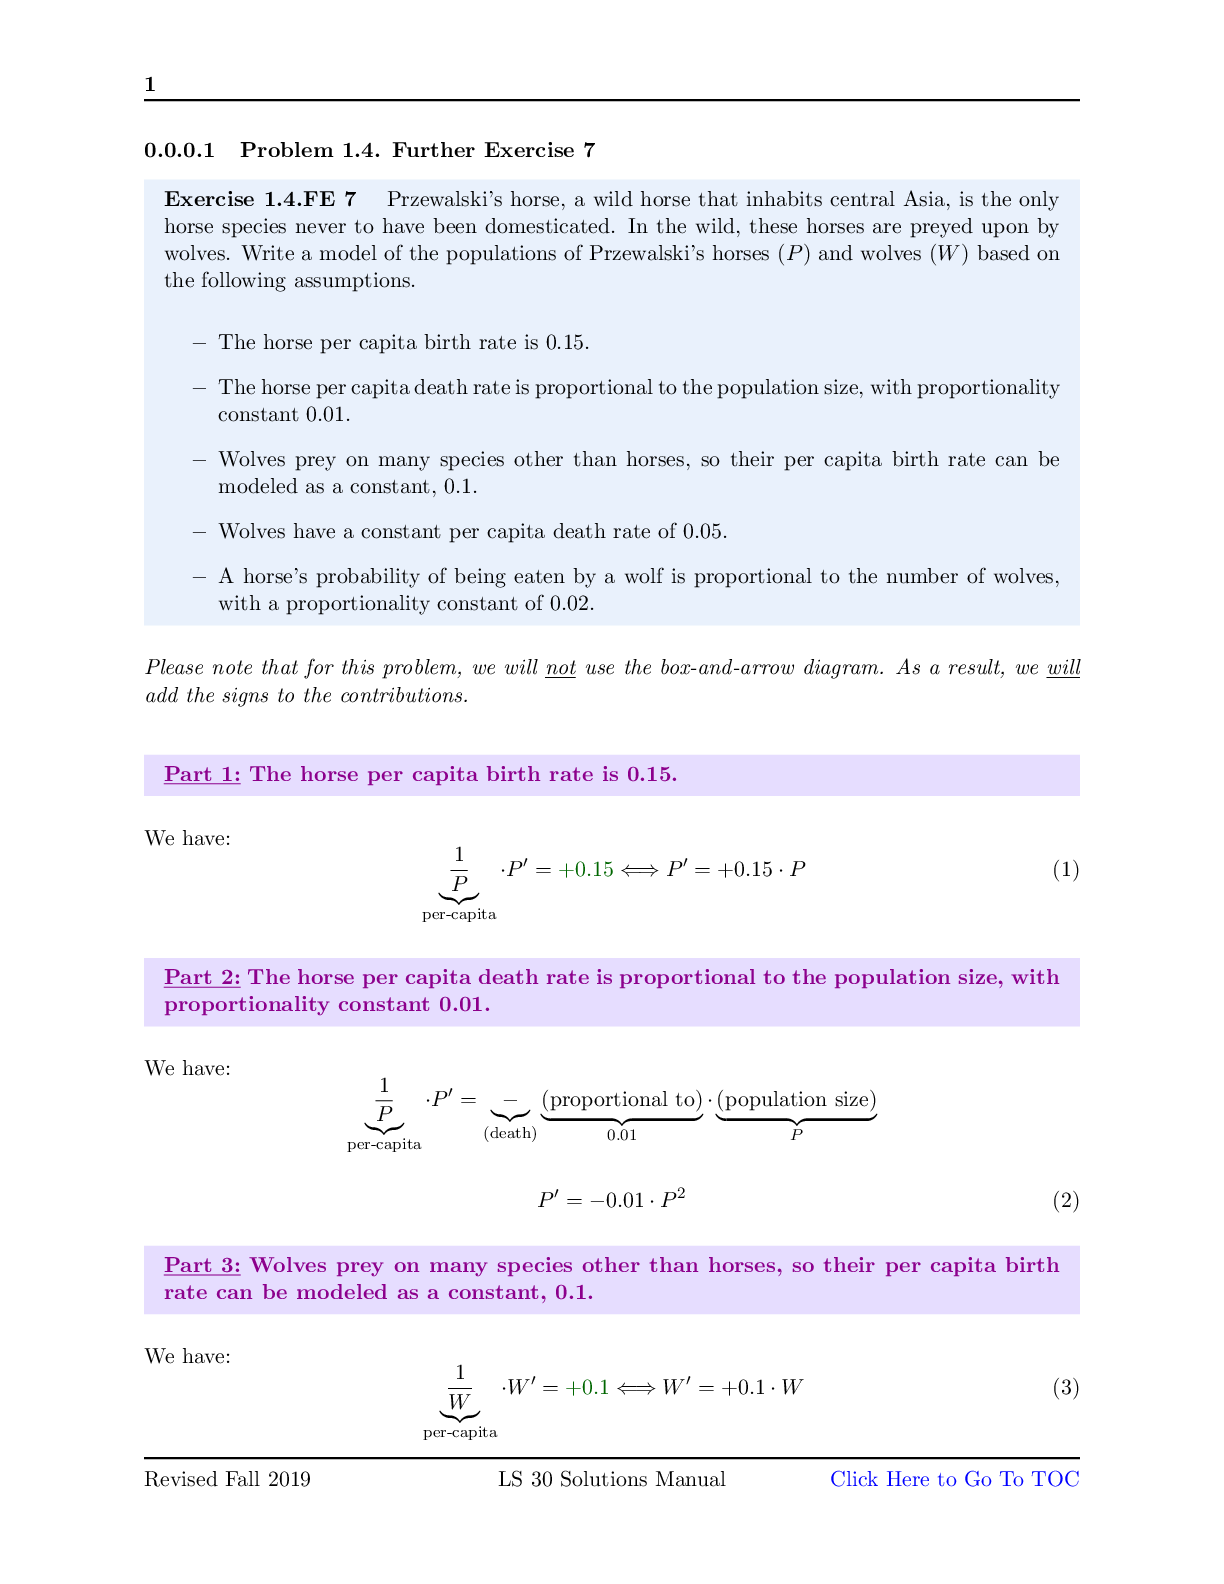
1 0.0.0.1 Problem 1.4. Further Exercise 7 Exercise 1.4.FE 7 Przewalski’s horse, a wild horse that inhabits central Asia, is the only horse species never to have been domesticated. In the wild, th... ese horses are preyed upon by wolves. Write a model of the populations of Przewalski’s horses (P) and wolves (W) based on the following assumptions. - The horse per capita birth rate is 0.15. - The horse per capita death rate is proportional to the population size, with proportionality constant 0.01. - Wolves prey on many species other than horses, so their per capita birth rate can be modeled as a constant, 0.1. - Wolves have a constant per capita death rate of 0.05. - A horse’s probability of being eaten by a wolf is proportional to the number of wolves, with a proportionality constant of 0.02. Please note that for this problem, we will not use the box-and-arrow diagram. As a result, we will add the signs to the contributions. Part 1: The horse per capita birth rate is 0.15. Part 2: The horse per capita death rate is proportional to the population size, with proportionality constant 0.01. Part 3: Wolves prey on many species other than horses, so their per capita birth rate can be modeled as a constant, 0.1. 2 Part 4: Wolves have a constant per capita death rate of 0.05. Part 5: A horse’s probability of being eaten by a wolf is proportional to the number of wolves, with a proportionality constant of 0.02. In this case, we are looking at the consumption of \horses" by \wolves", i.e. evaluating the effect of predation on P0. We know that each horse has a probability of being eaten that is proportional to the wolves population, with a proportionality constant of 0.02. Thus, we have a per-horse rate of change of P0: Combining equations (1) - (5), we have the following set of equations: 1 0.0.0.1 Problem 1.4. Further Exercise 10 Exercise 1.4.FE 10 A simple model of infectious disease spread is where v, m, p, q, and r are positive constants. The variables U, V , and W stand for susceptible population, infected (but not symptomatic) population, and symptomatic population (but not in that order). a) Which variable represents which population? Justify your answer., in the sense that it makes infected people fully recovered but not immune? Part a: Which variable represents which population? Justify your answer. V ≡ Susceptible; W ≡ Infected; U ≡ Symptomatic Part b1: How would you model a \safe-contact" program that reduced the probability of infection per encounter? r . Part b2: How would you model a drug that slowed the progression from infection to the appearance of symptoms (as AZT did for HIV/AIDS)? v . Part b3: How would you model a drug that cures the disease, in the sense that it makes infected people fully recovered but not immune? |{z} per-capita ·W 0 = -k () W 0 = -k · W Those who are cured will all become susceptible again (i.e. they don’t just drop out of the face of the Earth). Using the equation above, we see that k · W represents every patient who is cured Revised Fall 2019 LS 30 Solutions Manual (and needless to say, the number of patients need to be positive). Since they are now susceptible, we have another expression to add to V 0: V 0 = +k · W . 1 0.0.0.1 Problem 1.6. Further Exercise 1 Exercise 1.6.FE 1 This trajectory shows the hours a student studied per week during a quarter and that student’s GPA for that quarter. Describe what happened and sketch the appropriate time series plots. Based on these information, we have the following data (approximate). Since we do not have data regarding which week these values were collected at, it is okay to make up time points: 2 Our time series are therefore: Time Series for Study Hours: • Week on the x-axis • Study Hours on the y-axis Week Revised Fall 2019 LS 30 Solutions Manual 0.0.0.1 Problem 1.6. Further Exercise 2 Exercise 1.6.FE 2 Sketch the time series of a two-variable system whose trajectory is a single point. Let’s just make up a 2D-system right here to help visualize our discussion a little better. For a system consisting of X and Y where the trajectory is a single point, we have the following graph: As you can see, regardless of the t value, the X and Y values always stay at X0 and Y0, respectively. As a result, their time series will be horizontal lines that cut the axes at the designated values (X0 1 0.0.0.1 Problem 1.6. Further Exercise 3 Exercise 1.6.FE 3 This trajectory was generated by a simple model of an oscillator. Sketch the time series matching it. As we discussed earlier, since there is no visible time data given to us, you can decide how \slow" or \fast" a state is traveling through the trajectory. For example, for the system to go from (0:1; 0:2) to (-1; 0), two students can have the system reach the latter state at different time points (e.g. t = 10 and t = 100), and both are equally valid. You just have to be patient as you graph these to make sure that the coordinates are valid. The procedure is: pick a point ! find the X and Y value. Record that. Then move on to the next point that is close to the previous point (but all the points must belong on the trajectories). Find 2 If you are curious, this graph was generated using the \Phase Oscillator" class of mathematical model for the circadian clocks. You can read more about this model in Gonze’s paper, titled \Modeling Circadian Clocks: From Equations to Oscillations," Cent. Eur. J. Biol., 6(5), 2011, pg 699-711. Briefly, it is a model in polar coordinates, where: Revised Fall 2019 LS 30 Solutions Manual Click Here to Go To TOC 1 0.0.0.1 Problem 1.6. Further Exercise 7 Exercise 1.6.FE 7 How are a trajectory and a time series graph different? In particular, what are the axes of each? Which one can reasonably be drawn on top of a vector field? A time series is a 2D-graph, where you have time as a variable on the x-axis, and a state variable on the y-axis. Meanwhile, a trajectory is a nD-graph (where n 2 N), where you have a state variable represented on each axis. For the vector field, since their axes represent the values of the state variables, it is reasonable to concur that one can only draw trajectories on top of a vector field. Revised Fall 2019 LS 30 Solutions Manual 1 0.0.0.1 Problem 1.7.1 Revised Fall 2019 LS 30 Solutions Manual 1 0.0.0.1 Problem 1.7.2 Exercise 1.7.2 Use Euler’s method to compute two approximate trajectories for the logistic growth vector field X0 = 0:05X1 - 100 X (Please note that there is more than one possible set of solutions to this problem) In this case, we will compute our trajectories until we reach X5 using ∆t = 0:01. table: 0.0.0.1 Problem 1.7.3 Exercise 1.7.3 Compute the next values of S and T . In the paragraph right above, we just calculated a new set of (S; T) = (2:4; 2:7). We know that: 1 0.0.0.1 Problem 1.7. Further Exercise 1 Exercise 1.7.FE 1 The rate of change of a mouse population is given by the differential equation N0 = 0:5N 1 - N 1000! The population at t = 0 is 400. Using Euler’s method with a step size of 0.1, find the In this case, the first notation means the value of N at t = 3. Meanwhile, the second notation means the value of N on its third iteration. This may or may not mean at t = 3. If the step size is ∆t = 1, then by the third step, you will reach t = 3, hence N(t = 3) = N3 for ∆t = 1. However, let’s say that ∆t = 0:01, then by the third step, you only reach t = 0:03, and clearly N3 = N(t = 0:03) 6= N(t = 3) for ∆t 6= 1. To reach t = 0:3 in step size of ∆t = 0:1, we need to take 3 steps. Revised Fall 2019 LS 30 Solutions Manual 1 0.0.0.1 Problem 1.7. Further Exercise 2 Exercise 1.7.FE 2 The growth rate of a hunted lion population, L, is given by the differential equation L0 = 0:1L 1 - L 100! - 0:2L The current population is 80 lions. Using Euler’s method with a step size of 0.1 years, find the (approximate) population 0.2 years later. To reach t = 0:2 in step size of ∆t = 0:1, we need to take 2 steps. Thus, the approximate hunted lion population, L, at t = 0:2 is Revised Fall 2019 LS 30 Solutions Manual 1 0.0.0.1 Problem 2.2.1 Exercise 2.2.1 A bowling lane is 60 feet long. If a bowling ball is released at t = 0 and reaches the pins 2.5 seconds later, what is its average speed? The bowling ball’s average speed is: next hour? It will travel 30 miles in the next hour if and only if: 1. It keeps that same speed (i.e. 30 mi/h) constantly for the next hour, OR 2. Its average speed for the next hour is 30 mi/h (e.g. 30 mi/h for the first 20 minutes, 40 mi/h for the next 20 minutes, and 20 mi/h for the last 20 minutes). Otherwise, due to the variation in instantaneous speed (depending on its acceleration/deceleration at any moment), it is extremely unlikely for the object to travel 30 miles in the next hour. Revised Fall 2019 LS 30 Solutions Manual [Show More]
Last updated: 1 year ago
Preview 1 out of 21 pages
Reviews( 0 )
Recommended For You
Mathematics> Solutions Guide > University of California, Los Angeles LIFESCIENC 30A. Homework 8 Solutions. All Excercises (All)
University of California, Los Angeles LIFESCIENC 30A. Homework 8 Solutions. All Excercises
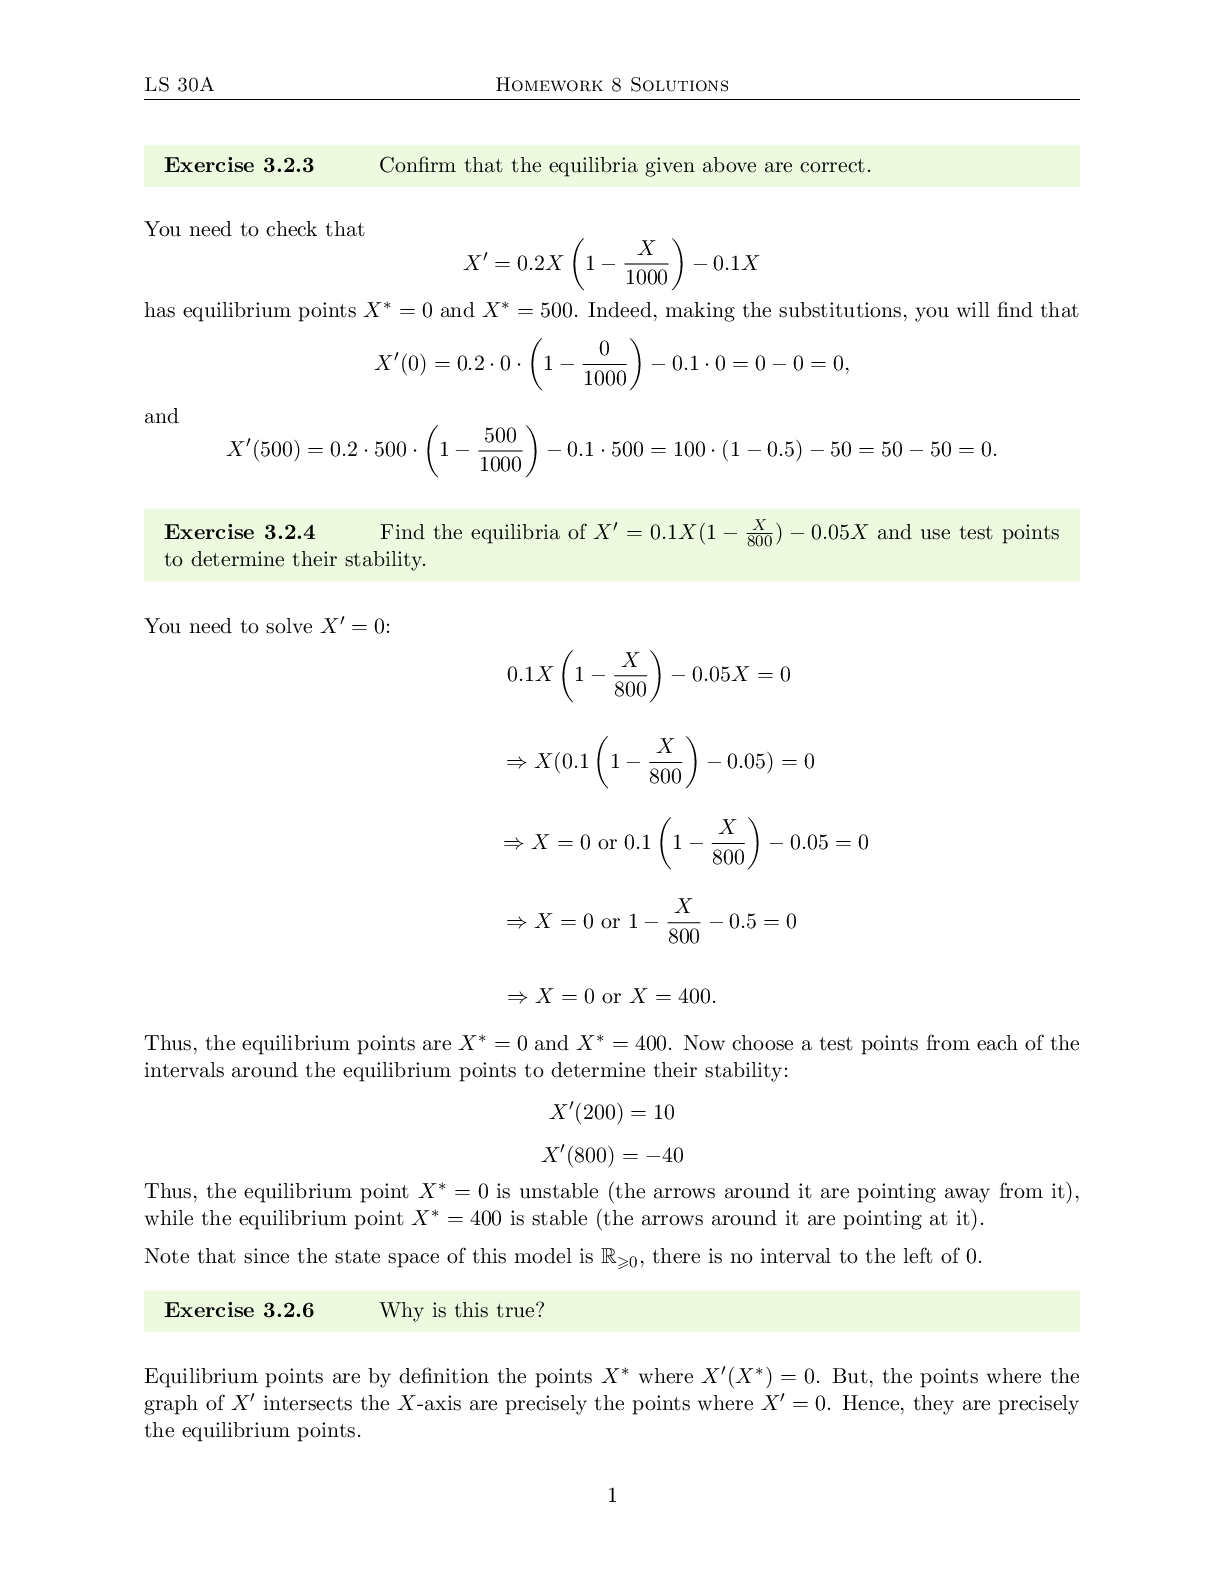
LS 30A Homework 8 Solutions Exercise 3.2.3 Confirm that the equilibria given above are correct. You need to check that Exercise 3.2.4 Find the equilibria of X0 = 0:1X(1 - 800 X ) - 0:05X and use...
By Kirsch , Uploaded: Apr 12, 2022
$9
Mathematics> Solutions Guide > University of California, Los Angeles LIFESCIENC 30A. Homework 7 Solutions. All Exercises. (All)
University of California, Los Angeles LIFESCIENC 30A. Homework 7 Solutions. All Exercises.
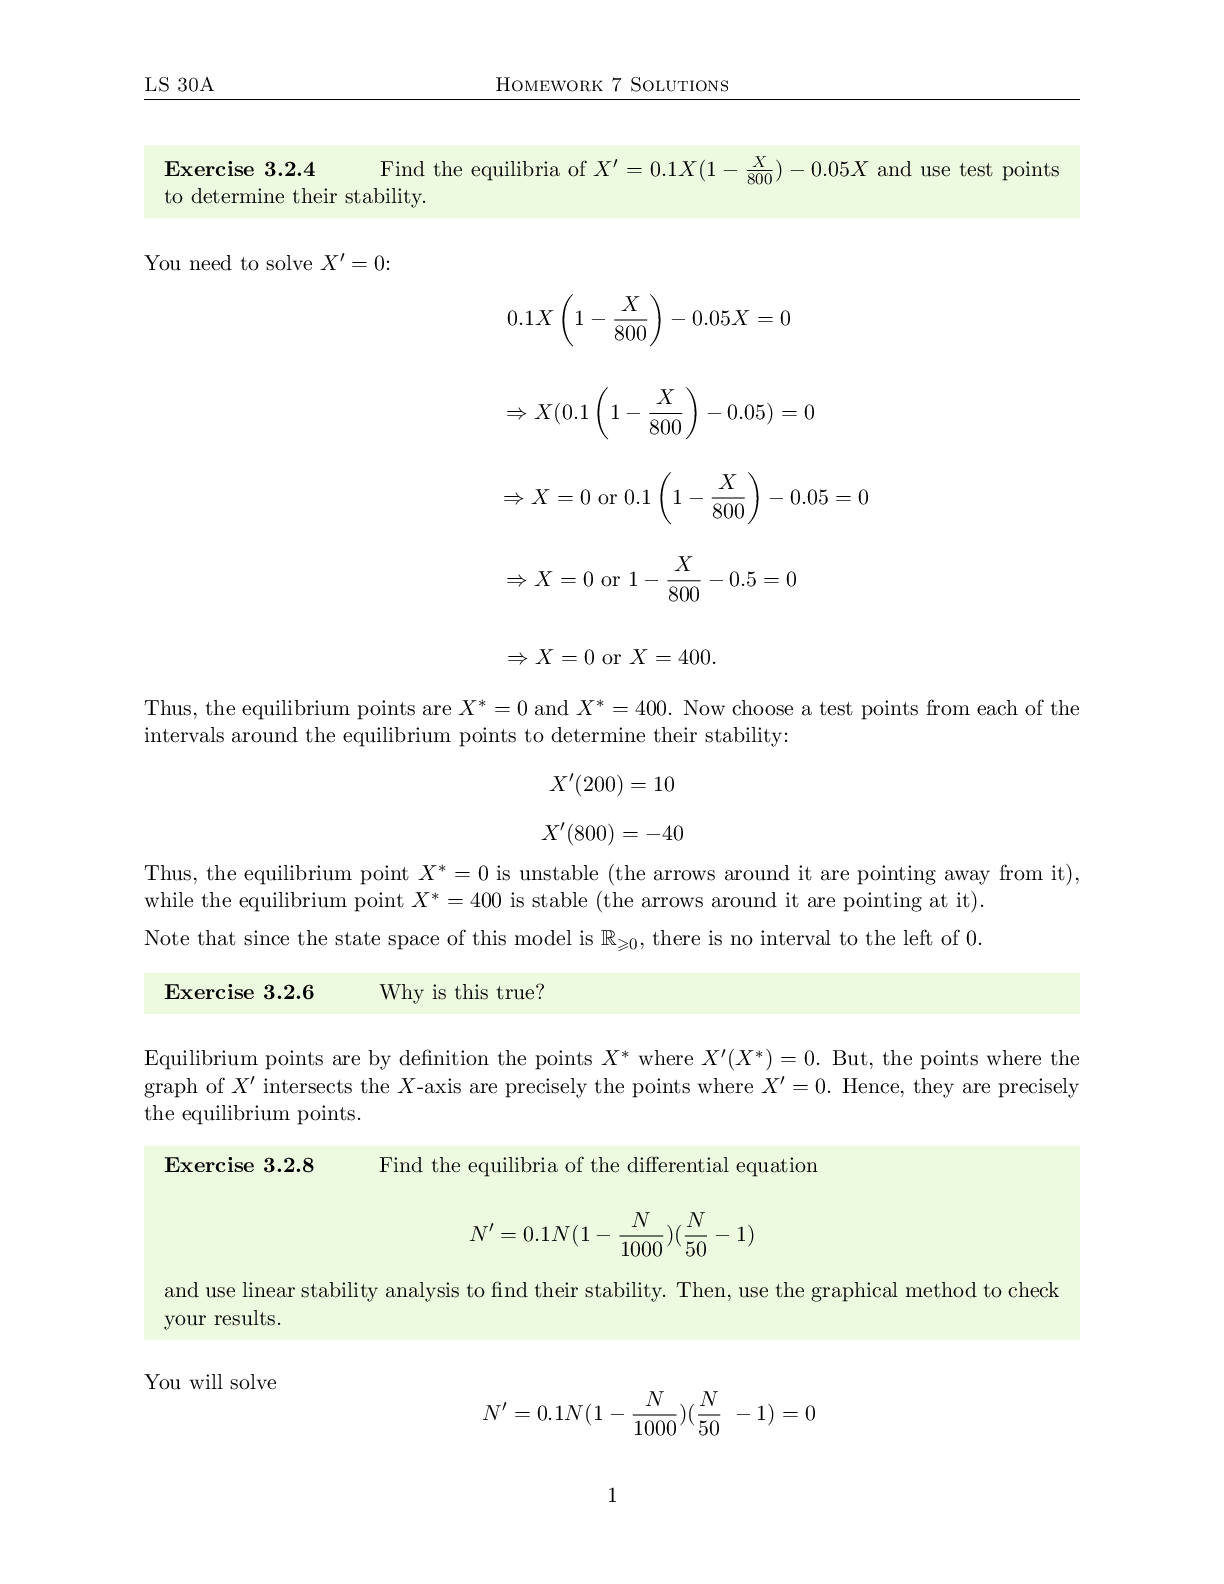
LS 30A Homework 7 Solutions Exercise 3.2.4 Find the equilibria of X0 = 0:1X(1 - 800 X ) - 0:05X and use test points to determine their stability. You need to solve X0 = 0: Thus, the equilibrium...
By Kirsch , Uploaded: Apr 12, 2022
$9
Mathematics> Solutions Guide > University of California, Los Angeles LIFESCIENC 30A. Homework 6 Solutions. All Exercises. (All)
.png)
University of California, Los Angeles LIFESCIENC 30A. Homework 6 Solutions. All Exercises.
Homework 6 LIFESCIENC 30A. Homework 6 Solutions. A FE 4: Mary is going to have an outdoor party in 10 days. She wants to have her backyard pond covered in water lilies before the party, so she goe...
By Kirsch , Uploaded: Apr 13, 2022
$9
Mathematics> Solutions Guide > University of California, Los Angeles LIFESCIENC 30A. Homework 3 solutions. All Excercises. (All)
University of California, Los Angeles LIFESCIENC 30A. Homework 3 solutions. All Excercises.
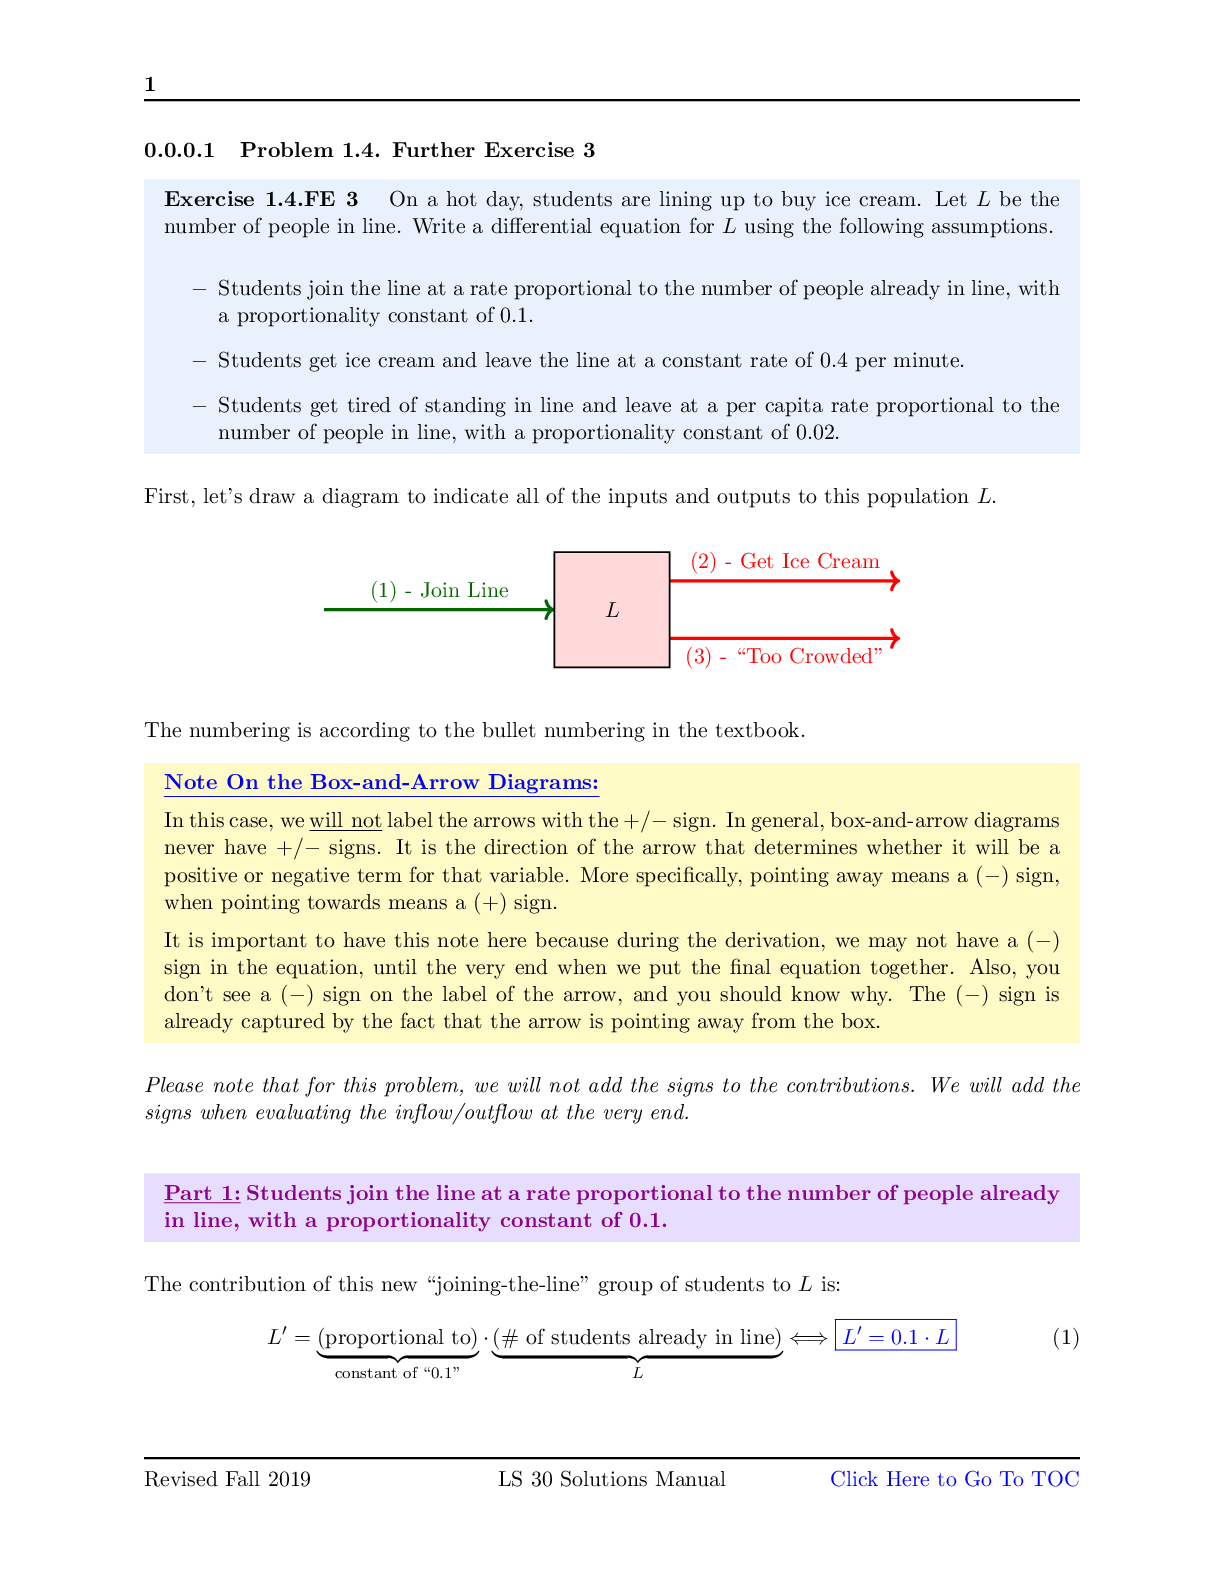
1 0.0.0.1 Problem 1.4. Further Exercise 3 Exercise 1.4.FE 3 On a hot day, students are lining up to buy ice cream. Let L be the number of people in line. Write a differential equation for L using t...
By Kirsch , Uploaded: Apr 13, 2022
$9
Mathematics> Solutions Guide > University of California, Los Angeles LIFESCIENC 30A. Midterm1 Solutions. (All)
University of California, Los Angeles LIFESCIENC 30A. Midterm1 Solutions.
A. Jaroszewicz LS 30A, Lec. 2 Mon, Jan 27, 2020 Midterm 1 Version A Name: Student ID: By signing below, you a!rm that you have neither given nor received unauthorized help on this exam. Signatu...
By Kirsch , Uploaded: Apr 13, 2022
$13
Mathematics> Solutions Guide > University of California, Los Angeles LIFESCIENC 30A. LS30A MATHEMATICS FOR LIFE SCIENTISTS-1 F-17 Final Exam Solutions. (All)
University of California, Los Angeles LIFESCIENC 30A. LS30A MATHEMATICS FOR LIFE SCIENTISTS-1 F-17 Final Exam Solutions.
LS 30A: MATHEMATICS FOR LIFE SCIENTISTS FALL 2017 - LECTURE 1 Jukka Keranen FINAL EXAMINATION SOLUTIONS Your Name Your Student ID number Your TA Section By signing below, you confirm that you d...
By Kirsch , Uploaded: Apr 13, 2022
$13
Mathematics> Solutions Guide > University of California, Los Angeles LIFESCIENC 30A. LS30A MATHEMATICS FOR LIFE SCIENTISTS. S Venugopal LS 30A (Spring 2020) June 08, 2020 Final Exam. Solutions (All)
University of California, Los Angeles LIFESCIENC 30A. LS30A MATHEMATICS FOR LIFE SCIENTISTS. S Venugopal LS 30A (Spring 2020) June 08, 2020 Final Exam. Solutions
S Venugopal LS 30ACS Venugopal LS 30A (Spring 2020) June 08, 2020 Final Exam Use dark colored pen only to write your answers. Duration of the exam: 6:30 PM PDT, Monday, June 8, 2020 TO 6:30 PM PD...
By Kirsch , Uploaded: Apr 13, 2022
$12
Mathematics> Solutions Guide > University of California, Los Angeles LIFESCIENC 30A. LS30A Summer Session A 2021 Final Exam Solutions. (All)

University of California, Los Angeles LIFESCIENC 30A. LS30A Summer Session A 2021 Final Exam Solutions.
S Venugopal LS 30A (Summer 2021) July 30, 2021 Final Exam Name (Last, First): Last 4 digits of UID: Use dark colored pen only to write your answers. Alternatively, if you are using a tablet...
By Kirsch , Uploaded: Apr 13, 2022
$13
Mathematics> Solutions Guide > University of California, Los Angeles LIFESCIENC 30A. LS 30A-1 Homework 7 Solutions. 48 Solutions (All)
University of California, Los Angeles LIFESCIENC 30A. LS 30A-1 Homework 7 Solutions. 48 Solutions
University of California, Los Angeles LIFESCIENC 30A. LS 30A-1 Homework 7 Solutions. 48 Solutions University of California, Los Angeles LIFESCIENC 30A. LS 30A-1 Homework 7 Solutions. 48 Solutions Univ...
By Kirsch , Uploaded: Apr 12, 2022
$10
Mathematics> Solutions Guide > University of California, Los Angeles LIFESCIENC 30A. LS 30A-1 Homework 9 Solutions. 48 Solutions. Total points: 98 (All)
University of California, Los Angeles LIFESCIENC 30A. LS 30A-1 Homework 9 Solutions. 48 Solutions. Total points: 98
Homework 9 Solutions Total points: 98 Section 3.2 Further Exercises FE 3.2.5 (4 pts, 2 pts each) FE 3.2.7 (2 pts) It is not possible for a one-dimensional system to have two stable equilibria...
By Kirsch , Uploaded: Apr 12, 2022
$11
Document information
Connected school, study & course
About the document
Uploaded On
Apr 13, 2022
Number of pages
21
Written in

Additional information
This document has been written for:
Uploaded
Apr 13, 2022
Downloads
0
Views
64