Mathematics > Solutions Guide > University of California, Los Angeles LIFESCIENC 30A. Homework 3 solutions. All Excercises. (All)
University of California, Los Angeles LIFESCIENC 30A. Homework 3 solutions. All Excercises.
Document Content and Description Below
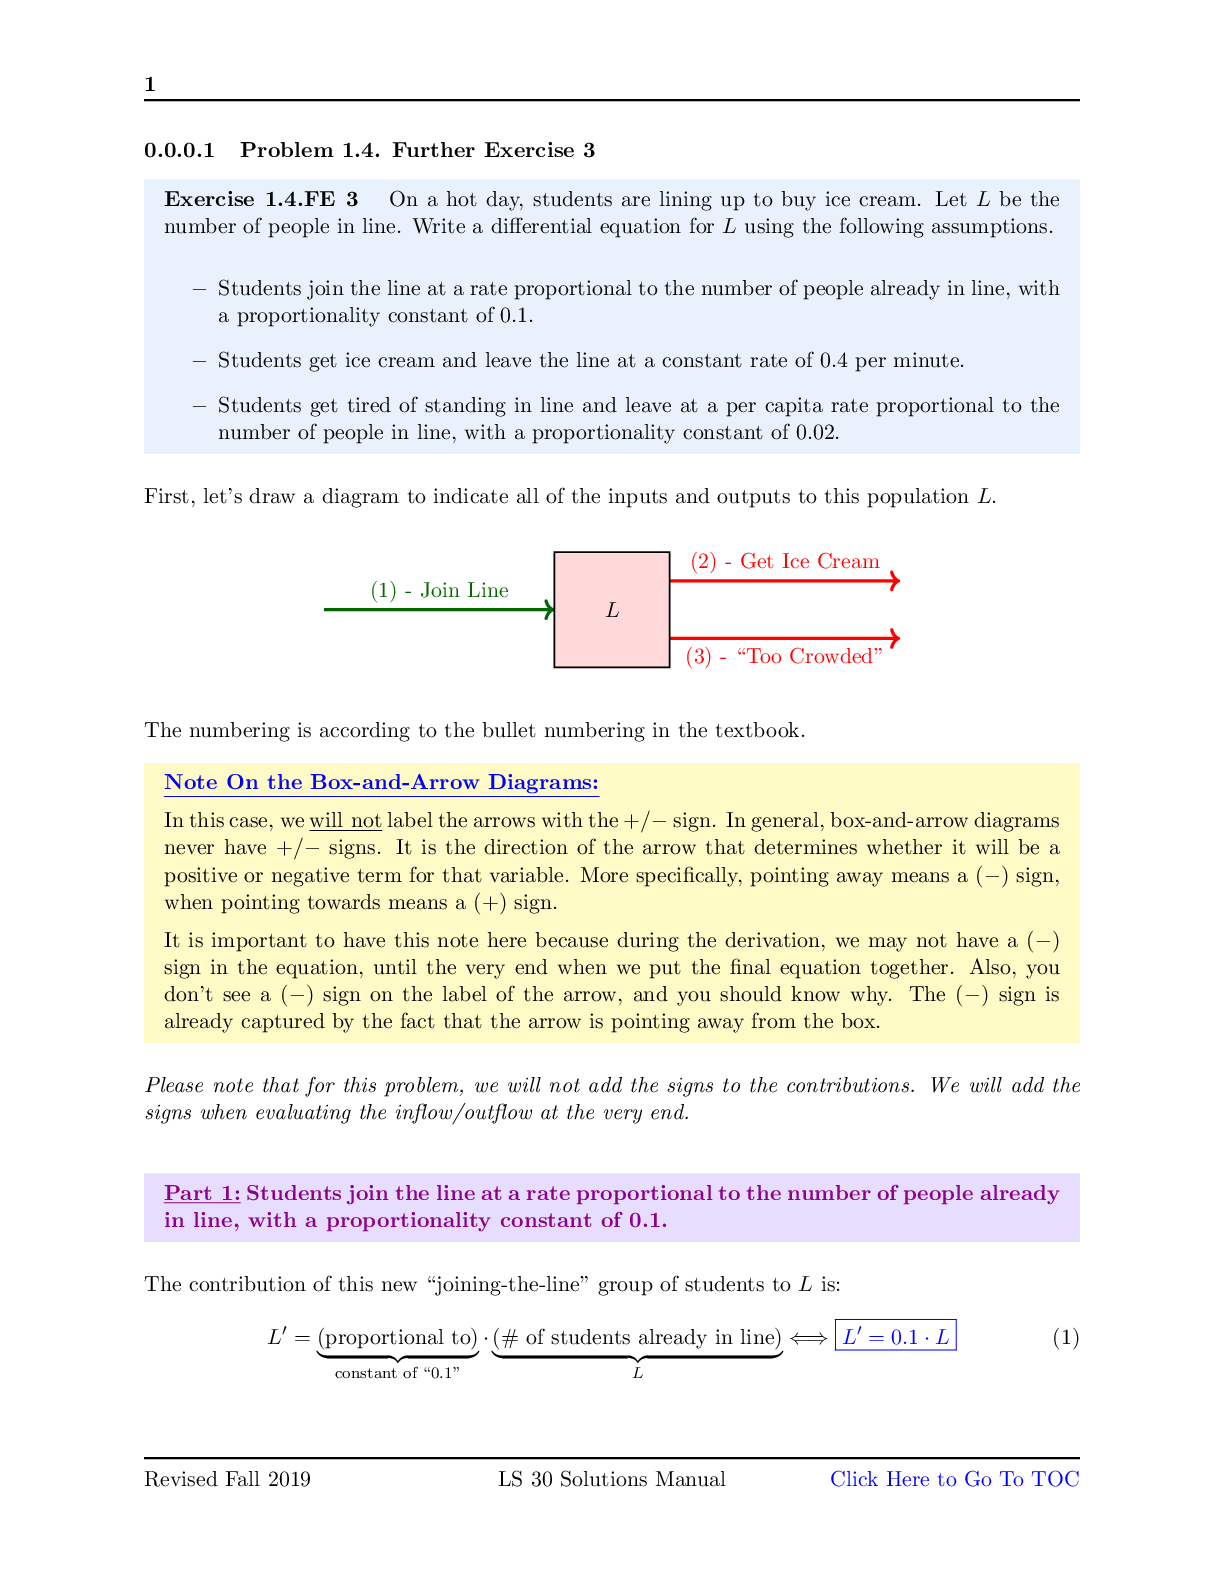
1 0.0.0.1 Problem 1.4. Further Exercise 3 Exercise 1.4.FE 3 On a hot day, students are lining up to buy ice cream. Let L be the number of people in line. Write a differential equation for L using t... he following assumptions. - at a per capita rate proportional to the number of people in line, with a proportionality constant of 0.02. Note On the Box-and-Arrow Diagrams: In this case, we will not label the arrows with the +=- sign. In general, box-and-arrow diagrams never have +=- signs. It is the direction of the arrow that determines whether it will be a positive or negative term for that variable. More specifically, pointing away means a (-) sign, when pointing towards means a (+) sign. It is important to have this note here because during the derivation, we may not have a (-) Part 1: Students join the line at a rate proportional to the number of people already in line, with a proportionality constant of 0.1. The contribution of this new \joining-the-line" group of students to L is: 2 Part 2: Students get ice cream and leave the line at a constant rate of 0.4 per minute. The contribution of this \got-ice-cream-and-leave" group of students to L is: Part 3: Students get tired of standing in line and leave at a per capita rate proportional to the number of people in line, with a proportionality constant of 0.02. Putting Things Together: 1 0.0.0.1 Problem 1.4. Further Exercise 4 Exercise 1.4.FE 4 Collagen is a key protein in connective tissues. One of the steps in collagen formation involves the combination of three molecules of a collagen precursor called propeptide. This occurs with rate constant k. The rate of formation of propeptide is a constant, f. The propeptide also degrades with per molecule degradation rate d. Write a differential equation for the concentration of propeptide, P. Let’s draw the following diagram. Formation P Degradation Combination Please note that for this problem, we will not add the signs to the contributions. We will add the signs when evaluating the inflow/outflow at the very end. Combination of Propeptides: We know that: \One of the steps in collagen formation involves the combination of three molecules of a collagen precursor called propeptide. This occurs with rate constant k." This is similar to writing the following chemical reaction: 3P -!k Collagen Thus, the contribution from this step to P 0 is: Formation of Propeptides: 2 Degradation of Propeptides: We know that: \The propeptide also degrades with per molecule degradation rate d." Thus, the contribution from this step to P 0 is: 1 P with the equations (1), (2), and (3) that we just obtained. From here, we can put together our final equation: Revised Fall 2019 LS 30 Solutions Manual 1 0.0.0.1 Problem 1.4. Further Exercise 6 Exercise 1.4.FE 6 Spotted owls (W) prey almost exclusively on red-backed voles (V ). Use the following assumptions to write a differential equation model of this system. - The vole population has a per capita birth rate of 0.1 and a per capita death rate of 0.025. - The rate at which an individual owl eats voles is proportional to the vole population with a proportionality constant of 0.01. not use the box-and-arrow diagram. As a result, we will add the signs to the contributions. Part 1: The vole population has a per capita birth rate of 0.1 and a per capita death rate of 0.025. Contribution from Birth to V 0: We have: Part 2: The rate at which an individual owl eats voles is proportional to the vole population with a proportionality constant of 0.01. In this case, we are looking at the consumption of \voles" by \owls", i.e. evaluating the effect of predation on V 0. We know that each owl eats voles at a rate proportional to the vole population, Revised Fall 2019 LS 30 Solutions Manual 2 with a proportionality constant of 0.01. Thus, we have a per-owl rate of change of V 0: Part 3: The owl birth rate is proportional to the amount of food they consume, with a proportionality constant of 0.05. From equation (1.2), we can clearly see that the amount of food (i.e. voles) being consumed is: 0:01 · V · W. It is important to note that the amount of food is always a positive number (e.g. you eat \2 sandwiches", and not \-2 sandwiches"). We had a negative sign for equation (1.2) to reflect that the number of \food" is decreasing. Thus, we have the following equation for the contribution of \food consumption" to W 0: W 0 = + |{z} Part 4: Owls have a constant per capita death rate of 0.1. per-capita ·W 0 = -0:1 () W 0 = -0:1 · W (4) Putting Things Together: Combining equations (1), (2), (3), and (4), we have the following set of equations: Manual 1 0.0.0.1 Problem 1.5.3 The vector field, roughy sketching is: R J Now, we can fill in the rest of the graph by either following the trends of the vectors or computing the vectors at more point. Our \more completed" vector field will look like as follows (note that we also scale the vectors a little bit to fit everything nicely onto our 2D xy-plane): Revised Fall 2019 LS 30 Solutions Manual 2 R J Revised Fall 2019 LS 30 Solutions Manual 1 0.0.0.1 Problem 1.5.4 Exercise 1.5.4 If X0 = Y and Y 0 = X, what change vector is associated with the point 1 0.0.0.1 Problem 1.5.5 1 0.0.0.1 Problem 1.5. Further Exercise 2 Exercise 1.5.FE 2 Romeo and Juliet are in a relationship. R represents Romeo’s love (or if negative, hate) for Juliet, and J represents Juliet’s love or hate for Romeo. Suppose that both Romeo’s and Juliet’s feelings are affected by both their own and the other person’s feelings in exactly the same way: Let a = 0:5 and b = 1:25. Plug in numbers to sketch the vector field of this system (include your calculations). Then, describe its behavior. Let’s start with picking one point from each quadrant, we can compute the change vector for the following points: The vector field, roughy sketched is: R J Revised Fall 2019 LS 30 Solutions Manual 2 Now, we can fill in the rest of the graph by either following the trends of the vectors or computing the vectors at more point. Our \more completed" vector field will look like as follows (note that we also scale the vectors a little bit to fit everything nicely onto our 2D xy-plane): R 0.0.0.1 Problem 1.2.1 Exercise 1.2.1 Come up with two more everyday examples of functions. Briefly explain what makes each example a function. Please note that there is more than one acceptable set of answers to this question. However, it is important to clarify the following misconception. A Common Misconception: It is to note that for something to be a function, it must mean that for EACH INPUT, there is EXACTLY ONE OUTPUT. However, this statement does NOT mean that two inputs cannot have the same output. Example #1: The light switch A function can be as simple as only having two possible inputs, just like the light switch. Depending on how the electrician sets it up, we can have the following combinations: Example #2: The piano/keyboard In this case, we know that for each key that we presses, there will be a distinct sound emitted from the piano with a specific frequency. For example, the A4 key will emit a sound at the 440Hz frequency. Meanwhile, the C4 and G4 keys will emit sounds at the 261:6Hz and 392:0Hz frequencies, 0.0.0.1 Problem 1.2.2 Exercise 1.2.2 Modify the menu in Figure 1.11 so it no longer depicts a function. Recall the following definition for a function: For EACH INPUT, there is EXACTLY ONE OUTPUT. Thus, to make the menu in Figure 1.11 no longer a function, we only have to do one of the two Let’s say that we decide to modify the menu for the beverage of CAPPUCCINO. In this case, there exists one INPUT (CAPPUCCINO), which have more than one OUTPUT ($3.45 and $4.45) associated with it. As a result, the menu is no longer a function. A Common Error: Some people feel inclined to add the size of the drink to the menu, like this: This answer does NOT make the menu no longer a function, because the size will allow the inputs to be different than one another. In other words, for the input of CAPPUCCINO (M), Let’s say that we decide to modify the menu for the beverage of AMERICANO. In this case, there exists one INPUT (AMERICANO), which has NO OUTPUT associated with it. As a result, the menu is no longer a function. Revised Fall 2019 LS 30 Solutions Manual Page 2 0.0.0.1 Problem 1.2.3 Exercise 1.2.3 Use the two input-output pairs on the right side of Figure 1.15 to write the function g. Using Figure 1.15, we have the following combinations: Revised Fall 2019 LS 30 Solutions Manual Page 1 0.0.0.1 Problem 1.2.4 Exercise 1.2.4 Write the functions f and g in Figure 1.15 in function notation using formulas. As you can see, the value of the output is always \+2" of that of the input. As you can see, the value of the output is always \-1" of that of the input. Thus, in this case, the function notation for the function g is g(x) = x - 1 Revised Fall 2019 LS 30 Solutions Manual Page 1 0.0.0.1 Problem 1.2.5 We know that for this one, the function g is NOT defined when X - 5 = 0 ! X = 5. Thus, the function is defined over any domain, as long as that domain does not contain the value 5. Some example domains include: 1 0.0.0.1 Problem 1.2.6 Exercise 1.2.6 Describe the everyday function examples you came up with in Exercise 1.2.1 on page 9 in \function name : domain ! codomain" notation. As discussed, we can have the following combinations for this function: • The light switch is flipped upward ! the light is turned on (electricity flows through) • The light switch is flipped downward ! the light is turned off (electricity is cut off) In this case, we know that for each key that we presses, there will be a distinct sound emitted from the piano with a specific frequency. So in this case, we can notate the function (let’s just called it piano) in the following format: 1 0.0.0.1 Problem 1.2.7 Exercise 1.2.7 Suppose life is discovered on Mars. The Martians’ genetic code is remarkably similar to ours, but the RNA codon AUC is translated to serine 60% of the time and histidine 40% of the time. Is Martian gene expression a function? So in this case, we have a function: gene expression: sequence ! amino acid In this case, we have the following pairs of inputs and outputs: • gene expression(AUC) = serine (60% of the time) • gene expression(AUC) = histidine (40% of the time) 1 0.0.0.1 Problem 1.2.8 Exercise 1.2.8 As we saw earlier, a coffee shop menu is a function. Suppose that when you Part a: Refer to Figure 1.11 on page 9. What is the total cost of a mocha? A latte? Part b: Describe the process of finding the total cost in terms of function composition. In this case, we have two functions: 1 0.0.0.1 Problem 1.6.1 Exercise 1.6.1 Draw a time series graph that corresponds to this trajectory of temperature Important Note: A time series is a 2D-graph, where: • You have time as a variable on the x-axis • You have a state variable on the y-axis Let’s first trace the values of these points: on these information, we have the following data: Revised Fall 2019 LS 30 Solutions Manual 2 Our time series are therefore: Time Series for Temperature: • Month on the x-axis 1 2 3 4 5 6 7 8 9 10 11 12 Time Series for Day Length: For this graph, we have: 1 0.0.0.1 Problem 1.6.2 Exercise 1.6.2 Draw a trajectory corresponding to this time series of a person’s height and weight over the course of their life. time (years) Important Note: A trajectory is a nD-graph (where n 2 N), where you have a state variable represented on each axis. Based on these information, we have the following data: We also know that since we only have two state variables, our trajectory will be plotted on a 2D-graph. With these values and state variables, we can have one of the following two trajectories 1 0.0.0.1 Problem 1.6.3 Exercise 1.6.3 In this situation, why would the vector field not be a function? A trajectory describes the movement of the system through state space. Graphically speaking, it is a collection of the change vectors joined end to end, as the system changes from one state to the next. If two trajectories cross paths, we know that for that one intersection point, there are two possible \next states", depending on which trajectory you are on. In other words, for that one particular intersection point, there are two change vectors associated with it. We also know that the change vectors can be obtained using the vector fields. Unfortunately, this will mean that for one point in the state space, the vector fields will give more than one answer in the tangent space, which violates the definition of a function. [Show More]
Last updated: 1 year ago
Preview 1 out of 27 pages
Reviews( 0 )
Document information
Connected school, study & course
About the document
Uploaded On
Apr 13, 2022
Number of pages
27
Written in

Additional information
This document has been written for:
Uploaded
Apr 13, 2022
Downloads
0
Views
76
.png)


.png)